Full Text
The Full Text of this article is available as a PDF (78.7 KB).
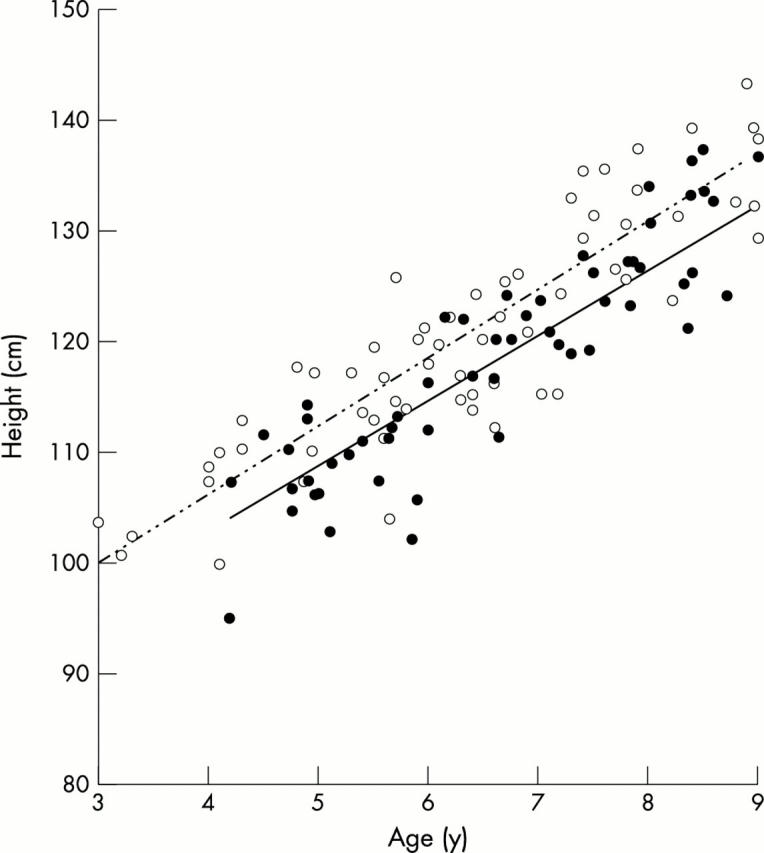
Figure 1 .

The relation of standing height and age in CC controls (closed circles) and AC controls (open circles). Individual data are shown. The solid line represents the regression line for CC controls (height = 6.41 age + 75.8, r2 = 0.81, p < 0.0001). The dashed line represents the regression line for AC controls (height = 6.05 age + 81.9, r2 = 0.78, p < 0.0001). (Not shown: regression line for SCD children: height = 5.73 age + 82.1, r2 = 0.76, p < 0.0001).


