Abstract
The trichostatin A (TSA)-sensitive histone deacetylase (HDAC) Rpd3p exists in a complex with Sin3p and Sap30p in yeast that is recruited to target promoters by transcription factors including Ume6p. Sir2p is a TSA-resistant HDAC that mediates yeast silencing. The transcription profile of rpd3 is similar to the profiles of sin3, sap30, ume6, and TSA-treated wild-type yeast. A Ume6p-binding site was identified in the promoters of genes up-regulated in the sin3 strain. Two genes appear to participate in feedback loops that modulate HDAC activity: ZRT1 encodes a zinc transporter and is repressed by RPD3 (Rpd3p is zinc-dependent); BNA1 encodes a nicotinamide adenine dinucleotide (NAD)-biosynthesis enzyme and is repressed by SIR2 (Sir2p is NAD-dependent). Although HDACs are transcriptional repressors, deletion of RPD3 down-regulates certain genes. Many of these are down-regulated rapidly by TSA, indicating that Rpd3p may also activate transcription. Deletion of RPD3 previously has been shown to repress (“silence”) reporter genes inserted near telomeres. The profiles demonstrate that 40% of endogenous genes located within 20 kb of telomeres are down-regulated by RPD3 deletion. Rpd3p appears to activate telomeric genes sensitive to histone depletion indirectly by repressing transcription of histone genes. Rpd3p also appears to activate telomeric genes repressed by the silent information regulator (SIR) proteins directly, possibly by deacetylating lysine 12 of histone H4. Finally, bioinformatic analyses indicate that the yeast HDACs RPD3, SIR2, and HDA1 play distinct roles in regulating genes involved in cell cycle progression, amino acid biosynthesis, and carbohydrate transport and utilization, respectively.
Reverse genetic or reverse chemical genetic approaches to the analysis of protein function require a broad search for phenotypes resulting from targeted (often deletion) mutations or from small molecules, respectively. Global mRNA expression monitoring (transcription profiling) has emerged as a useful method for searching broadly for phenotypes resulting from mutations or small molecules (1). The study of mutation-based perturbations (reverse genetics) is an inherently steady-state process because the phenotypic analysis is performed after a cell adapts to its altered genetic composition. In contrast, the study of small-molecule-based perturbations (reverse chemical genetics) allows the immediate effects of the perturbation to be assessed. Small molecules modulate function in cells rapidly, and global expression can be monitored at selected time points, allowing the time course of change to be assessed.
In this study, we combined reverse genetic and reverse chemical genetic experiments involving transcription profiling to study the function of histone deacetylases (HDACs) in Saccharomyces cerevisiae. HDACs are transcriptional repressors that reduce histone acetylation levels to create localized regions of repressed chromatin. The small molecules trapoxin and trichostatin A (TSA) were instrumental in the initial characterization of an HDAC, the mammalian HDAC1, which was found to be related in sequence to yeast Rpd3p (2). Consistent with its deacetylase function, deletion of RPD3 results in increased cellular histone acetylation (3). TSA treatment also has been shown to induce a hyperacetylated state in yeast (4). It is now known that at least six HDACs exist in yeast, encoded by the yeast genes RPD3, HDA1, HOS1, HOS2, HOS3, and SIR2. Of these, Rpd3p and Hda1p are sensitive to the HDAC inhibitor TSA. Hos3p and Sir2p are TSA-insensitive, Sir2p is activated by nicotinamide adenine dinucleotide (NAD), and little is known about Hos1p and Hos2p (5, 6). Rpd3p forms a complex with Sin3p and Sap30p that is recruited to DNA by the Ume6p transcription factor (7, 8). SIR2 is one of the silent information regulator (SIR) genes that mediate silencing (repression) at telomeres, mating type loci and ribosomal DNA (8, 9). In an apparent paradox, RPD3 deletion increases silencing of reporter genes inserted at these loci (3, 10, 11).
Although transcription profiles have been reported for a few HDAC deletions in yeast, analysis has been limited (12, 13). Here, we present transcription profiles of the yeast deletion strains rpd3, sin3, sap30, ume6, hda1, hos2, and hos3. In addition, we present profiles of wild-type yeast treated with TSA in concentration- and time-dependent manners. Bioinformatic analyses of these data in the context of existing profiling databases (12–16) yield a cohesive, global view of HDAC function.
Materials and Methods
Yeast Growth Conditions and Strains.
Single colonies of yeast were picked from fresh yeast extract/peptone/dextrose (YPD) plates and used to inoculate a 10-ml overnight culture YPD shaking at 250 rpm, 30°C. The next morning, the cultures were adjusted to 250 ml at OD600 = 0.06 and allowed to grow for ≈6 h before harvesting at OD600 = 1.0. Cells were harvested by centrifugation at 3,000 × g, the supernatant was discarded, and the cell pellets were flash-frozen in liquid nitrogen. Wild-type yeast was BY4741 (MATa his3Δ1 leu2Δ0 met15Δ0 ura3Δ0). Deletion mutants were purchased from Research Genetics (Huntsville, AL) and otherwise are isogenic with the wild-type strain. TSA titrations were taken from BY4741 grown for three generations in TSA at 10 nM, 50 nM, 250 nM, 1.25 μM, 6.25 μM, and 31.25 μM. TSA time courses were taken from BY4741 treated with 10 μM of TSA for 15, 30, 60, or 120 min. At 0 min, cells were at OD600 = 1.0.
Preparation of RNA.
Total RNA was prepared by the method of hot acidic phenol extraction. Briefly, cell pellets were resuspended in AE buffer (50 mM NaOAc, pH 5.3/10 mM EDTA) and adjusted to 1% SDS. To this was added 1 vol of hot acidic phenol (65°C). The mixture was vortexed vigorously for 10 sec and incubated for 20 min at 65°C with vortexing every 5 min for 5 sec. The aqueous layer was separated by centrifugation at 2,500 g for 10 min and extracted with an equal volume of chloroform. The RNA in the remaining aqueous layer then was precipitated by the addition of 1:10 (vol/vol) 3 M NaOAc, pH 5.3 and 2.5:1 (vol/vol) EtOH. After incubation at −20°C for 1 h, the nucleic acid was pelleted by centrifugation at 3,000 × g and washed once with 70% EtOH. Total RNA was dissolved in 10 mM Tris/1 mM EDTA, pH 7.5, and A260/A280 absorbance ratios were typically 2.0. mRNA was purified from total RNA by using Qiagen oligotex kits. Biotinylated cRNA probe for use in Affymetrix GeneChips were prepared according to the supplier's protocol (Affymetrix, Santa Clara, CA).
Microarrays.
Data for rpd3 and TSA titrations were obtained by using cDNA microarrays produced by Rosetta Inpharmatics (Kirkland, WA). Data for hos2, hos3, ume6, sap30, and the TSA time course were obtained by using Affymetrix S98 GeneChips. sin3 and hda1 profiles were determined independently on both platforms. The complete data sets from these profiling experiments are available on the web at www.schreiber.chem.harvard.edu.
Statistical Analysis.
The correlation coefficient was calculated from the following formula:
 |
where
 |
The P value of gene list similarities is derived from the following: n = the number of genes in the first list, M = the number of genes in the second list, I represents the intersection of the two lists, and U represents the union of the two lists. I is compared with the binomial distribution whose parameters are U and p, where P = (NM)/U2.
Results and Discussion
Comparisons of rpd3 and sin3 Profiles.
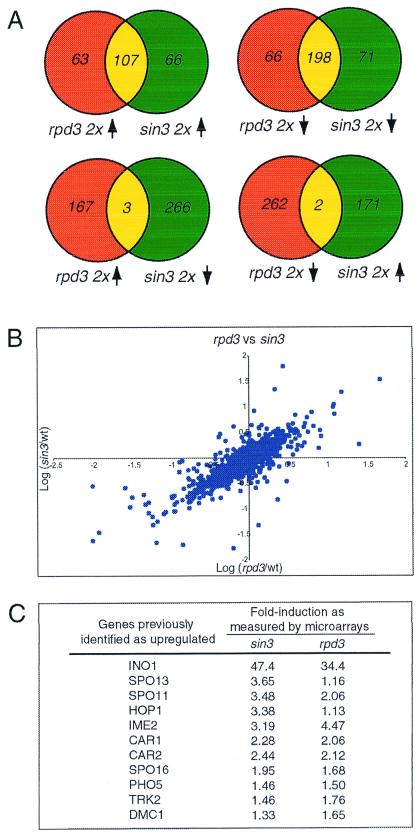
The rpd3 and sin3 profiles are similar in many respects. After elimination of data points that were suspect because of low signal or high background, lists of genes up- or down-regulated at least 2-fold were generated. There is very significant overlap between up-regulated genes in rpd3 and sin3 and between down-regulated genes in rpd3 and sin3 (Fig. 1A). There is almost no overlap between the up-regulated genes of either rpd3 or sin3 and the down-regulated genes of either sin3 or rpd3, respectively. The statistical correlation between these data sets is 0.85 (Fig. 1B). Combined with genetic data demonstrating that rpd3 and sin3 deletions are nonadditive, the results presented here argue that Sin3p and Rpd3p functions are linked and that loss of one protein results in complete loss of the linked function. Previous experiments have demonstrated that Sin3p and Rpd3p interact physically; the data provided herein lead to a model in which virtually all Rpd3p and Sin3p transcriptional functions in cells reside in Rpd3p-Sin3p corepressor complexes (7).
Figure 1.
The rpd3 and sin3 profiles are highly similar. (A) Venn diagrams comparing sets of up- and down-regulated genes from the rpd3 and sin3 data sets. (B) Plot of sin3-derived ratios vs. rpd3-derived expression ratios for each gene. A correlation of 0.85 is observed between the two data sets. (C) Transcripts previously identified as up-regulated in rpd3 or sin3 are also observed to be up-regulated in the microarray data.
Genetic studies have implicated RPD3 and SIN3 as negative transcriptional regulators of a diverse set of genes. Deletion of RPD3 or SIN3 results in greater than 2-fold up-regulation of 170 and 173 transcripts, respectively. Some of these up-regulated genes previously have been described as repressed by SIN3, RPD3, or both (Fig. 1C) (18–20). Although genes reported to be regulated by RPD3 and SIN3 were similarly affected in the profiles, the vast majority of up-regulated transcripts have not been described previously. Many of these include transcripts for proteins involved in meiosis and sporulation such as SPO16, SPO22, REC114, and MEI4. Finally, although RPD3 and SIN3 are reported to be repressors of transcription, a number of transcripts are down-regulated in their absence; loss of RPD3 or SIN3 results in the 2-fold down-regulation of 264 and 269 transcripts, respectively. These steady-state deletion profiles do not address whether down-regulated genes are direct targets of HDAC-mediated activation or are secondary effects. However, reverse chemical genetic experiments with the HDAC inhibitor TSA (see next sections) indicate that some may be direct targets of Rpd3p activation.
Identification of Transcription Factor-Binding Sites.
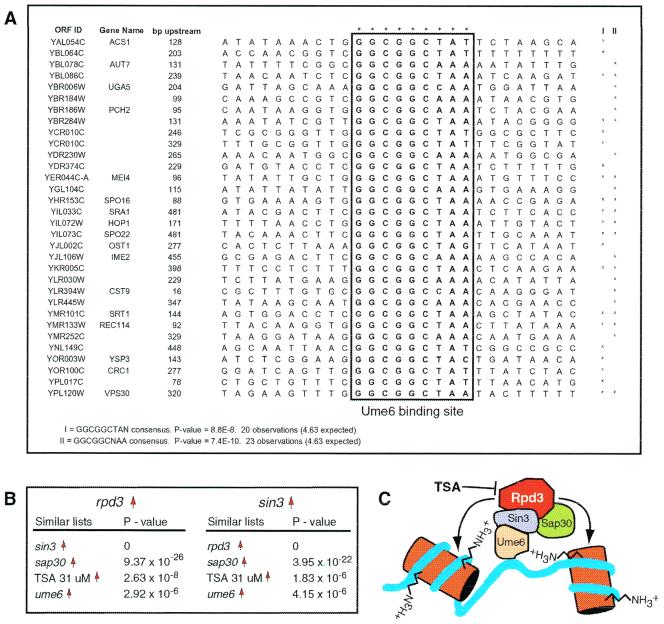
Broad transcriptional programs can be initiated by common transcription factors. In an effort to determine whether genes regulated by RPD3 and SIN3 were part of a larger, cohesive transcriptional program, the genes up-regulated more than 2-fold were analyzed. The DNA sequence for each gene was searched in a region between 10 and 500 bp upstream of the translation start site by using the genespring software suite. Parameters were set to identify common DNA elements up to 10 bp with single mismatches. When searching through the up-regulated set derived from the sin3 experiments, a number of consensus sequences emerged that were statistically significant. Of these, two similar sequences were of particular interest. The first sequence, “GGCGGCTAN,” has a P value of 8.8 × 10⁻⁸. The second sequence was related to the first, but with a different variable position, “GGCGGCNAA,” and a P value of 7.4 × 10⁻¹⁰. The P value represents the likelihood that this sequence was observed by chance alone. The sequences and their local context within the promoters are summarized in Fig. 2A.
Figure 2.
Transcription profiles support a model of HDAC function. (A) A common regulatory sequence, GGCGGCNAN, was found between 10 and 500 bp upstream of the translation start site for a subset of genes up-regulated in sin3. This sequence corresponds to the known regulatory sequence URS1, which is bound by Ume6p, a protein that recruits the Sin3p-Rpd3p corepressor complex (7). (B) Lists of genes up-regulated in the rpd3 and sin3 profiles are similar to lists of genes up-regulated in the sap30, ume6, and TSA data sets. This is consistent with the molecular model for Rpd3p function depicted in C.
The “GGCGGCNAN” sequence corresponds to a previously characterized transcription factor-binding site known as the URS1 site (20). Of the 131 URS1 sites identified upstream of a translation start site, 25 are upregulated more than 2-fold in the sin3 profile. Interestingly, URS1 sites are the targets of the Ume6p transcription factor and are found in the promoters of many meiosis-specific genes. Ume6p has been demonstrated to interact physically with the Sin3p-Rpd3p complex and also has been identified in the same genetic screen as SIN3 (7, 19). Of the known genes that were identified whose promoters contained the URS1 site, more than half are known to be either directly involved or induced in meiosis and sporulation, including AUT7, PCH2, MEI4, SPO16, HOP1, SPO22, IME2, and REC114. More than half of the ORFs for which no function is currently ascribed may also be involved in meiosis or sporulation. It is a validation of the genomic approach that a search of promoter sequences of genes up-regulated in sin3 revealed binding sites for Ume6p, a protein that mediates the physical interaction between Sin3p and DNA.
Similarities Between rpd3, sin3, sap30, and ume6 Profiles.
For every transcript array, lists of up-regulated and down-regulated genes were produced. Lists of genes up-regulated and down-regulated in the rpd3 profile correspond most closely with up-regulated and down-regulated lists, respectively, from the sin3 (P = 0.0) and sap30 (P = 9.37 × 10⁻²⁶) profiles (Fig. 2B). The list of up-regulated genes in the rpd3 profile modestly corresponds with the list of up-regulated genes from the ume6 profile (P = 2.92 × 10⁻⁶). However, there is no correspondence between down-regulated genes in these two data sets.
The above analysis provides a powerful method for assigning gene function. Lists derived from perturbation of proteins directly interacting with Rpd3p (Sin3p, Sap30p) show exquisitely high levels of statistical similarity. Ume6p has both positive and negative regulatory functions that are only partially mediated through the Sin3p-Rpd3p corepressor complex. Accordingly, there is less similarity between the ume6 and rpd3 profiles than between the sap30, sin3, and rpd3 profiles. Our observation that ume6-down-regulated genes do not correspond to rpd3-, sin3-, or sap30-down-regulated genes implies that Ume6p recruitment of the HDAC complex results only in repression. A model for Rpd3p, Sin3p, Sap30p, and Ume6p function is illustrated in Fig. 2C.
The TSA Profile Reflects Inhibition of Rpd3p and Hda1p.
Hierarchical clustering of multiple data sets derived from yeast treated with varying concentrations of TSA over a 5-h period reveals clusters of genes up-regulated and down-regulated by TSA in a dose-dependent manner. Selection of a subset of maximally affected genes and searching for similar gene lists reveal the targets of TSA. Genes up-regulated by TSA correspond to genes up-regulated in the rpd3 (P = 7.01 × 10⁻¹⁰), sap30 (P = 8.39 × 10⁻⁹), sin3 (P = 9.08 × 10⁻⁸), and hda1 (P = 2.8 × 10⁻³) data sets. These findings are consistent with the prior classification of Rpd3p and Hda1p as TSA-sensitive HDACs and with the model for Rpd3p function summarized in Fig. 2C. The sir2 and hos3 profiles were not detected in similarity searches, consistent with the prior classification of Sir2p and Hos3p as TSA-resistant (12).
A kinetic time course of TSA treatment also was obtained. Genes up-regulated at 15, 30, 60, and 120 min correlate with up-regulated genes in the rpd3, sin3, and sap30 profiles. Genes down-regulated by TSA correspond with down-regulated genes in the rpd3 and sin3 profiles. Surprisingly, TSA treatment also results in the rapid down-regulation of certain genes (within 15 min of exposure to compound), suggesting that HDACs may also function as direct transcriptional activators. Overall, the profiles indicate that the primary effect of TSA treatment is inhibition of Rpd3p.
Feedback Loops Modulate HDAC Activity.
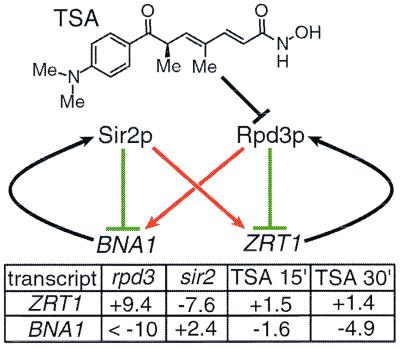
RPD3 deletion leads to the 2-fold up-regulation and down-regulation of 170 and 264 genes, respectively. Among the most highly regulated genes are ZRT1, encoding a zinc transporter, and BNA1, encoding an NAD-biosynthesis enzyme. ZRT1 is up-regulated 9-fold by RPD3 deletion whereas BNA1 is down-regulated more than 10-fold. ZRT1 is rapidly up-regulated by TSA (1.5-fold after 15 min), suggesting that it is a direct target of Rpd3p repression. Surprisingly, BNA1 is down-regulated rapidly by TSA (1.6-fold after 15 min), suggesting that it is directly activated by Rpd3p. Interestingly, both genes also are regulated by SIR2, but in opposite directions. SIR2 deletion results in the 7-fold down-regulation of ZRT1 and in the 2.4-fold up-regulation of BNA1 (12) (B.E.B. and S.L.S., unpublished results). To summarize, ZRT1 is repressed by RPD3 but activated by SIR2, whereas BNA1 is repressed by SIR2 but activated by RPD3 (Fig. 3).
Figure 3.
Feedback inhibition modulates HDAC activity. Two genes were identified as potential modulators of RPD3- and SIR2-mediated repression: the zinc transporter gene, ZRT1, is repressed by the zinc-dependent HDAC, Rpd3p; the NAD-biosynthesis gene, BNA1, is repressed by the NAD-dependent HDAC, Sir2p (12) (B.E.B. and S.L.S., unpublished results). Interestingly, RPD3 activates BNA1, and SIR2 appears to activate ZRT1. The particular acetylation pattern induced by these HDACs may, in certain cases, activate transcription (see text and Fig. 5). Fold changes induced by RPD3 deletion, SIR2 deletion, and by 15 min and 30 min TSA treatments are shown.
A possible explanation for the effects of RPD3 and SIR2 on these transcripts relates to the chemistry of their gene products. Rpd3p is a zinc-dependent HDAC; by repressing the zinc transporter, ZRT1, Rpd3p may decrease intracellular zinc concentrations and, thereby, decrease its own activity. Similarly, Sir2p is an NAD-dependent HDAC; by repressing the NAD-biosynthesis enzyme, BNA1, Sir2p may decrease NAD concentrations and, thereby, decrease its own activity. Indeed, deletion of another NAD-biosynthesis enzyme, NPT1, confers a SIR2 null-like phenotype (21, 22).
A process in which RPD3- and SIR2-mediated gene repression is regulated by feedback loops involving ZRT1 and BNA1 is not surprising. However, the observation that RPD3 and SIR2 exert opposite effects was unexpected. Further analysis reveals other genes inversely regulated by RPD3 and SIR2. Of the 57 genes up-regulated 2-fold by deletion of SIR2, 18 are down-regulated 2-fold by deletion of RPD3. We considered the possibility that deletion of RPD3 derepressed SIR2 and that SIR2, in turn, down-regulated these genes. However, neither SIR2 nor its partners, SIR3 or SIR4, are up-regulated by RPD3 deletion. Furthermore, analysis of the TSA time course suggests that Rpd3p plays a direct role in the activation of these genes: of these 18 transcripts, 7 are down-regulated more than 1.25-fold after 15 min of TSA treatment.
Sir2p also may activate a subset of genes. Although only 10 genes are down-regulated 2-fold by SIR2 deletion, 5 of these are up-regulated by RPD3 or HDA1 deletion. Two others, PHO5 and RME1, have been linked previously to RPD3 and are up-regulated to lesser extents in the rpd3 profile (23, 24). SIR2 deletion does not affect transcript levels of the RPD3 or HDA1 genes themselves. Although not currently available, a specific small molecule inhibitor of Sir2p would be instrumental in discerning whether this HDAC plays a direct role in gene activation.
RPD3-Mediated Gene Activation and Silencing in Yeast.
Transcription profiles of deletion mutants and TSA-treated wild-type yeast indicate that Rpd3p directly activates certain genes, several of which are repressed by Sir2p. A possible explanation for this result is as follows. Histone H4 lysine 12 is acetylated at silenced loci in yeast (25). Acetylation of this lysine appears to facilitate interaction with Sir3p and may be of general importance for silencing (26, 27). A well characterized activity of Rpd3p is deacetylation of histone H4 lysine 12 (3). Hence, deacetylation of lysine 12 by Rpd3p in certain cases may activate transcription by preventing binding of the repressive SIR complex.
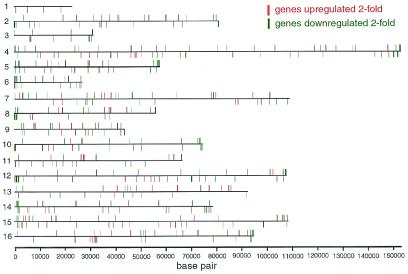
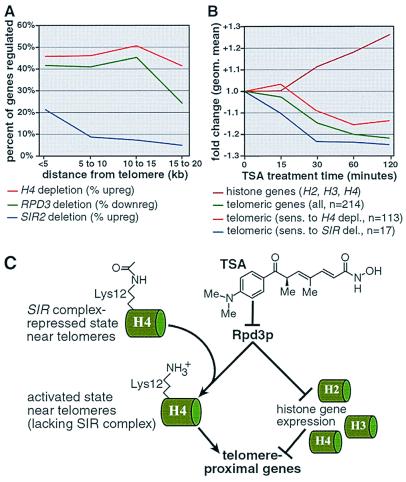
A scenario in which Rpd3p activates transcription via SIR proteins is not unexpected. RPD3 deletion increases repression of reporter genes inserted at “silenced” loci, including telomeres, mating type loci, and rDNA (3, 10, 11). Although a mechanism for this effect has not yet been elucidated, it is partially dependent on SIR proteins (11, 28). Transcription profiling provides a unique opportunity to observe the regulation of endogenous genes located near telomeres (Fig. 4). Consistent with its effect on artificially inserted reporters, deletion of RPD3 leads to the 2-fold down-regulation of 40% of genes located within 20 kb of the telomeres. The geometric mean fold-change for all telomeric genes (within 20 kb) is −2.0-fold. Although a minority of these down-regulated genes are repetitive sequences, transcription profiling confirms that RPD3 abrogates silencing of many endogenous telomeric genes.
Figure 4.
Chromosomal view of RPD3-regulated genes. RPD3 deletion results in the 2-fold up-regulation of 170 genes (depicted in red) and the 2-fold down-regulation of 264 genes (depicted in green). One hundred of the down-regulated genes are located within 20 kb of telomeric ends.
We wondered whether abrogation of telomeric silencing by Rpd3p might be a consequence of deacetylation of lysine 12 and subsequent disruption of SIR-mediated repression. Therefore, we compared the RPD3 deletion profile with profiles of SIR deletions. Transcription profiles of SIR mutants indicate that these proteins repress genes located within 5–10 kb of the ends of the telomeres (13). In contrast, we find that RPD3 deletion down-regulates genes within 15–20 kb of these ends (Fig. 5A). Thus, it appears unlikely that the effects of RPD3 deletion on silencing are mediated solely by SIR proteins. Repression at silenced loci in yeast is also dependent on histone concentrations (28, 29). Depletion of histone H4 up-regulates telomeric genes (13). Transcripts for histones genes are up-regulated by RPD3 deletion and by treatment with TSA. Furthermore, like RPD3 deletion, the effects of histone depletion extend 15–20 kb from the telomeres (Fig. 5A) (13). Hence, abrogation of telomeric silencing by RPD3 likely is due, in part, to repression of histone genes.
Figure 5.
RPD3 disruption represses genes near telomeric ends. (A) RPD3 deletion and histone H4 depletion both regulate genes within 15–20 kb of telomere ends. In contrast, SIR2 deletion regulates genes within 5–10 kb of these ends (13). (B) Like RPD3 deletion, TSA treatment down-regulates telomeric genes. Telomeric genes sensitive to SIR deletion (12) are repressed rapidly by TSA. Telomeric genes sensitive to H4 depletion (13) are slowly repressed by TSA. Like RPD3 deletion, TSA up-regulates histone genes. Taken together, these data support a model in which RPD3 abrogates telomeric silencing via the direct and indirect mechanisms outlined in C. (C) Rpd3p appears to activate telomeric genes directly by deacetylating histone H4 lysine 12 and, thereby, hindering repression by SIR proteins. Rpd3p appears to activate telomeric genes indirectly by repressing histone genes.
Time courses of the effects of small molecule inhibitors are useful for discerning between primary (direct) and secondary (transcriptionally mediated) effects of gene (or gene product) modulation. To obtain insight into the mechanism by which Rpd3p abrogates repression of telomeric genes, we analyzed the TSA time course profiles. TSA treatment, like RPD3 deletion, represses telomeric genes. The geometric mean fold-change of all genes within 20 kb of the telomeres was plotted over the 2-h TSA time course (Fig. 5B). Repression of telomeric genes begins within 15 min. After 60 min, these genes are down-regulated an average of 1.2-fold. The geometric means of two additional gene subsets also were plotted (Fig. 5B). The first subset contains telomeric genes sensitive to histone depletion (13). The second contains telomeric genes regulated by the SIR proteins (12, 13). Telomeric genes sensitive to histone protein dosage are repressed after 30 min of treatment. However, on average, these genes remain unchanged at the 15-min time point. This kinetic profile is consistent with a secondary, transcriptionally mediated effect. Because histone genes are induced by TSA treatment, histone proteins likely mediate repression of this subset of telomeric genes (Fig. 5B). In contrast, we find that telomeric genes regulated by SIR genes are repressed after 15 min of TSA treatment, suggesting they are directly activated by Rpd3p. This observation is consistent with a mechanism in which RPD3 deletion increases silencing by increasing histone H4 lysine 12 acetylation levels, thereby facilitating SIR-mediated repression (Fig. 5C). In conclusion, Rpd3p appears to abrogate telomeric silencing by direct and indirect mechanisms involving deacetylation of a specific histone residue and repression of histone gene expression, respectively.
RPD3, HDA1, and SIR2 Have Overlapping and Distinct Regulatory Roles.
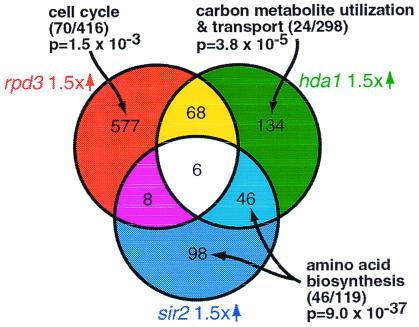
In an attempt to obtain a more general view of HDAC function, we compared genes up-regulated 1.5-fold in the profiles of rpd3, sir2, and hda1. With respect to these genes, sir2 and hda1 correspond (P = 1.17 × 10⁻²⁶), rpd3 and hda1 correspond (P = 2.60 × 10⁻¹¹), but rpd3 and sir2 do not correspond (Fig. 6). Hence, RPD3 and HDA1, as well as SIR2 and HDA1, appear to have overlapping cellular functions. This is consistent with previous reports that RPD3 and HDA1 deletions have similar effects on global histone acetylation levels, yeast silencing, aging, and CUP1 promoter activity (3, 10, 11). The profiles also point to an as yet unidentified commonality between HDA1 and SIR2 function.
Figure 6.
RPD3, HDA1, and SIR2 influence distinct functional classes. Lists of genes up-regulated at least 1.5-fold in the rpd3, hda1, and sir2 (12) profiles are compared in a Venn diagram. Bioinformatic analysis suggests that RPD3 influences cell cycle progression, HDA1 influences carbon metabolite and carbohydrate transport and utilization, and SIR2 influences amino acid biosynthesis. The number of genes in the functional class regulated by the deletion/total number of genes in the functional class are shown in parentheses.
Cellular functions that are unique to a particular HDAC are of special interest. Therefore, we generated lists of genes specifically up-regulated by deletion of one (or, in some cases, two) of the major yeast HDACs (Fig. 6). Bioinformatic analyses suggest that each HDAC influences distinct cellular processes. For example, the list of genes up-regulated by HDA1 deletion, but not RPD3 or SIR2 deletion, contains a statistical overrepresentation of carbon metabolite and carbohydrate utilization and transport genes (as identified by MIPS, the Munich Information Center for Protein Sequences) with a P value of 3.8 × 10⁻⁵. HDA1 deletion does not affect genes that “regulate” carbon metabolite and carbohydrate utilization and transport (these regulators constitute a separate MIPS class). Carbon metabolism genes are up-regulated during the diauxic shift, whereas HDA1 is down-regulated (14). Thus, up-regulation of this functional class in response to nutrient deprivation may be partially mediated by HDA1. The list of genes up-regulated by deletion of SIR2 (and to a lesser degree HDA1), but not RPD3, corresponds to a MIPS list of amino acid biosynthesis genes (P = 9.0 × 10−37). These genes are not located at traditional “silenced” loci. Therefore, in addition to mediating silencing at mating loci, rDNA repeats, and telomeres, SIR2 appears to repress amino acid biosynthesis genes. Several of these genes are down-regulated in the rpd3 profile (P = 3.5 × 10⁻⁴). Hence, as is the case for ZRT1, BNA1, and yeast silencing, Rpd3p and Sir2p appear to exert opposite effects on amino acid biosynthesis genes.
Finally, the list of genes up-regulated by RPD3, but not HDA1 or SIR2, deletion corresponds to a list of genes that fluctuate with cell cycle periodicity (P = 1.5 × 10⁻³) (15). Although RPD3 regulates meiosis genes via UME6 (20, 30), its influence on cell cycle periodic genes appears to be distinct. Of the 70 cell cycle regulated genes affected by RPD3 deletion, only 2 relate to meiosis (MIPS classification). We speculate that RPD3 directly or indirectly influences expression of cell cycle-regulated genes. A role for chromatin acetylation and remodeling in cell cycle regulation has been documented (31). RPD3 is necessary for cell cycle-regulated histone acetylation at the HO locus, as well as cell cycle-dependent down-regulation of the G1 cyclin CLN3 (32, 33). Finally, excess histone deacetylation by RPD3 is reportedly responsible for mitotic arrest in an ESS1 temperature-sensitive strain, an effect that is overcome by treatment with TSA (34). Further investigations are necessary to clarify the role of Rpd3p in cell cycle regulation.
The possibility that different HDACs play distinct roles in regulating genes involved in cell cycle progression, amino acid biosynthesis, and carbohydrate transport and utilization suggests that small molecule inhibitors specific to particular HDACs will induce distinct physiologic responses. This may be particularly informative and useful in higher eukaryotes in which various HDACs have distinct tissue specificities, activities, and disease associations.
Acknowledgments
The rpd3, sin3, hda1, and TSA-titration arrays were produced by Matthew Marton, Chris Roberts, and Stephen Friend of Rosetta Inpharmatics. Technical assistance with Affymetrix GeneChips was provided by the Howard Hughes Medical Institute–Massachusetts Institute of Technology Biopolymers facility. We thank Finny Kuruvilla, Christina Grozinger, James Hardwick, and Julie Sneddon for helpful discussions. We are especially grateful to Chris Hassig and Dan Gottschling for critical readings of the manuscript. This research was supported by a grant from the National Institute of General Medical Sciences. J.K.T. was the recipient of a Fellowship from the National Science Foundation. S.L.S. is an investigator at the Howard Hughes Medical Institute.
Abbreviations
- HDAC
histone deacetylase
- TSA
trichostatin
- SIR
silent information regulator
- NAD
nicotinamide adenine dinucleotide
Footnotes
Article published online before print: Proc. Natl. Acad. Sci. USA, 10.1073/pnas.250477697.
Article and publication date are at www.pnas.org/cgi/doi/10.1073/pnas.250477697
References
- 1.Brown P O, Botstein D. Nat Genet. 1999;21:33–37. doi: 10.1038/4462. [DOI] [PubMed] [Google Scholar]
- 2.Taunton J, Hassig C A, Schreiber S L. Science. 1996;272:408–411. doi: 10.1126/science.272.5260.408. [DOI] [PubMed] [Google Scholar]
- 3.Rundlett S E, Carmen A A, Kobayashi R, Bavykin S, Turner B M, Grunstein M. Proc Natl Acad Sci USA. 1996;93:14503–14508. doi: 10.1073/pnas.93.25.14503. [DOI] [PMC free article] [PubMed] [Google Scholar]
- 4.Ekwall K, Olsson T, Turner B M, Cranston G, Allshire R C. Cell. 1997;91:1021–1032. doi: 10.1016/s0092-8674(00)80492-4. [DOI] [PubMed] [Google Scholar]
- 5.Carmen A A, Griffin P R, Calaycay J R, Rundlett S E, Suka Y, Grunstein M. Proc Natl Acad Sci USA. 1999;96:12356–12361. doi: 10.1073/pnas.96.22.12356. [DOI] [PMC free article] [PubMed] [Google Scholar]
- 6.Imai S, Armstrong C M, Kaeberlein M, Guarente L. Nature (London) 2000;403:795–800. doi: 10.1038/35001622. [DOI] [PubMed] [Google Scholar]
- 7.Kadosh D, Struhl K. Cell. 1997;89:365–371. doi: 10.1016/s0092-8674(00)80217-2. [DOI] [PubMed] [Google Scholar]
- 8.Zhang Y, Sun Z W, Iratni R, Erdjument-Bromage H, Tempst P, Hampsey M, Reinberg D. Mol Cell. 1998;1:1021–1031. doi: 10.1016/s1097-2765(00)80102-1. [DOI] [PubMed] [Google Scholar]
- 9.Gottschling D E, Aparicio O M, Billington B L, Zakian V A. Cell. 1990;63:751–762. doi: 10.1016/0092-8674(90)90141-z. [DOI] [PubMed] [Google Scholar]
- 10.Guarente L. Genes Dev. 2000;14:1021–1026. [PubMed] [Google Scholar]
- 11.De Rubertis F, Kadosh D, Henchoz S, Pauli D, Reuter G, Struhl K, Spierer P. Nature (London) 1996;384:589–591. doi: 10.1038/384589a0. [DOI] [PubMed] [Google Scholar]
- 12.Sun Z W, Hampsey M. Genetics. 1999;152:921–932. doi: 10.1093/genetics/152.3.921. [DOI] [PMC free article] [PubMed] [Google Scholar]
- 13.Hughes T R, Marton M J, Jones A R, Roberts C J, Stoughton R, Armour C D, Bennett H A, Coffey E, Dai H, He Y D, et al. Cell. 2000;102:109–126. doi: 10.1016/s0092-8674(00)00015-5. [DOI] [PubMed] [Google Scholar]
- 14.Wyrick J J, Holstege F C, Jennings E G, Causton H C, Shore D, Grunstein M, Lander E S, Young R A. Nature (London) 1999;402:418–421. doi: 10.1038/46567. [DOI] [PubMed] [Google Scholar]
- 15.DeRisi J L, Iyer V R, Brown P O. Science. 1997;278:680–686. doi: 10.1126/science.278.5338.680. [DOI] [PubMed] [Google Scholar]
- 16.Cho R J, Campbell M J, Winzeler E A, Steinmetz L, Conway A, Wodicka L, Wolfsberg T G, Gabrielian A E, Landsman D, Lockhart D J, et al. Mol Cell. 1998;2:65–73. doi: 10.1016/s1097-2765(00)80114-8. [DOI] [PubMed] [Google Scholar]
- 17.Spellman P T, Sherlock G, Zhang M Q, Iyer V R, Anders K, Eisen M B, Brown P O, Botstein D, Futcher B. Mol Biol Cell. 1998;9:3273–3297. doi: 10.1091/mbc.9.12.3273. [DOI] [PMC free article] [PubMed] [Google Scholar]
- 18.Hepworth S R, Friesen H, Segall J. Mol Cell Biol. 1998;18:5750–5761. doi: 10.1128/mcb.18.10.5750. [DOI] [PMC free article] [PubMed] [Google Scholar]
- 19.Strich R, Slater M R, Esposito R E. Proc Natl Acad Sci USA. 1989;86:10018–10022. doi: 10.1073/pnas.86.24.10018. [DOI] [PMC free article] [PubMed] [Google Scholar]
- 20.Bowdish K S, Mitchell A P. Mol Cell Biol. 1993;13:2172–2181. doi: 10.1128/mcb.13.4.2172. [DOI] [PMC free article] [PubMed] [Google Scholar]
- 21.Lin S J, Defossez P A, Guarente L. Science. 2000;289:2126–2128. doi: 10.1126/science.289.5487.2126. [DOI] [PubMed] [Google Scholar]
- 22.Smith J S, Brachmann C B, Celic I, Kenna M A, Muhammad S, Starai V J, Avalos J L, Escalante-Semerena J C, Grubmeyer C, Wolberger C, et al. Proc Natl Acad Sci USA. 2000;97:6658–6663. doi: 10.1073/pnas.97.12.6658. [DOI] [PMC free article] [PubMed] [Google Scholar]
- 23.Vidal M, Gaber R F. Mol Cell Biol. 1991;11:6317–6327. doi: 10.1128/mcb.11.12.6317. [DOI] [PMC free article] [PubMed] [Google Scholar]
- 24.Vidal M, Strich R, Esposito R E, Gaber R F. Mol Cell Biol. 1991;11:6306–6316. doi: 10.1128/mcb.11.12.6306. [DOI] [PMC free article] [PubMed] [Google Scholar]
- 25.Braunstein M, Sobel R E, Allis C D, Turner B M, Broach J R. Mol Cell Biol. 1996;16:4349–4356. doi: 10.1128/mcb.16.8.4349. [DOI] [PMC free article] [PubMed] [Google Scholar]
- 26.Kelly T J, Qin S, Gottschling D E, Parthun M R. Mol Cell Biol. 2000;20:7051–7058. doi: 10.1128/mcb.20.19.7051-7058.2000. [DOI] [PMC free article] [PubMed] [Google Scholar]
- 27.Hecht A, Laroche T, Strahl-Bolsinger S, Gasser S M, Grunstein M. Cell. 1995;80:583–592. doi: 10.1016/0092-8674(95)90512-x. [DOI] [PubMed] [Google Scholar]
- 28.Smith J S, Caputo E, Boeke J D. Mol Cell Biol. 1999;19:3184–3197. doi: 10.1128/mcb.19.4.3184. [DOI] [PMC free article] [PubMed] [Google Scholar]
- 29.Kaufman P D, Cohen J L, Osley M A. Mol Cell Biol. 1998;18:4793–4806. doi: 10.1128/mcb.18.8.4793. [DOI] [PMC free article] [PubMed] [Google Scholar]
- 30.Cosma M P, Tanaka T, Nasmyth K. Cell. 1999;97:299–311. doi: 10.1016/s0092-8674(00)80740-0. [DOI] [PubMed] [Google Scholar]
- 31.Wu M, Newcomb L, Heideman W. J Bacteriol. 1999;181:4755–4760. doi: 10.1128/jb.181.16.4755-4760.1999. [DOI] [PMC free article] [PubMed] [Google Scholar]
- 32.Krebs J E, Kuo M H, Allis C D, Peterson C L. Genes Dev. 1999;13:1412–1421. doi: 10.1101/gad.13.11.1412. [DOI] [PMC free article] [PubMed] [Google Scholar]
- 33.Arevalo-Rodriguez M, Cardenas M E, Wu X, Hanes S D, Heitman J. EMBO J. 2000;19:3739–3749. doi: 10.1093/emboj/19.14.3739. [DOI] [PMC free article] [PubMed] [Google Scholar]


