

Abstract
The availability of genome sequences from a variety of organisms presents an opportunity to apply this sequence information to solving the key problems of molecular biology. One of the principal roadblocks on this path is the lack of appropriate descriptors and metrics that could succinctly represent the new knowledge stemming from the genomic data. Several new metrics have recently been used in comparative genome analysis, yet challenges remain in finding an appropriate language for the emerging discipline of systems biology.
Introduction
The genomic revolution, which started 11 years ago with the completion of the genome sequence of the bacterium Haemophilus influenzae and culminated in 2004 with the sequencing of the human genome, had an enormous impact on the very nature of life science research. Genome-derived information is now paving the way to a consistent quantitative description of all processes in a living cell, the systems biology of the cell. The influx of genomic data has been most profound in prokaryotic genomics, which has experienced exponential growth with the number of sequenced genomes doubling every 16 months [1]. The advantages of having a complete genome sequence are well-known and have been repeatedly highlighted in the past (e.g. [2]). However, these benefits are often limited by the inability of standard (automated) methods of genome analysis to perform three tasks: to assign function to as much as one-third of the genes; to reliably predict existing and missing metabolic pathways and environmental sensing mechanisms; and to highlight unexpected discoveries and suggest practical uses for the sequenced genome [3,4]. The overwhelming diversity of life, revealed by the genome and metagenome sequencing projects, calls for new approaches to comparative genomics, which will require the introduction of appropriate new descriptors. These new metrics — integral parameters that could be used to describe newly sequenced genomes and put them into a proper framework — will ultimately play a major role in defining the discipline of systems biology. Here, we briefly outline recent trends in comparative genome analysis and discuss some new metrics that have been used in the past few years. As most eukaryotic genomes remain only partly finished, we primarily focus on the analysis of prokaryotic genomes.
Emerging standards in genome description
In the past 11 years, close to 400 complete bacterial, archaeal and eukaryotic genomes have been sequenced, resulting in more than 200 published papers. After a brief initial period, there emerged a clear pattern whereby nearly every paper describing a newly sequenced genome presented a standard list of genome parameters, followed by a brief discussion of the distinctive features of the sequenced organism. These standard parameters typically include genome size, GC content, the number of stable RNA- and protein-coding genes, the fraction of the genes with a functional annotation, and several others (Box 1). Obviously, genome sequences allow ample opportunities for more in-depth analyses. Recent examples of these include the use of whole-genome data to assemble an improved tree of life [5,6,7•,8•], to reconstruct metabolic pathways in terms of existing and ‘missing’ genes [9,10], to evaluate the number and distribution of various protein folds [11,12] and to determine the fraction of laterally transferred genes [13–15]. At the same time, some of the more ambitious goals of genome analysis remain to be achieved. For example, despite intensive research efforts, the mechanisms of microbial thermophily, psychrophily, halophily, alkalophily, and resistance to radiation and dessication still remain obscure, which makes it impossible at this time to predict these traits from genomic sequences. Likewise, there has been only limited success in using genomic information to design synthetic growth media for fastidious pathogens, which would have helped in fighting syphilis, Lyme disease, spotted fever and other bacterial infections. Up until now, all completely sequenced genomes came from cultivated microorganisms, the growth conditions of which, even if suboptimal, were known. This is not the case for sequences coming from metagenomic projects, which will force us to describe properties of the source organisms solely on the basis of sequence data.
Box 1 Standard parameters of genome description
General features of the genome
DNA: genome size, G+C content, GC skew
Insertion sequences: number, fraction of the genome
RNA: tRNA genes, rRNA genes, small nucleolar RNAs, riboswitches
Proteins: total number of proteins, percentage with known function, percentage ‘hypothetical’, phylogenetic distribution of the best hits, percentage transmembrane proteins, percentage transporters
Deduced metabolic properties
Aerobic/anaerobic, obligate/facultative, Gram-positive or Gram-negative, spore-forming or not
Energy source: autotrophic or heterotrophic, lithotrophic or phototrophic
Carbon source: CO, CO2, methylotrophy, saccharolysis, proteolytic
Sources of nitrogen, phosphorus, sulfur, iron and uptake mechanisms
Biosynthetic pathways: nucleotide, amino acid, cofactor, lipid Secondary metabolism, xenobiotics
Organism-level adaptations
Signaling systems: number of histidine kinases, response regulators
Intracellular organelles: thylakoids, heterocysts, spores, storage granules
Pathogenic and defense mechanisms
To measure how much is known about an organism with a completely sequenced genome, Janssen and colleagues introduced a novel metric, termed the ‘species knowledge index’ (SKI). It is calculated simply as the number of PubMed abstracts mentioning the given species divided by the number of predicted protein-encoding genes [16•]. According to the authors, the average number of abstracts per gene for the first 200 genomes is somewhere between 0.9 and 5, with the obvious exception of human, mouse, well-studied model organisms such as Escherichia coli, Bacillus subtilis and yeast, and some important pathogens. Naturally, some organisms are covered very poorly or not covered at all. For example, Acidobacteria bacterium Ellin345, the first sequenced representative of the phylum Acidobacteria, has been previously mentioned in a single publication [17] and never described in any detail.
Genome-based phylogeny
Phylogeny is one of the areas that benefited most from genome sequencing. It can now rely on whole-genome data to build a better tree of life than was afforded by 16S rRNA sequences. Konstantinides and Tiedje introduced two simple integral parameters: ‘average nucleotide identity’ (ANI), as a measure of genome relatedness at the species level, and ‘average amino acid identity’ (AAI), as a measure of phylogenetic proximity for higher taxa [18•,19•]. The phylogenetic tree built on the basis of AAI, as well as those based on the alignment of universally conserved protein sequences (e.g. ribosomal proteins, RNA polymerase subunits and such), proved to be remarkably similar to the 16S rRNA-based tree [5,6,7•,8•,19•], suggesting that all these trees actually reflect the evolutionary history of the prokaryotic world.
However, genomic comparisons revealed a significant variance (up to tenfold in some phyla) in genome sizes and the numbers of encoded proteins of supposedly closely related organisms, illuminating the need for new measures of genome relatedness that would take into account the differences in gene content. Even at the species level, several strains of Prochlorococcus marinus, with 97–99% rRNA identity, were found to encode dramatically different protein sets [20]. For pairwise comparisons, genome relatedness can be described with an ‘orthology coefficient’, the fraction of genes that form orthologous pairs in the two genomes [21]. For closely related genomes, the degree of synteny, the fraction of genes that are orthologous and located in co-linear fragments of the genome, can be used as well [22,23]. Another recently introduced metric is ‘genome conservation’, a measure of evolutionary distance between species that takes into account both gene content and sequence similarity at the whole-genome level and allows for apparently accurate phylogenetic reconstructions [7•]. In addition, a measure of the degree of horizontal gene transfer (HGT) between different nodes of the phylogenetic tree, ‘HGT vine width’ was introduced, and a three-dimensional plot (Figure 1) suggested as a better representation of the tree of life than the traditional two-dimensional tree [8•]. For comparing several related genomes, it proved very useful to divide all genes into two categories, those shared by every organism in the given set (referred to as a ‘conserved gene core’ or ‘genome signature’), and those found only in some genomes (referred to as a ‘variable shell’) and to compare the number of the genes in each category [20,24–27].
Figure 1.
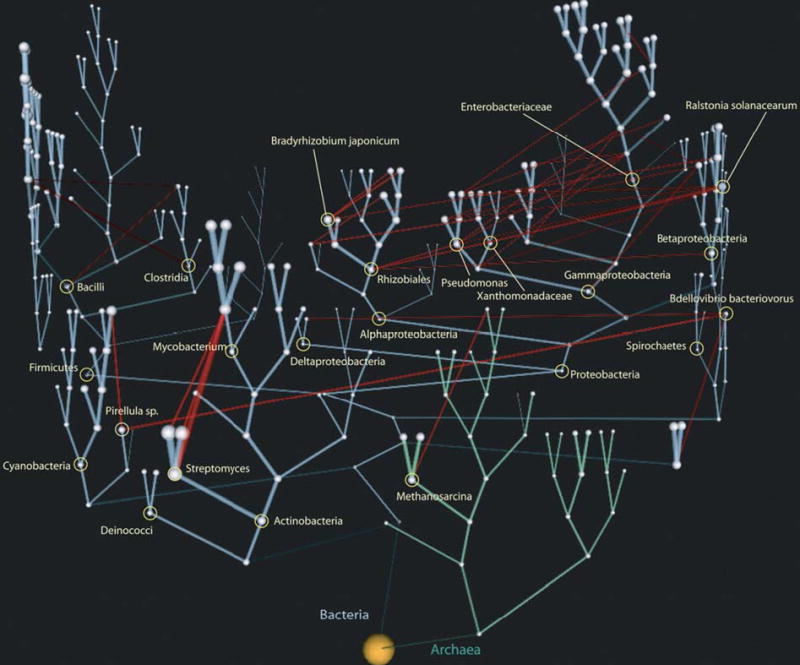
The tree of life in three dimensions. The plot, taken from [8•], reflects the ‘genome conservation’ and ‘horizontal gene transfer vine width’ data. Individual taxonomic nodes are shown as white spheres, the diameters of which reflect the number of node-specific gene families. The bacterial phylogenetic tree is in cyan and the archaeal tree in light green. Red lines indicate the horizontal gene transfer. The width of each line reflects the number of gene families transferred along that line. Reprinted with permission from Genome Res 2005, 15:954–959.
Defining protein function on a genome scale
One of the intrinsic problems illuminated by comparative genome analysis is the paucity of appropriate descriptors for protein function and the degree of confidence that the ascribed function is correct. The Gene Ontology (GO) project [28] was extremely successful in categorizing proteins with known — and relatively simple — functions (e.g. enzymes and transcriptional regulators). At the same time, categorization of poorly characterized proteins that fall into the ‘twilight zone’ or ‘grey area’ of sequence similarity [29,30] and are often referred to as ‘hypothetical’ remains a difficult task. To differentiate between proteins that can and cannot be assigned a general biochemical function, the terms ‘known unknowns’ and ‘unknown unknowns’ have been introduced [4]. Recent analysis of the Shewanella genome introduced a seven-category scheme that ranks newly sequenced open reading frames by the confidence and precision of their functional annotation all the way from ‘exact biochemical function’ down to ‘general biological function’ and ‘certain functional insights’ [31•]. These rankings are based on the degree of sequence similarity between the protein in question and its experimentally characterized homologs, if any, and the availability of supplementary information [31•]. This approach provided descriptors to distinguish various shades of grey in the grey area of functional annotation of new genomes.
A further advancement into the twilight zone came from comparing structurally related proteins in terms of the structure of their loop regions. A new parameter, termed the ‘loop-based Hausdorff measure’ (LHM), was used to quantify the structural (dis)similarities in the loop regions, which are often responsible for substrate (or ligand) specificity [32,33•]. In a majority of protein families, structural similarity of the loops, measured by LHM, correlated with sequence similarity [33•,34•], suggesting that this parameter could serve as an indirect indicator of the degree of functional divergence between homologous proteins. A related measure, ‘the evolutionary plasticity of structure’, quantifies the relation between the changes in protein structure and the sequence variation within a protein family in the course of evolution. This parameter reflects the constraints in the sequence-structure relationships and is remarkably uniform across different folds and families of proteins [34•]. These two metrics could be useful in assessing the quality of protein structure-based functional assignments, discussed in detail by Rigden in this issue [35].
Another important development in genome annotation has been the agreement between the three international nucleotide sequence databases — the DNA Data Bank of Japan, the European Molecular biology Laboratory (EMBL) nucleotide sequence database and GenBank — to allow third-party annotation of the existing sequence records, including those derived from genomes. The databases accept two types of third-party annotation: ‘experimental’ and ‘inferential’ [36•] (see http://www.insdc.org/TPA.html for details). However, the latter group does not include functional annotations that are based on superfamily assignment or a solved three-dimensional structure, which means that for the foreseeable future the most complete annotation of the grey area will be available in curated databases, such as UniProt, COGs (Clusters of Orthologous Groups of proteins), and others. In any case, moving protein characterization on the genome-scale beyond the ‘70% hurdle’ [3] will require a concerted community-wide effort at experimental characterization of ‘hypothetical’ proteins [37–39].
Comparative analysis of metabolic pathways
All (known) living organisms rely on the same core pathways of intermediate metabolism. If similar biochemical reactions were always carried out by related proteins, finding appropriate descriptors for metabolic pathways would be a relatively easy task. In reality, the same key functional roles (‘essential functional niches’ [40]) are often carried out by unrelated proteins [10,41,42], and different organisms have substantially different enzyme sets. These factors limit the usefulness of the Enzyme Commission (EC) numbers, which have been routinely used as identifiers for metabolic reactions. In addition, principles of assigning the EC numbers (http://www.ebi.ac.uk/intenz/rules.html) are not entirely conducive to their use as metabolic pathway markers. For example, two analogous phosphoglycerate mutases that differ, among other traits, in their requirement for bisphosphoglycerate, have the same EC number 1.15.1.1. By contrast, two analogous DNA ligases have two different EC numbers, 6.5.1.1 for the ATP-dependent enzyme and 6.5.1.2 for the NAD-dependent one. Besides, unavoidable delays in manual assignment of the EC numbers lead to the proliferation of incomplete EC numbers and, hence, further confusion [43]. This heightens the need for alternative descriptors of biochemical reactions. Kanehisa and colleagues recently came up with a new classification scheme for enzymatic reactions, which is based on the reaction chemistry rather than just the nature of the substrate and product [44••]. This method offers an entirely new — automated — approach to assigning EC numbers, which are then referred to as the RC (reaction classification) numbers. Given that computationally assigned RC numbers appear to be in general agreement with both the manually assigned EC numbers and protein sequence data, as reflected by the KEGG (Kyoto Encyclopedia of Genes and Genomes) ortholog clusters [44••], these numbers could serve as useful metabolic markers that would simplify and streamline pathway analysis.
Sometimes alternative forms of enzymes are not limited to variations of a single protein and contain several proteins capable of catalysing the same reaction or even variations of a complete pathway [10,42]. The recent discovery of the third pathway of pyrimidine catabolism [45], as well as the very fact that it has remained hidden for so many years [46], show that the degree of functional variance among metabolic pathways is much greater than previously recognized. The redundancy of pathways for formaldehyde oxidation [47] and benzoate catabolism [48,49] in Burkholderia xenovorans LB400 is just one example of metabolic diversity that is relevant to biotechnology. There is a clear need for the appropriate language to describe pathway diversity — and redundancy — among different organisms and even within a single organism. The most promising approach appears to be subdivision of the metabolic network into ‘subsystems’ [42,50•] or ‘phylogenetic network modules’ [51•], on the basis of a combination of sequence-based clustering of enzymes and phylogenetic profiles of enzyme distribution. This approach allows one to identify evolutionarily conserved metabolic building blocks that can be acquired, lost, combined and/or exchanged in the course of biochemical evolution in various lineages.
New approaches to the analysis of metabolic pathways include improved pathway visualization and comparison tools, such as those provided by the KEGG and MetaCyc databases [52,53]. Combining such static ‘wiring diagrams’ with real-time dynamic representations of metabolic fluxes will allow an entirely new level of comprehension of cell metabolism.
Functional profiling of genomes
Several recently sequenced microbial genomes were found to have lineage-specific gene expansions that could be directly linked to the unique biochemistry of the corresponding organisms. Thus, the two genomes of Dehalococcoides species encode numerous copies of reductive dehalogenases, which allow these organisms to use chlorinated hydrocarbons, including the common pollutant perchloroethylene, as terminal electron acceptors [54,55]. By contrast, Desulfitobacterium hafniense, a dechlorinating bacterium from a different phylum, had only two genes for reductive dehalogenases but encoded numerous terminal oxidases, similar to the dimethyl sulfoxide reductase [56•]. Owing to the expansion of these and several other protein families, the genome of D. hafniense revealed a significantly elevated fraction of genes (COGs) related to energy production and conversion (functional category C in the COG database [57]). This approach to analyzing lineage-specific expansions and losses of metabolic enzymes and whole pathways offers a convenient way of highlighting peculiarities of a given organism or clade. This can be reflected in a new genome-scale metric, which shows the distribution of proteins assigned to each functional category in the COG database as compared with distribution in related organisms [58]. By analogy with the phylogenetic profiles, this distribution can be referred to as a COG profile or, more generally, a ‘functional category profile’. Figure 2 shows the results of such an analysis for four organisms with similarly sized genomes. The analysis illustrates the dramatic expansion of proteins involved in DNA replication and recombination (mostly transposases) in Shigella dysenteriae, and reveals the unusually high number of enzymes of lipid biosynthesis and secondary metabolism in Mycobacterium avium and of signal transduction proteins in Dechloromonas aromatica. COG functional category assignments for every sequenced prokaryotic genome are available in the National Center for Biotechnology Information RefSeq database, making such comparisons easy to perform. Furthermore, RefSeq provides tables that show fractions of genes belonging to each functional category per genus, phylum and bacteria in general (see, e.g. http://www.ncbi.nlm.nih.gov/sutils/coxik.cgi?gi=380). Although these are automated assignments that could be prone to certain biases, they provide a convenient birds-eye view of the peculiarities of each given genome. Certainly, such functional profiling could use other functional classifications, such as the one introduced by Riley [59].
Figure 2.
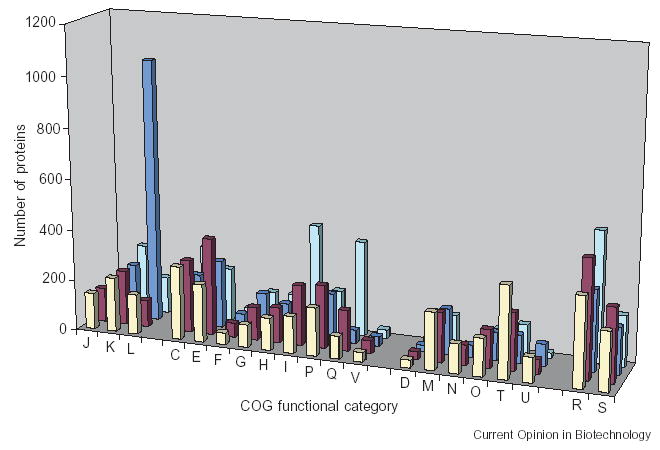
Functional category profiles of four bacterial genomes. The plot shows the number of proteins from Dechloromonas aromatica RCB (front row; cream), Rhodopseudomonas palustris HaA2 (second row; magenta), Shigella dysenteriae Sd197 (third row; blue) and Mycobacterium avium subspecies paratuberculosis K-10 (back row; cyan), assigned to COGs in each functional category. COG functional categories are grouped as follows: 1, information storage and processing (J, translation, ribosomal structure and biogenesis; K, transcription; L, DNA replication, recombination and repair); 2, metabolism (C, energy conversion; E, amino acid transport and metabolism; F, nucleotide transport and metabolism; G, carbohydrate transport and metabolism; H, coenzyme transport and metabolism; I, lipid metabolism; P, inorganic ion transport and metabolism; Q, secondary metabolism; V, defense mechanisms); 3, cellular processes (D, cell division; M, cell envelope; N, motility and secretion; O, post-translational modification and protein turnover; T, signal transduction; U, intracellular trafficking); and 4, poorly characterized (R, general function prediction only; S, unknown function). The data are taken from the Entrez Genome database (http://www.ncbi.nlm.nih.gov/sutils/coxik.cgi?gi=18621 and similar entries).
Signal transduction
All organisms adapt to their environment by perceiving environmental signals and modifying their behavior (and/or metabolism) accordingly. Recent attempts to compare microorganisms in terms of their ability to adjust to environmental changes have led to the introduction of two new metrics [60•]. The first, a signaling index, referred to as ‘bacterial IQ’, reflects the abundance of signal transduction components encoded in a given organism as compared with others of a similar genome size. The second parameter, the degree of ‘extrovertness’, reflects the fraction of transmembrane receptors among all sensory proteins encoded in a given genome. The viability of the second parameter was demonstrated by the finding that cyanobacteria, which have a complex system of intracellular membranes, are the most ‘introverted’ bacteria [60•]. The relevance of the first parameter was affirmed by the finding that bacteria with the highest proportion of environmental sensors (‘highest IQ’) encode the most diverse sets of response regulators [61]. Although these parameters still remain to be statistically validated, they seem to offer new ways to describe the complexity of an organism’s signal transduction machinery.
Conclusions: from reading to comprehension and utilisation of genomic information
Genome-based functional profiling, the reconstruction of metabolic pathways and assessment of an organism’s signaling capabilities are only the first, and simplest, ways to describe an organism on the basis of its genome sequence. Better tools, better approaches and better metrics are needed to fully comprehend the information stored in the genomic data and to eventually utilize this information in biotechnology, pharmacology and genomic medicine. The appearance of new descriptors is an important part of developing the new language of systems biology, which will be used to communicate new ideas and the underlying datasets. However, the examples listed in this paper clearly show that new metrics for genome comparisons cannot simply be pulled out of a hat. Each emerges as a result of careful research and painstaking efforts to understand molecular mechanisms of cell life and to find adequate parameters and tools to describe them. Thus, the current lack of high-quality descriptors, for example for microbial adaptations to extreme conditions, is hardly due to the lack of trying: rather it is caused by a lack of understanding of what is and what is not important for the maintenance of a thermophilic (or psychrophilic) lifestyle. Once underlying principles of adaptation to extreme conditions are better understood, genomic determinants for these traits will become additional metrics for genome description. As noted by Kerényi, “languages are not so much a means of expressing truth that has already been established as a means of discovering truth that was previously unknown” (http://www.wikipedia.org/wiki/Sapir-Whorf_Hypothesis), which will remain the task of systems biology for years to come.
Acknowledgments
We thank Yuri Wolf, Tatiana Tatusova and Natali Kolker for helpful suggestions, and Roger Higdon and Evelyne Kolker for critical reading of the manuscript. Supported by the Intramural Research Program of the NIH, National Library of Medicine (MYG) and the US Department of Energy grant DE-FG08-01ER63218 (EK).
Footnotes
This review comes from a themed issue on Systems biology
Edited by Michael Y Galperin and Michael J Ellison
References
Papers of particular interest, published within the annual period of review, have been highlighted as:
• of special interest
•• of outstanding interest
- 1.van Nimwegen E. Scaling laws in the functional content of genomes. Trends Genet. 2003;19:479–484. doi: 10.1016/S0168-9525(03)00203-8. [DOI] [PubMed] [Google Scholar]
- 2.Fraser CM, Eisen JA, Nelson KE, Paulsen IT, Salzberg SL. The value of complete microbial genome sequencing (you get what you pay for) J Bacteriol. 2002;184:6403–6405. doi: 10.1128/JB.184.23.6403-6405.2002. [DOI] [PMC free article] [PubMed] [Google Scholar]
- 3.Bork P. Powers and pitfalls in sequence analysis: the 70% hurdle. Genome Res. 2000;10:398–400. doi: 10.1101/gr.10.4.398. [DOI] [PubMed] [Google Scholar]
- 4.Galperin MY, Koonin EV. ‘Conserved hypothetical’ proteins: prioritization of targets for experimental study. Nucleic Acids Res. 2004;32:5452–5463. doi: 10.1093/nar/gkh885. [DOI] [PMC free article] [PubMed] [Google Scholar]
- 5.Wolf YI, Rogozin IB, Grishin NV, Tatusov RL, Koonin EV. Genome trees constructed using five different approaches suggest new major bacterial clades. BMC Evol Biol. 2001;1:8. doi: 10.1186/1471-2148-1-8. [DOI] [PMC free article] [PubMed] [Google Scholar]
- 6.Ciccarelli FD, Doerks T, von Mering C, Creevey CJ, Snel B, Bork P. Toward automatic reconstruction of a highly resolved tree of life. Science. 2006;311:1283–1287. doi: 10.1126/science.1123061. [DOI] [PubMed] [Google Scholar]
- •7.Kunin V, Ahren D, Goldovsky L, Janssen P, Ouzounis CA. Measuring genome conservation across taxa: divided strains and united kingdoms. Nucleic Acids Res. 2005;33:616–621. doi: 10.1093/nar/gki181. See the comment to [8•] [DOI] [PMC free article] [PubMed] [Google Scholar]
- •8.Kunin V, Goldovsky L, Darzentas N, Ouzounis CA. The net of life: reconstructing the microbial phylogenetic network. Genome Res. 2005;15:954–959. doi: 10.1101/gr.3666505. These papers [7•,8•] introduce two new parameters, ‘genome conservation’ to measure phylogenetic distances between genomes and ‘HGT vine width’ to measure the degree of horizontal gene transfer between different nodes of the phylogenetic tree. In addition, the study in [8•] introduced a very effective method for visualizing the Tree of Life (see Figure 1). [DOI] [PMC free article] [PubMed] [Google Scholar]
- 9.Green ML, Karp PD. A Bayesian method for identifying missing enzymes in predicted metabolic pathway databases. BMC Bioinformatics. 2004;5:76. doi: 10.1186/1471-2105-5-76. [DOI] [PMC free article] [PubMed] [Google Scholar]
- 10.Osterman A, Overbeek R. Missing genes in metabolic pathways: a comparative genomics approach. Curr Opin Chem Biol. 2003;7:238–251. doi: 10.1016/s1367-5931(03)00027-9. [DOI] [PubMed] [Google Scholar]
- 11.Wolf YI, Brenner SE, Bash PA, Koonin EV. Distribution of protein folds in the three superkingdoms of life. Genome Res. 1999;9:17–26. [PubMed] [Google Scholar]
- 12.Qian J, Luscombe NM, Gerstein M. Protein family and fold occurrence in genomes: power-law behaviour and evolutionary model. J Mol Biol. 2001;313:673–681. doi: 10.1006/jmbi.2001.5079. [DOI] [PubMed] [Google Scholar]
- 13.Beiko RG, Harlow TJ, Ragan MA. Highways of gene sharing in prokaryotes. Proc Natl Acad Sci USA. 2005;102:14332–14337. doi: 10.1073/pnas.0504068102. [DOI] [PMC free article] [PubMed] [Google Scholar]
- 14.Gogarten JP, Doolittle WF, Lawrence JG. Prokaryotic evolution in light of gene transfer. Mol Biol Evol. 2002;19:2226–2238. doi: 10.1093/oxfordjournals.molbev.a004046. [DOI] [PubMed] [Google Scholar]
- 15.Ochman H, Lawrence JG, Groisman EA. Lateral gene transfer and the nature of bacterial innovation. Nature. 2000;405:299–304. doi: 10.1038/35012500. [DOI] [PubMed] [Google Scholar]
- •16.Janssen P, Goldovsky L, Kunin V, Darzentas N, Ouzounis CA. Genome coverage, literally speaking. EMBO Rep. 2005;6:397–399. doi: 10.1038/sj.embor.7400412. Introduces a ‘species knowledge index’ that reflects the amount of literature describing an organism with a completely sequenced genome. The authors argue that only organisms with “sufficient literature coverage, which reflects the active experimental interest of research communities” should be subjects of whole-genome sequencing. Although this is an interesting idea, sequencing of poorly characterized but important pathogens, as well as of representatives of novel phylogenetic groups, offers the best chance of jump-starting their studies. [DOI] [PMC free article] [PubMed] [Google Scholar]
- 17.Sait M, Hugenholtz P, Janssen PH. Cultivation of globally distributed soil bacteria from phylogenetic lineages previously only detected in cultivation-independent surveys. Environ Microbiol. 2002;4:654–666. doi: 10.1046/j.1462-2920.2002.00352.x. [DOI] [PubMed] [Google Scholar]
- •18.Konstantinidis KT, Tiedje JM. Genomic insights that advance the species definition for prokaryotes. Proc Natl Acad Sci USA. 2005;102:2567–2572. doi: 10.1073/pnas.0409727102. See the comment to [19•] [DOI] [PMC free article] [PubMed] [Google Scholar]
- •19.Konstantinidis KT, Tiedje JM. Towards a genome-based taxonomy for prokaryotes. J Bacteriol. 2005;187:6258–6264. doi: 10.1128/JB.187.18.6258-6264.2005. These two papers [18•,19•] introduce two simple measures of genome relatedness, ‘average nucleotide identity’ and ‘average amino acid identity’ and demonstrate their usability for a wide range of phylogenetic distances. [DOI] [PMC free article] [PubMed] [Google Scholar]
- 20.Hess WR. Genome analysis of marine photosynthetic microbes and their global role. Curr Opin Biotechnol. 2004;15:191–198. doi: 10.1016/j.copbio.2004.03.007. [DOI] [PubMed] [Google Scholar]
- 21.Subramanian G, Koonin EV, Aravind L. Comparative genome analysis of the pathogenic spirochetes Borrelia burgdorferi and Treponema pallidum. Infect Immun. 2000;68:1633–1648. doi: 10.1128/iai.68.3.1633-1648.2000. [DOI] [PMC free article] [PubMed] [Google Scholar]
- 22.Wolf YI, Rogozin IB, Kondrashov AS, Koonin EV. Genome alignment, evolution of prokaryotic genome organization, and prediction of gene function using genomic context. Genome Res. 2001;11:356–372. doi: 10.1101/gr.gr-1619r. [DOI] [PubMed] [Google Scholar]
- 23.Celamkoti S, Kundeti S, Purkayastha A, Mazumder R, Buck C, Seto D. GeneOrder3.0: software for comparing the order of genes in pairs of small bacterial genomes. BMC Bioinformatics. 2004;5:52. doi: 10.1186/1471-2105-5-52. [DOI] [PMC free article] [PubMed] [Google Scholar]
- 24.Makarova KS, Aravind L, Galperin MY, Grishin NV, Tatusov RL, Wolf YI, Koonin EV. Comparative genomics of the archaea (Euryarchaeota): evolution of conserved protein families, the stable core, and the variable shell. Genome Res. 1999;9:608–628. [PubMed] [Google Scholar]
- 25.Graham DE, Overbeek R, Olsen GJ, Woese CR. An archaeal genomic signature. Proc Natl Acad Sci USA. 2000;97:3304–3308. doi: 10.1073/pnas.050564797. [DOI] [PMC free article] [PubMed] [Google Scholar]
- 26.Takami H, Takaki Y, Chee GJ, Nishi S, Shimamura S, Suzuki H, Matsui S, Uchiyama I. Thermoadaptation trait revealed by the genome sequence of thermophilic Geobacillus kaustophilus. Nucleic Acids Res. 2004;32:6292–6303. doi: 10.1093/nar/gkh970. [DOI] [PMC free article] [PubMed] [Google Scholar]
- 27.Mulkidjanian AY, Koonin EV, Makarova KS, Mekhedov SL, Sorokin A, Wolf YI, Dufresne A, Partensky F, Burd H, Kaznadzey D, et al. The cyanobacterial genome core and the origin of photosynthesis. Proc Natl Acad Sci USA. 2006;103:13126–13131. doi: 10.1073/pnas.0605709103. [DOI] [PMC free article] [PubMed] [Google Scholar]
- 28.Gene Ontology Consortium. The Gene Ontology (GO) project in 2006. Nucleic Acids Res. 2006;34:D322–D326. doi: 10.1093/nar/gkj021. [DOI] [PMC free article] [PubMed] [Google Scholar]
- 29.Doolittle RF. Of Urfs and Orfs: Primer on How to Analyze Derived Amino Acid Sequences. Mill Valley, CA: University Science Books; 1986. [Google Scholar]
- 30.Rost B. Twilight zone of protein sequence alignments. Protein Eng. 1999;12:85–94. doi: 10.1093/protein/12.2.85. [DOI] [PubMed] [Google Scholar]
- •31.Kolker E, Picone AF, Galperin MY, Romine MF, Higdon R, Makarova KS, Kolker N, Anderson GA, Qiu X, Auberry KJ, et al. Global profiling of Shewanella oneidensis MR-1: Expression of hypothetical genes and improved functional annotations. Proc Natl Acad Sci USA. 2005;102:2099–2104. doi: 10.1073/pnas.0409111102. Discusses the problem of annotation quality for new open reading frames and introduces a ranking of functional annotation for expressed proteins, based on the degree of sequence similarity between the newly sequenced protein and its experimentally characterized homologs and the availability of supplementary information. [DOI] [PMC free article] [PubMed] [Google Scholar]
- 32.Panchenko AR, Madej T. Analysis of protein homology by assessing the (dis)similarity in protein loop regions. Proteins. 2004;57:539–547. doi: 10.1002/prot.20237. [DOI] [PMC free article] [PubMed] [Google Scholar]
- •33.Panchenko AR, Madej T. Structural similarity of loops in protein families: toward the understanding of protein evolution. BMC Evol Biol. 2005;5:10. doi: 10.1186/1471-2148-5-10. This paper, together with the preceding one, offers a fresh approach to protein structure comparisons. Instead of aligning α helices and β strands while mostly ignoring the connecting loop regions, the authors concentrated on comparing the loop regions and introduced a new metric, the loop-based Hausdorff measure (LHM), to quantify their structural (dis)similarities. Their subsequent paper [34•] showed that changes in protein structure within a protein family, measured by this metric, correlate with sequence variation within this protein family. This resulted in a new parameter, the evolutionary plasticity of structure, which turned out to be approximately the same for different families of proteins. [DOI] [PMC free article] [PubMed] [Google Scholar]
- •34.Panchenko AR, Wolf YI, Panchenko LA, Madej T. Evolutionary plasticity of protein families: coupling between sequence and structure variation. Proteins. 2005;61:535–544. doi: 10.1002/prot.20644. See comment to [33•] [DOI] [PMC free article] [PubMed] [Google Scholar]
- 35.Rigden DJ. Understanding the cell in terms of structure and function: insights from structural genomics. Curr Opin Biotechnol. 2006;17 doi: 10.1016/j.copbio.2006.07.004. in press. [DOI] [PubMed] [Google Scholar]
- •36.Cochrane G, Bates K, Apweiler R, Tateno Y, Mashima J, Kosuge T, Mizrachi IK, Schafer S, Fetchko M. Evidence standards in experimental and inferential INSDC third party annotation data. OMICS. 2006;10:105–113. doi: 10.1089/omi.2006.10.105. This paper (as well as online guidelines available at http://www.insdc.org/TPA.html and on the websites of the International Nucleotide Sequence Databases, DDBJ, EMBL and GenBank) specifies the types of third party annotations that can and cannot be submitted to these databases. Adoption of the third party annotation venue provides a way to link the sequence with new experimental data and could have a major impact towards improving the quality of genome annotation. [DOI] [PubMed] [Google Scholar]
- 37.Roberts RJ. Identifying protein function — a call for community action. PLoS Biol. 2004;2:E42. doi: 10.1371/journal.pbio.0020042. [DOI] [PMC free article] [PubMed] [Google Scholar]
- 38.Karp PD. Call for an enzyme genomics initiative. Genome Biol. 2004;5:401. doi: 10.1186/gb-2004-5-8-401. [DOI] [PMC free article] [PubMed] [Google Scholar]
- 39.Kolker E, Makarova KS, Shabalina S, Picone AF, Purvine S, Holzman T, Cherny T, Armbruster D, Munson RS, Jr, Kolesov G, et al. Identification and functional analysis of ‘hypothetical’ genes expressed in Haemophilus influenzae. Nucleic Acids Res. 2004;32:2353–2361. doi: 10.1093/nar/gkh555. [DOI] [PMC free article] [PubMed] [Google Scholar]
- 40.Koonin EV. Comparative genomics, minimal gene-sets and the last universal common ancestor. Nat Rev Microbiol. 2003;1:127–136. doi: 10.1038/nrmicro751. [DOI] [PubMed] [Google Scholar]
- 41.Galperin MY, Walker DR, Koonin EV. Analogous enzymes: independent inventions in enzyme evolution. Genome Res. 1998;8:779–790. doi: 10.1101/gr.8.8.779. [DOI] [PubMed] [Google Scholar]
- 42.Gerdes SY, Edwards R, Kubal M, Fonstein MY, Stevens R, Osterman A. Essential genes on metabolic maps. Curr Opin Biotechnol. 2006;17 doi: 10.1016/j.copbio.2006.08.006. in press. [DOI] [PubMed] [Google Scholar]
- 43.Green ML, Karp PD. Genome annotation errors in pathway databases due to semantic ambiguity in partial EC numbers. Nucleic Acids Res. 2005;33:4035–4039. doi: 10.1093/nar/gki711. [DOI] [PMC free article] [PubMed] [Google Scholar]
- ••44.Kotera M, Okuno Y, Hattori M, Goto S, Kanehisa M. Computational assignment of the EC numbers for genomic-scale analysis of enzymatic reactions. J Am Chem Soc. 2004;126:16487–16498. doi: 10.1021/ja0466457. The authors developed a computerized method that allows an automated classification of enzymatic reactions, based on the nature of reactant pairs, the substrate and the product. Each such pair is structurally aligned to identify the matching region(s) of both molecules, and the region differing in the two, and the reaction center. The patterns of atom types in these three regions are used to assign each reaction its unique RC (reaction classification) number. In ~90% of cases, computationally assigned RC numbers corresponded to the sub-subclass level (first three digits) of the manually assigned EC (Enzyme Commission) numbers. In addition, the RC numbers correlated with protein families represented by the KEGG ortholog clusters. This work is a major breakthrough towards merging enzymology and genome data. [DOI] [PubMed] [Google Scholar]
- 45.Loh KD, Gyaneshwar P, Markenscoff Papadimitriou E, Fong R, Kim KS, Parales R, Zhou Z, Inwood W, Kustu S. A previously undescribed pathway for pyrimidine catabolism. Proc Natl Acad Sci USA. 2006;103:5114–5119. doi: 10.1073/pnas.0600521103. [DOI] [PMC free article] [PubMed] [Google Scholar]
- 46.Osterman A. A hidden metabolic pathway exposed. Proc Natl Acad Sci USA. 2006;103:5637–5638. doi: 10.1073/pnas.0601119103. [DOI] [PMC free article] [PubMed] [Google Scholar]
- 47.Marx CJ, Miller JA, Chistoserdova L, Lidstrom ME. Multiple formaldehyde oxidation/detoxification pathways in Burkholderia fungorum LB400. J Bacteriol. 2004;186:2173–2178. doi: 10.1128/JB.186.7.2173-2178.2004. [DOI] [PMC free article] [PubMed] [Google Scholar]
- 48.Denef VJ, Patrauchan MA, Florizone C, Park J, Tsoi TV, Verstraete W, Tiedje JM, Eltis LD. Growth substrate- and phase-specific expression of biphenyl, benzoate, and C1 metabolic pathways in Burkholderia xenovorans LB400. J Bacteriol. 2005;187:7996–8005. doi: 10.1128/JB.187.23.7996-8005.2005. [DOI] [PMC free article] [PubMed] [Google Scholar]
- 49.Denef VJ, Klappenbach JA, Patrauchan MA, Florizone C, Rodrigues JL, Tsoi TV, Verstraete W, Eltis LD, Tiedje JM. Genetic and genomic insights into the role of benzoate-catabolic pathway redundancy in Burkholderia xenovorans LB400. Appl Environ Microbiol. 2006;72:585–595. doi: 10.1128/AEM.72.1.585-595.2006. [DOI] [PMC free article] [PubMed] [Google Scholar]
- •50.Overbeek R, Begley T, Butler RM, Choudhuri JV, Chuang HY, Cohoon M, de Crecy-Lagard V, Diaz N, Disz T, Edwards R, et al. The subsystems approach to genome annotation and its use in the project to annotate 1000 genomes. Nucleic Acids Res. 2005;33:5691–5702. doi: 10.1093/nar/gki866. A brief description of the community annotation project that relies on experts in various areas of biology to annotate a particular ‘subsystem’ (a group of related ‘functional roles’, such as a pathway, transport system or structural complex) across all available genomes. In practice, subsystems are commonly represented by spreadsheets that compare all functional roles for a subsystem across the list of sequenced genomes. The resulting collections of phyletic patterns offer a convenient way to compare genomes and allow easy identification of missing genes and pathways, cases of non-orthologous gene displacements, and other peculiarities found in various genomes. [DOI] [PMC free article] [PubMed] [Google Scholar]
- •51.Yamada T, Kanehisa M, Goto S. Extraction of phylogenetic network modules from the metabolic network. BMC Bioinformatics. 2006;7:130. doi: 10.1186/1471-2105-7-130. An analysis of metabolic subsystems (see comment to [50••]) using quantitative measures for proximity on the metabolic network and similarity between phylogenetic profiles. [DOI] [PMC free article] [PubMed] [Google Scholar]
- 52.Kanehisa M, Goto S, Hattori M, Aoki-Kinoshita KF, Itoh M, Kawashima S, Katayama T, Araki M, Hirakawa M. From genomics to chemical genomics: new developments in KEGG. Nucleic Acids Res. 2006;34:D354–D357. doi: 10.1093/nar/gkj102. [DOI] [PMC free article] [PubMed] [Google Scholar]
- 53.Caspi R, Foerster H, Fulcher CA, Hopkinson R, Ingraham J, Kaipa P, Krummenacker M, Paley S, Pick J, Rhee SY, et al. MetaCyc: a multiorganism database of metabolic pathways and enzymes. Nucleic Acids Res. 2006;34:D511–D516. doi: 10.1093/nar/gkj128. [DOI] [PMC free article] [PubMed] [Google Scholar]
- 54.Kube M, Beck A, Zinder SH, Kuhl H, Reinhardt R, Adrian L. Genome sequence of the chlorinated compound-respiring bacterium Dehalococcoides species strain CBDB1. Nat Biotechnol. 2005 doi: 10.1038/nbt1131. [DOI] [PubMed] [Google Scholar]
- 55.Seshadri R, Adrian L, Fouts DE, Eisen JA, Phillippy AM, Methe BA, Ward NL, Nelson WC, Deboy RT, Khouri HM, et al. Genome sequence of the PCE-dechlorinating bacterium Dehalococcoides ethenogenes. Science. 2005;307:105–108. doi: 10.1126/science.1102226. [DOI] [PubMed] [Google Scholar]
- •56.Nonaka H, Keresztes G, Shinoda Y, Ikenaga Y, Abe M, Naito K, Inatomi K, Furukawa K, Inui M, Yukawa H. Complete genome sequence of the dehalorespiring bacterium Desulfitobacterium hafniense Y51 and comparison with Dehalococcoides ethenogenes 195. J Bacteriol. 2006;188:2262–2274. doi: 10.1128/JB.188.6.2262-2274.2006. An example of using COG functional categories to identify and and analyze lineage-specific gene expansions responsible for halorespiration in two different groups of bacteria. [DOI] [PMC free article] [PubMed] [Google Scholar]
- 57.Tatusov RL, Galperin MY, Natale DA, Koonin EV. The COG database: a tool for genome-scale analysis of protein functions and evolution. Nucleic Acids Res. 2000;28:33–36. doi: 10.1093/nar/28.1.33. [DOI] [PMC free article] [PubMed] [Google Scholar]
- 58.Larimer FW, Chain P, Hauser L, Lamerdin J, Malfatti S, Do L, Land ML, Pelletier DA, Beatty JT, Lang AS, et al. Complete genome sequence of the metabolically versatile photosynthetic bacterium Rhodopseudomonas palustris. Nat Biotechnol. 2004;22:55–61. doi: 10.1038/nbt923. [DOI] [PubMed] [Google Scholar]
- 59.Riley M. Systems for categorizing functions of gene products. Curr Opin Struct Biol. 1998;8:388–392. doi: 10.1016/s0959-440x(98)80074-2. [DOI] [PubMed] [Google Scholar]
- •60.Galperin MY. A census of membrane-bound and intracellular signal transduction proteins in bacteria: bacterial IQ, extroverts and introverts. BMC Microbiol. 2005;5:35. doi: 10.1186/1471-2180-5-35. Introduction of two new metrics to describe the relative abundance of proteins involved in signal transduction in a given genome compared with others of the same size (‘bacterial IQ’) and the fraction of environmental sensors among all signaling proteins (‘extrovertness’). [DOI] [PMC free article] [PubMed] [Google Scholar]
- 61.Galperin MY. Structural classification of bacterial response regulators: diversity of output domains and domain combinations. J Bacteriol. 2006;188:4169–4182. doi: 10.1128/JB.01887-05. [DOI] [PMC free article] [PubMed] [Google Scholar]