

Summary
Intensity-tuned neurons, characterized by their nonmonotonic response-level function, may play important roles in the encoding of sound intensity-related information. The synaptic mechanisms underlying intensity-tuning remain yet unclear. Here, in vivo whole-cell recordings in rat auditory cortex revealed that intensity-tuned neurons, mostly clustered in a posterior zone, receive imbalanced tone-evoked excitatory and inhibitory synaptic inputs. Excitatory inputs exhibit nonmonotonic intensity-tuning, whereas with tone intensity increments, the temporally-delayed inhibitory inputs increase monotonically in strength. In addition, this delay reduces with the increase of intensity, resulting in an enhanced suppression of excitation at high intensities and a significant sharpening of intensity-tuning. In contrast, non-intensity-tuned neurons exhibit covaried excitatory and inhibitory inputs and the relative time interval between them is stable with intensity increments, resulting in monotonic response-level function. Thus, cortical intensity-tuning is primarily determined by excitatory inputs, and shaped by cortical inhibition through a dynamic control of excitatory and inhibitory timing.
Introduction
Intensity-tuned neurons are characterized by their nonmonotonic responses to tone intensities (Greenwood and Murayama 1965). Such neurons (also named nonmonotonic neurons) have been observed along the central auditory pathway, including the cochlear nucleus (Greenwood and Maruyama, 1965; Young and Brownell, 1976), inferior colliculus (Aitkin 1991; Kuwabara and Suga, 1993), medial geniculate body (Aitkin and Webster, 1972; Rouiller et al.,1983) and auditory cortex (Davies et al., 1956; Evans and Whitfield, 1964; Brugge et al., 1969; Schreiner et al., 1992; Phillips et al., 1995). The response properties of cortical intensity-tuned neurons (Phillips et al.,1995; Heil and Irvine, 1998) and their susceptibility to specific changes after training animals with sound magnitude discrimination task (Polley et al.,2004 and 2006) suggest that these neurons may play important roles in the encoding of sound loudness and envelop transients. Because auditory nerve fibers, the inputs to the central auditory system, have monotonically increasing response-versus-intensity functions (Kiang et al., 1965), the generation of intensity tuning in the central auditory system must rely on neural inhibition to reduce activity preferentially at high intensities. Studies using extracellular recordings with two-tone masking paradigms (Suga and Manabe, 1982; Calford and Semple, 1995; Sutter and Loftus, 2003), with GABA receptor blockade (Faingold et al., 1991; Pollak and Park, 1993; Wang et al., 2002; Sivaramakrishnan et al., 2004), as well as using intracellular recordings (Ojima and Murakami, 2002) suggest that intensity tuning may be produced by the spatial and/or temporal interaction of the inhibition and excitation. However, without direct examination of sound-activated synaptic inputs in individual intensity-tuned neurons, the synaptic mechanisms or neuronal biophysical properties (Durstewitz and Sejnowski, 2000) that may underlie the nonmonotonic response-intensity function or the conversion from monotonic to nonmonotonic function remain elusive.
Recently, several studies on synaptic inputs underlying tone-evoked responses indicate that the frequency tuning and the frequency-intensity tonal receptive fields (TRFs) of cortical neurons are shaped by balanced excitatory and inhibitory synaptic inputs (Zhang et al., 2003; Wehr and Zador, 2003; Tan et al., 2004). This is evidenced by the covariation of the amplitudes of excitatory and inhibitory synaptic conductances evoked by the same tone stimulus (Zhang et al. 2003, Tan et al., 2004) and their relatively stable temporal interval between them (Wehr and Zador 2003). However, those data were mostly acquired from the primary auditory cortex (A1) of rats where the majority of neurons do not exhibit intensity-tuning or exhibit weak tuning (Phillips and Kelly, 1989; Zhang et al., 2001; Doron et al., 2002; Polley et al., 2004; Polley et al., 2006). In the present study, using in vivo whole-cell voltage-clamp recording technique, we examined the excitatory and inhibitory synaptic TRFs in two distinct classes of cortical neurons, intensity-tuned and non-intensity-tuned. We quantified the amplitude and temporal relationship between the excitatory and inhibitory inputs evoked by tone stimuli of various intensities at characteristic frequencies (CF) of the cells. Our data indicate that cortical intensity tuning is determined by the interplay between tone-evoked imbalanced excitatory and inhibitory synaptic inputs. In intensity-tuned neurons, excitatory inputs already exhibit intensity-tuning, whereas the inhibitory inputs increase monotonically and quickly saturate with intensity increments. In addition, the temporal delay of inhibitory inputs relative to excitatory inputs is reduced with the increase of intensity, resulting in an enhanced suppression of excitation at high tone intensities and a significant sharpening of intensity-tuning. These findings also imply that by controlling the relative timing of excitation and inhibition, synaptic circuits can achieve the de novo construction of representational properties.
Results
Distribution of nonmonotonic neurons in the rat auditory cortex
To effectively investigate nonmonotonic neurons, we first determined the spatial distribution of such neurons in the adult rat auditory cortex by high-density mappings with multiunit extracellular recordings (100-180 sampling sites for each map, see Experimental Procedures). The frequency-intensity tonal receptive field for spike responses (spike TRF) was reconstructed for each recorded sampling site. The change of tone-evoked spike response in the function of tone intensity was examined at the characteristic frequency (CF), which is the frequency the neuron is most sensitive to. As shown in an example auditory cortical map (Figure 1A), three major fields can be identified according to the tonotopic organization of frequency representations: the primary auditory cortex (A1) which exhibits a clear tonotopic gradient along the anterior-posterior axis, a small anterior auditory field (AAF) which exhibits a reversed tonotopic gradient compared to A1, and a ventral auditory field (VAF) which has an apparent dorsal-ventral CF gradient, consistent with previous reports (Bao et al., 2003; Kalatsky et al., 2005). In these regions, majority of sampling sites exhibited increased spike responses at high intensity levels (Figure 1B, left). A typical monotonic function is shown after averaging spike response-level functions at CFs for fourteen similar sites (Figure 1B, right). Interestingly, sampling sites in a small posterior zone (named nonmontonic auditory zone: “NM”) located between A1 and VAF consistently exhibited nonmonotonic response-level functions, i.e. markedly reduced responses at high intensity levels (Figure 1C). In addition, the bandwidths of spike TRFs at 30 dB above threshold (BW30) at those nonmonotonic sites are significantly narrower than the monotonic sites (Figure 1D). In all of nine high-density mapping experiments, we observed a similar organization of frequency representation and the existence of a NM zone. Between sampling sites of the NM zone and those of nearby A1 area which have similar CFs, no significant difference was observed in either the response onset latency (NM,15.99 ± 0.32 ms (SEM); A1, 15.72 ± 0.29 ms (SEM); p>0.5, ANOVA test), or the threshold of spike TRFs (p > 0.5, ANOVA test).
Figure 1.
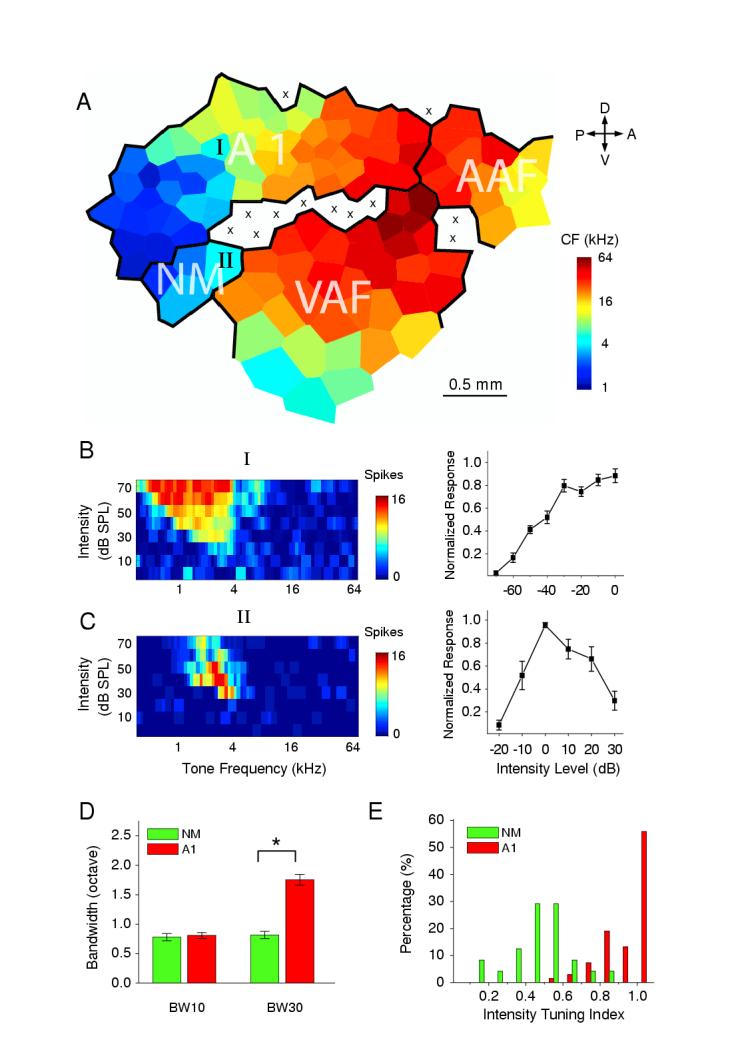
Multiunit intensity-tuning in the rat auditory cortex.
(A) An example map of frequency representation in the adult auditory cortex. The color indicates the characteristic frequency (CF) for the sampling site located in the center of the polygon. Polygons (Voronoi tessellations) are generated so that every point on the cortical surface was assumed to have the characteristics of its closest neighbors. A1, the primary auditory cortex; AAF, anterior auditory field; VAF, ventral auditory field; NM, non-monotonic zone. A, anterior; D, dorsal; P, posterior; V, ventral. “x” indicates a sampling sites which exhibited an intensity threshold of higher than 60 dB or no clear frequency tuning.
(B and C) left, tonal receptive fields of spike responses (spike TRFs) for a non-intensity-tuned site “I” and an intensity-tuned site “II”, as labeled in the map in (A). Color represents the number of spikes evoked by a tone stimulus; right, normalized spike responses as a function of intensity level for tone stimuli at CF. Intensity level “0” is set as where the highest spike rate was evoked. Data were from fourteen randomly-chosen non-intensity-tuned sampling sites in A1 near NM and nine intensity-tuned sites recorded within NM zone, respectively. Error bar = SEM.
(D) Measurement of bandwidths at 10 dB (BW10) and 30 dB (BW30) above intensity threshold for A1 neurons and NM neurons. Bar = SEM. “*” indicates significant difference, p < 0.03, ANOVA test.
(E) Distribution of intensity tuning indices of sampling sites in A1 (red, n=65) and NM (green, n=24) areas.
We used an intensity tuning index to quantify the level of intensity tuning at CF. The index is defined as the ratio between the spike counts at the preferred intensity (with the highest level of response) and at 30 dB above the preferred intensity (or the highest intensity tested). Sampling sites with an index < 0.6 were considered to be strongly intensity-tuned. In A1, around 5% of sampling sites exhibited strong intensity tuning, while in the NM zone, about 80% of sampling sites were strongly intensity-tuned (Figure 1E). Our data are consistent with those from previous extracellular recordings (Phillips and Kelly, 1989; Doron et al., 2002; Bao et al., 2003; Polley et al., 2004 and 2006), which already suggest that nonmonotonic neurons are more abundant in the posterior part of the rat auditory cortex.
Excitatory and inhibitory synaptic receptive fields
To examine the synaptic mechanisms underlying intensity tuning of cortical neurons, we applied in vivo whole-cell voltage-clamp recordings (see Experimental Procedures) to neurons in A1 and the NM zone. By voltage-clamping the cell’s membrane potential at -70 mV and 0 mV, the reversal potentials for GABAA receptor-mediated Cl- currents and glutamate receptor-mediated excitatory currents respectively, we obtained TRFs for both excitatory and inhibitory inputs in the recorded cell. Synaptic TRFs for an example cell in the NM zone were shown in Figures 2A and 2B, and for a cell in A1 were shown in Figures 2C and 2D. Linear current-voltage relationship (I-V curve) was observed for the recorded synaptic currents evoked by CF tones at 70 dB SPL (Figure 2E). The derived reversal potential for the early component of these currents (mainly excitatory) was 0 ± 4mV (SD), close to the known reversal potential for glutamatergic currents. These data suggest that under our voltage-clamp recording conditions, those synaptic inputs that contributed to the recorded tone-evoked currents were detected with a reasonable accuracy (see Experimental Procedures). The excitatory and inhibitory synaptic TRFs obtained from voltage-clamp experiments provide a basis for determining the synaptic mechanisms underlying the intensity-tuning properties of cortical neurons.
Figure 2.

Synaptic TRFs of intensity-tuned and non-tuned neurons.
(A, B) An example of intensity-tuned cortical neuron recorded from NM zone. TRFs of synaptic currents evoked by pure tone stimuli at various frequencies and intensities, with the neuron clamped at -70 mV (A) and 0 mV (B), respectively. The colormaps on the right indicate magnitudes of individual synaptic inputs.
(C, D) An example of non-intensity-tuned neuron recorded from A1. Data are presented in the same manner as that in (A, B).
(E) Left, Synaptic currents (average of five repeats) of the neuron shown in (A, B) evoked by a tone at CF and 70 dB, recorded at different holding potentials. Arrow head indicates the onset of tone stimuli. Right: I-V curves for synaptic currents averaged within 0-1 ms (red) and 20-22.5ms (black) windows after the response onsets.
(F) Jitters of responses to repeated stimuli (70dB CF tone). Upper panel, small white box on the color line indicates the onset time point of the response of the same color shown on top; small black bar indicates the time point at 50% peak response. Lower panel, average latencies and peak conductance. Bar = SD.
(G) TRF of peak membrane potential responses derived from each pair of synaptic inputs recorded at -70 (A) and 0 mV (B). Color represents the postsynaptic potential change in mV. The resting membrane potential of the cell was -65 mV. Arrow indicates the spike threshold for required membrane potential changes. Shaded region is generated to roughly cover all the stimuli that trigger suprathreshold responses (spike receptive field). Note that the estimated spike TRF of this cell is circumscribed.
(H) TRF of derived peak membrane potential responses for the cell shown in (C, D). The resting membrane potential of this cell was -61 mV. Note that the estimated spike TRF of this intensity-non-tuned neuron has a flat peak.
Intensity tuning is usually defined at CFs of cortical neurons according to their spike responses (Schreiner et al., 1992; Phillips et al., 1995; Heil and Irvine, 1998; Polley et al., 2004). Because synaptic TRF usually exhibits a lower intensity threshold and is broader than the spike TRF of the same cell (Tan et al., 2004), to be consistent with previous studies, the CF of the cell was estimated according to the TRF of membrane potential responses derived from the excitatory and inhibitory synaptic conductances for each tonal stimulus (see Experimental Procedures). Based on the resting membrane potential of the cell and the threshold for spike generation (-45 mV; Tan, et al., 2004), the frequency-intensity responsive area for spike responses was then estimated (Figure 2G and 2H, hatched area). The CF was defined as the frequency at the threshold intensity of the spike TRF. For the example cell recorded from the NM zone (Figure 2G), the intensity threshold was estimated to be 20 dB SPL and the CF to be 2.14 kHz ± 0.1 octaves. At this CF, the membrane potential response changed nonmonotonically with the increase of intensity, with the strongest response evoked at an intensity level close to the intensity threshold (Figure 2G), suggesting that this cell represents a typical intensity-tuned neuron. In contrast, for the example cell recorded from A1 (Figures 2H), the derived membrane potential response at the CF changed monotonically with intensity increments, consistent with multiunit recording results for monotonic sites (Figure 1B). In addition, although both the intensity-tuned and untuned neurons exhibited broad synaptic TRFs, the spike TRF of the intensity-tuned neuron was much smaller (Figures 2G, hatched area) and became circumscribed, consistent with multiunit recording results for many nonmonotonic sites (Figure 1C). The response-intensity functions of calculated membrane potential responses are consistent with those of directly recorded membrane responses, as shown in five recorded neurons in which both voltage-clamp and current-clamp recordings were obtained (Figure 3). Thus, by integrating excitatory and inhibitory synaptic conductances, we were able to determine the monotonic or nonmonotonic response properties of the neurons.
Figure 3.

Intensity tuning for recorded and derived membrane potential responses.
(A) Left, average excitatory (clamped at -70 mV) and inhibitory (clamped at 0 mV) synaptic currents and recorded membrane potential changes (PSP) at CF (1.07 kHz) and 0-70dB intensities for cell 1. Note that due to QX-314 which was included in the intra-pipette solution, spikes of the recorded neurons were blocked. Right, gray maps depict the peak amplitude for the recorded PSPs (Recorded, ‘R’) and the derived PSPs (Derived, ‘D’) for cell 1 and another 4 cells. Monotonic neurons: cell 2, 3; nomonotonic neurons: cell 1, 4, 5. Gray scale bar: white, 0mV; black, maximal value: 18mV, 22mV for cell 1; 15mV, 17mV for cell 2; 17mV, 20mV for cell 3; 15mV, 16mV for cell 4; 26mV, 32mV for cell 5.
(B) Intensity tuning indices for the recorded PSPs and derived PSPs from the same cell. There is no significant difference between these two groups: p > 0.9, paired t-test.
Nonmonotonic excitation and imbalanced inhibition underlying intensity tuning
We next determined the relative contribution of excitatory and inhibitory inputs to intensity tuning of cortical cells by examining the amplitude of CF tone-evoked excitatory and inhibitory synaptic conductances as a function of intensity level, i.e. the amplitude-level function. In both the intensity-tuned and untuned neurons, the excitatory and inhibitory synaptic TRFs exhibited an identical shape (Figures 2A and 2B; 2C and 2D). However, for the intensity-tuned neuron, there was a difference in the amplitude-level function between excitatory and inhibitory conductances. It appeared that the amplitudes of excitatory currents evoked by CF-tones were smaller at high intensity levels (Figure 2A, shaded area), while those of inhibitory currents remained more or less similar (Figure 2B, shaded area). To quantify this phenomenon, after determining the CF, excitatory and inhibitory synaptic conductances evoked by repeated CF-tones at various intensities were averaged for this intensity-tuned neuron. The same tone stimulus evoked relatively consistent synaptic responses with small variations in amplitude (SD < 5% mean amplitude) and small jitters in response latency (SD < 0.3 ms; Figure 2F). As shown in Figure 4A, the averaged amplitude of the excitatory conductance changed nonmonotonically, with the peak amplitude evoked at the threshold intensity (20 dB SPL). The amplitude of the inhibitory conductance instead increased monotonically with the increase of intensity. Thus, the excitatory and inhibitory inputs were imbalanced in this intensity-tuned neuron, similar as a recent observation reported online (Tan, et al., 2006). In contrast, for the example non-intensity-tuned neuron (Figure 4B), excitatory and inhibitory inputs exhibited similar monotonic tuning curves, consistent with the previous findings of balanced excitatory and inhibitory inputs that underlie the tone-evoked responses of A1 neurons (Zhang et al., 2003; Wehr and Zador, 2003; Tan et al., 2004). These data suggest that the intensity tuning of the cortical neuron is primarily inherited from the nonmonotonic excitatory inputs.
Figure 4.

Intensity tuning of synaptic conductances evoked by CF tones.
(A) Left, traces of excitatory (“E”) and inhibitory (“I”) synaptic conductances responding to different tone intensities at CF for the intensity-tuned neuron shown in Figure 2A, 2B and 2G. Traces are average from five repetitions. Right, average peak excitatory and inhibitory conductances as a function of tone intensity. Bar = SEM.
(C) Derived membrane potential changes from (A) as a function of tone intensity, with considering excitatory inputs only (filled triangle), with integrating excitatory and inhibitory inputs (filled square), or with integrating inhibitory inputs and modified excitatory inputs (open circle). The excitatory inputs were modified as such that amplitudes of all responses to tones above 20 dB were scaled to that at 20 dB, which is the peak. The error bars were calculated from PSPs derived with randomly paired excitatory input and inhibitory input at the same intensity.
(E) Left column, 50% peak delay (filled square) and onset delay (open circle) of inhibitory conductances relative to the associated excitatory conductances, plotted as a function of tone intensity. The error bars in Figure 4E and 4F were the summation of the variations (SD) in excitatory and inhibitory inputs. 50% peak delays were extracted from waveforms at half maximal amplitude (inhibition minus excitation). Right column, pairs of excitatory (black) and inhibitory (gray) synaptic conductances from (A) plotted at a higher temporal resolution. (B, D, F) Same presentation as in (A, C, E), but for the non-intensity-tuned neuron shown in Figure 2C, 2D and 2H.
Inhibitory contribution to nonmonotonic intensity-tuning
To determine whether the monotonic inhibitory inputs contribute to intensity tuning, we compared the intensity tuning curves of membrane potential responses derived by considering excitatory conductances only and by integrating excitatory and inhibitory conductances. As shown in Figure 4C, for the same intensity-tuned neuron, excitatory conductances alone can not fully account for the intensity-tuning curve, because the amplitude of membrane potential changes (PSPs) derived from excitatory conductances alone was reduced from the peak by only about 25% at the highest intensity (Figure 4C, filled triangles), and even the weakest excitatory input (at 70 dB SPL) was capable of triggering spikes. Integrating the inhibitory conductances (averaged value) not only reduced the amplitude of membrane potential responses in general but also significantly enhanced the intensity tuning, as indicated by a steeper reduction in the membrane potential responses with intensity increments (Figure 4C, filled squares). At the highest intensity, the PSP was reduced by 75% from the peak, leaving only a narrow range of intensities (20-30 dB SPL) at which spikes can be generated. In comparison, for the non-intensity-tuned neuron, the inhibitory conductances only scaled down the membrane potential responses without changing the shape of the tuning curve (Figure 4B and 4D). These results indicate that cortical inhibition is actively involved in shaping the intensity tuning of cortical neurons.
Temporal shaping of nonmonotonic intensity-tuning by synaptic inhibition
Cortical inhibitory inputs can shape spike responses through their temporal interaction with excitatory inputs (Zhang et al., 2003; Wehr and Zador, 2003; Zhu et al., 2004). For example, cortical synaptic inhibition enhances the direction selectivity of cortical responses to frequency-modulated sound sweeps through a larger suppression of synaptic excitation under stimuli of non-preferred direction than of preferred direction (Zhang et al., 2003). This is achieved by a larger temporal overlap between excitatory and inhibitory inputs evoked by non-preferred stimuli, due to an asymmetric integration of inputs sequentially activated by sound sweeps (Zhang et al., 2003). Here we examined the level of temporal overlap between CF-tone evoked excitatory and inhibitory conductances at different intensities. The average excitatory and inhibitory conductances evoked by the same tone stimulus were plotted together (Figure 4E, right). Consistent with the previous results (Zhang et al., 2003; Wehr and Zador, 2003; Tan et al., 2004), inhibitory inputs followed the excitatory inputs with a brief temporal delay. To quantify the relative delay of the inhibitory inputs, a delay index was used, which was defined as the interval between the time points at which 50% peak amplitude was reached in the rising phase of the average excitatory and inhibitory conductance traces (inhibition minus excitation; Wehr and Zador, 2003). Interestingly, for the example intensity-tuned neuron, the delay index reduced with the increase of intensity (Figure 4E, left, filled squares), whereas for the example non-intensity-tuned neuron, it remained more or less the same across different intensity levels (Figure 4F). We also measured the difference in the onset latencies of excitatory and inhibitory inputs, which were defined by the time points at which the amplitude of evoked conductance became larger than three times of the standard deviation of the baseline fluctuation. The result was consistent with the measurement of delay indices (Figure 4E and 4F, open circles). The reduced relative delay of inhibition in the intensity-tuned neuron as intensity goes higher leads to an increased temporal overlap between excitatory and inhibitory inputs, and thus a larger suppression of tone-evoked excitation at high intensities. Surprisingly, such nonmonotonic change of inhibitory delay can be sufficient for the generation of intensity tuning. This is demonstrated by the nonmonotonic tuning of membrane potential responses achieved even after removing the nonmonotonicity of the excitatory inputs by keeping the amplitude of all the excitatory inputs at the peak (at 20 dB) (Figure 4C, open circles).
Synaptic mechanisms for cortical intensity tuning
A total of thirteen intensity-tuned neurons were recorded from the NM zone. In ten of them, complete excitatory and inhibitory synaptic TRFs were obtained (Figure 5A). Data from these neurons were summarized. Here, the intensity-tuning index was defined as the ratio between the response amplitudes (either synaptic conductances or membrane potential changes) at the preferred intensity and at the highest intensity tested. All of these neurons have an intensity-tuning index <0.6 for the derived membrane potential responses (PSPs), and are tuned to intensities close to their intensity thresholds (Figure 5A and 5B). In all of them, excitatory inputs are clearly tuned, as indicated by their intensity-tuning indices (<0.8; Figure 5A), and their nonmonotonically changing amplitudes with intensity increments (Figure 5B). In contrast, inhibitory inputs are not tuned to intensity and their monotonically changing amplitudes quickly saturate (Figure 5A and 5B). Consistent among all the intensity-tuned neurons, cortical inhibition plays an important role in sharpening the intensity tuning, as indicated by the significant difference between the tuning curves obtained with excitatory inputs alone and with both inputs taken into account (Figure 5A and 5C). This effect can be largely attributed to the significantly reduced temporal delay of inhibitory inputs relative to the excitatory inputs at high intensities (Figure 5D). As a comparison, for nine non-intensity-tuned neurons recorded from A1, excitatory and inhibitory inputs exhibit similar monotonic changes in the amplitude (Figures 5E and 5F). The intensity-tuning indices for both the synaptic conductances and derived PSPs are larger than 0.9. The inhibitory delay does not exhibit an intensity-dependent change (Figure 5H). The end result is that synaptic inhibition in non-intensity-tuned neurons only scales down the membrane potential responses, without changing the shape of intensity-tuning curves (Figure 5G). Taken together, although the extent to which synaptic excitation is thalamic or cortical in origin cannot be inferred from our data, we conclude that intensity tuning of cortical neurons is primarily inherited from their excitatory inputs relayed from intensity-tuned neurons, and is further enhanced by cortical inhibition.
Figure 5.

Summary for intensity-tuned (nonmonotonic) and untuned neurons.
(A) A group of intensity-tuned neurons. Color maps depict average peak excitatory and inhibitory conductances (from 3-5 repetitions), and membrane potential changes at CFs and 0-70 dB intensities for each of 10 recorded NM neurons. Scale bar: dark blue, 0; dark red, maximal value: from cell 1 to cell 10, 4 nS, 3 nS, 5nS, 3 nS, 4nS, 5nS, 4nS, 7nS, 6nS, 2nS for excitatory conductance; 5nS, 2nS, 6nS, 2nS, 3nS, 7nS, 4nS, 5nS, 6nS, 2nS for inhibitory conductance; 16mV, 15mV, 16mV, 21mV, 33mV, 18mV, 28mV, 17mV, 14mV, 23mV for PSP. Right, scatter plot of intensity tuning indices for excitatory conductance, inhibitory conductance and PSP of each recorded neuron.
(B) Normalized evoked synaptic conductances of intensity-tuned neurons recorded in NM zone, as a function of relative intensity of CF-tones. Black triangle, excitatory; red square, inhibitory.
(C) Normalized membrane potential changes, as a function of relative intensity. Red square, with consideration of inhibition; black triangle, without consideration of inhibition. “*”, p < 0.03, paired t-test.
(D) Relative delay of inhibition, as a function of relative intensity. Data from the same cell are represented by the same color and symbol. Black squares are average results. Bar = SEM.
(E-H) Same as (A-D) respectively, but for the group of non-intensity-tuned neurons (n = 9) recorded in A1. Scale bar for the color maps in (E): dark blue, 0; dark red, maximal value: 2nS, 5nS, 2nS, 4nS, 4nS, 3nS, 4nS, 4nS, 2nS for excitatory conductance; 2nS, 3nS, 2nS, 2nS, 3nS, 3nS, 5nS, 5nS, 4nS for inhibitory conductance; 22mV, 31mV, 18V, 26mV, 21mV, 19mV, 24mV, 28mV, 16mV for PSP.
Discussion
Nonmonotonic neurons in the auditory cortex
The distribution of nonmonotonic neurons has been extensively studied in the cat auditory cortex with extracellular recording methods. Nonmonotonic neurons have been observed throughout cat A1: besides mildly tuned units, about 25% of sampling units exhibit strong intensity tuning with the firing rate reduced by >50% at high intensities from that at the preferred intensity (Heil et al. 1994; Sutter and Schreiner, 1995). In addition, in the posterior auditory field (PAF or Field P), roughly 80% of the neurons exhibit intensity tuning, and about 40% of them show circumscribed spike TRFs (Heil and Irvine, 1998; Kitzes and Hollrigel, 1996; Phillips and Orman, 1984). Despite the difference in location, experimental data suggested that common neural mechanisms may underlie the nonmonotonic response-level function of neurons in both A1 and PAF (Sutter and Loftus, 2003; Ojima and Murakami, 2002). In the present study of rat auditory cortex, both the location and the response properties of neurons of the NM zone (more than 80% of neurons exhibiting nonmonotonicity) are very similar to those of Field P in the cat auditory cortex (Read et al., 2002). However, in A1 only about 5% of neurons are significantly intensity-tuned, with intensity tuning indices < 0.6 (Figure 1E). Because of the sparseness of nonmonotonic cells in rat A1, only one such cell was recorded in our experiment (Figure 6A and 6B). In this cell, the tuning curves for excitatory and inhibitory inputs are similar to those in NM neurons, suggesting that the synaptic mechanisms revealed in this study may represent common mechanisms for nonmonotonic response-level functions. As discussed below, these mechanisms can also account for neural models proposed for nonmonotonic cells in cat auditory cortex.
Figure 6.
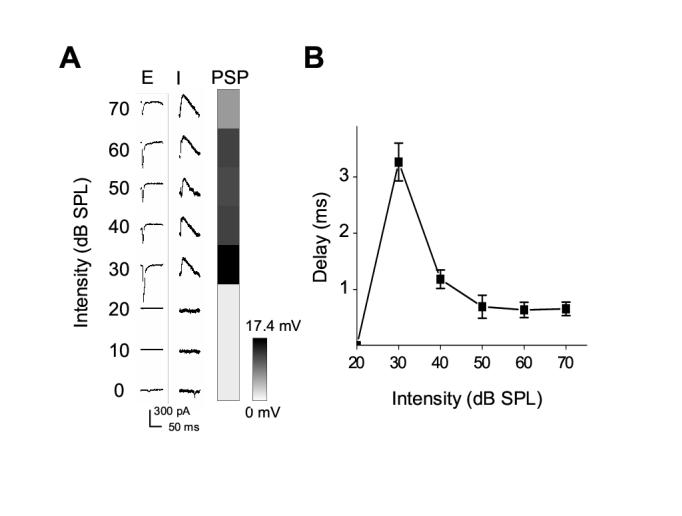
An A1 nonmonotonic cell.
(A) A cell recorded in A1 exhibited similar characteristics of intensity tuning as neurons in NM zone. Average excitatory (with cell clamped at -70 mV) and inhibitory (clamped at 0 mV) synaptic responses, and peak amplitudes of derived membrane potential changes at CF (2.14 kHz) and 0-70dB intensities are shown. The amplitudes of excitatory inputs as well as the membrane potential responses exhibit nonmonotonic tuning, while those of inhibitory inputs change monotonically with intensity increments.
(B) The relative onset delays of inhibitory inputs at various intensities for the same cell in (A). Bar = SD. Note that this cell is not included for summary in Figure 5.
Previous studies indicate that major forms of social vocalization in rats are ultrasonic (16-64 kHz), also termed as 22 kHz calls (Sales and Pye, 1974; Nyby and Whitney, 1978; Kaltwasser 1990; Brudzynski, et al., 1993 and 2002; Hashimoto, et al., 2004). This is consistent with the relatively broad cortical representation of high frequencies (Figure 1A). Interestingly, it appears that intensities of low-frequency sounds are more broadly represented since neurons in the NM zone normally have CFs of lower than 8 kHz (Figure 1, and observations not shown). While intensities of high frequency sounds could be represented by sparsely distributed nonmonotonic cells in A1 (Figure 1E; Zhang, et al., 2001; Bao, et al., 2003;Polley, et al., 2004 and 2006), the relationship between the distribution of nonmonotonic cortical cells and the ability of rats to discriminate intensities of sounds at various frequencies remains to be investigated.
Nonmonotonic excitation primarily determines intensity tuning
Previously lateral inhibition has been proposed to be responsible for producing intensity tuning at higher levels of the auditory system (Shamma, 1985; Suga and Manabe, 1982; Phillips et al., 1995; Calford and Semple, 1995; Sutter and Loftus, 2003). This model has been supported by extracellular recording experiments using forward-masking or simultaneous two-tone masking paradigms (Suga and Manabe, 1982; Calford and Semple, 1995; Sutter and Loftus, 2003). These studies suggested that the intensity tunings of excitatory and suppressive domains were negatively correlated, and that inhibitory sidebands could be involved in intensity tuning. However, due to the nature of masking protocol, lateral suppressive domains may reflect complex temporal interaction between various synaptic inputs evoked by the testing sounds, and may not reflect the frequency-intensity range of inhibitory synaptic inputs per se. By deriving excitatory and inhibitory synaptic conductances, we demonstrated that in nonmonotonic neurons inhibitory inputs always follow excitatory inputs evoked by the same tone stimulus, indicating that a pure inhibition domain in the TRF is not necessary for generating intensity tuning. Nevertheless, the nonmonotonic tuning of excitatory inputs and the monotonic tuning of inhibitory inputs agree with the negatively correlated excitation and inhibition suggested in previous studies. Since both intensity-tuned and untuned cortical neurons have monotonic inhibition, the intensity tuning is thus primarily determined by nonmonotonic excitatory inputs.
Temporal shaping of intensity tuning by inhibitory inputs
The proposed lateral inhibition underlying the intensity tuning may reflect in part differential temporal interaction between excitatory and inhibitory synaptic inputs at various intensities. The temporal shaping effect of inhibitory inputs has recently been suggested in an intracellular study, which examined tone-evoked membrane depolarization and hyperpolarization, and showed that the onset latency of hyperpolarization became shorter as sound intensity increased, resulting in a shortening of the duration of the preceding depolarization (Ojima and Murakami, 2002). Because the membrane potential response is determined by the temporal integration of both excitatory and inhibitory inputs, the property of each input can not be directly inferred, e.g. the onset of hyperpolarization cannot be simply considered as the onset of inhibitory inputs. By dissecting tone-evoked pure excitatory and inhibitory synaptic conductances in well defined intensity-tuned neurons, our findings extended the previous observations. Instead of simply scaling down the membrane potential responses (Wehr and Zador, 2003; Tan et al., 2004), the inhibitory inputs have significantly sharpened intensity tuning, an effect that can be largely attributed to a nonmonotonic change in the relative delay of these inputs.
How does nonmonotonically changing inhibitory delay arise? Although the absolute onset latencies of both excitatory and inhibitory inputs decrease with intensity increments in both intensity-tuned and untuned neurons (Heil, 2004; Figures 4A and 4B), the relative delay of inhibitory inputs becomes shorter at high intensities only in intensity-tuned neurons. We speculate that this change of temporal delay can be partially attributed to an intrinsic synaptic mechanism, i.e. the integration time to bring the neuron to firing threshold is determined by the slope and amplitude of the evoked excitatory postsynaptic potential (PSP) according to the integrate-and-fire model. In our recorded neurons, stronger PSPs are accompanied by stronger excitatory conductances with steeper slopes (Figures 4A and 4B), indicating that a monotonic increase in PSPs will result in a monotonic reduction in the integration time for the initial spike, and vice versa. If this holds for earlier stages of the auditory pathway, the nonmonotonic excitatory inputs to the cortical intensity-tuned neurons will inherit a longer integration time at high intensities, and the monotonic inhibitory inputs will inherit a shorter integration time instead, resulting in a shortening of the relative time interval between the two inputs. It is possible that the latter effect alone could be exploited by a neural network to convert a monotonic tuning curve to nonmonotonic. The implication of our results is that by controlling the relative timing of excitation and inhibition, synaptic circuits can achieve a de novo construction of representational properties.
Potential synaptic circuits underlying nonmonotonic neurons
Synaptic circuits underlying nonmonotonic cortical neurons appear to be different from monotonic cells. Synaptic TRFs of A1 monotonic neurons are marked by covaried tone-evoked excitatory and inhibitory synaptic inputs (Zhang et al., 2003; Wehr and Zador, 2003; Tan et al., 2004). This suggests a feed-forward inhibition circuit associated with A1 neurons, in which the presynaptic GABAergic neurons may be innervated by the same set of thalamocortical afferents as the recorded A1 cell, similar as previously proposed for other sensory cortices (Miller et al., 2001). In the present study, as recordings were made in the major thalamo-recipient layers of the auditory cortex, the non-covaried excitatory and inhibitory inputs in the intensity-tuned neurons suggest that the inhibitory inputs are from cortical GABAergic neurons innervated by a group of monotonic neurons in the thalamus, whereas excitatory inputs are likely mainly from thalamic nonmonotonic neurons. The latter is supported by the existence of nonmonotonic neurons in the medial geniculate body (Aitkin and Webster, 1972), and by the evidence that CF tone evoked excitation can be largely attributed to thalamocortical inputs (Cruikshank et al., 2002; Kaur et al., 2004).
Finally, in this study, we followed previous studies (Schreiner et al., 1992; Phillips et al., 1995; Heil and Irvine, 1998; Polley et al., 2004) in characterizing responses to pure tones of various intensities at the CFs of the recorded neurons. Under more complex stimuli e.g. broadband noise, the spike response-intensity function of intensity-tuned neurons will be complicated by the spectrotemporal integration of synaptic inputs activated at different frequencies and time points. Understanding of intensity tuning under these stimuli will require knowledge on more details of synaptic circuits, e.g. the origins and properties of presynaptic neurons for each synaptic input, that underlie cortical neurons’ responses.
Experimental Procedure
Extracellular Recording
All experimental procedures used in this study were approved under the Animal Care and Use Committee at the University of Southern California. Experiments were carried out in a sound-proof booth (Acoustic Systems). Female Sprague-Dawley rats about 3 months old and weighing 250-300g were anaesthetized with ketamine and xylazine (ketamine: 45mg/kg; xylazine: 6.4mg/kg; i.p.). The right auditory cortex was exposed and the right ear canal was plugged. The body temperature was maintained at 37.5°C by a feed-back heating system (Harvard Apparatus, MA). Multiunit spike responses were recorded with parylene-coated tungsten microelectrodes (FHC, ME) at 500-600μm below the pial surface (Zhang et al., 2001; Bao et al., 2003; Polley et al., 2004). Electrode signals were amplified (Plexon Inc, TX), band-pass filtered between 300 and 6,000 Hz and then thresholded in a custom-made software (LabView, National Instrument) to extract the spike times. Pure tones (0.5-64 kHz at 0.1-octave intervals, 25-ms duration, 3ms ramp) at eight 10-dB-spaced sound intensities were delivered through a calibrated free-field speaker facing the left ear. A time window from 10-25 ms from the onset of tone stimulus was used for tone-evoked spike responses. The threshold of the spike TRF was chosen to be the minimum stimulus intensity included in the TRF, and the characteristic frequency (CF) was the tone frequency that evoked a response at threshold. Bandwidth at 10 dB or 30 dB (BW10 or BW30) above threshold was the frequency width (in octaves) of the TRF at that intensity level. Auditory cortical mapping was carried out by sequentially recording from an array of cortical sites with an average grid size of 120 μm for dense mappings and about 200 μm for rough mappings (Kilgard and Merzenich, 1999; Zhang et al., 2001; Bao et al., 2003; Polley et al., 2004; Tan et al., 2004).
In vivo Whole-cell Recording
Whole-cell recordings (Moore and Nelson, 1998; Margrie et al., 2002; Zhang et al., 2003; Wehr and Zador, 2003; Tan et al., 2004) were obtained from neurons located 500-700μm beneath the cortical surface. We prevented cortical pulsation with 4% agarose. For voltage-clamp recording, the patch pipette (4-7 MΩ) contained (in mM): 125 Cs-gluconate, 5 TEA-Cl, 4 MgATP, 0.3 GTP, 10 phosphocreatine, 10 HEPES, 0.5 EGTA, 2 CsCl, pH 7.2. 5mM QX-314 was included to improve the whole-cell clamping of the cell (Nelson et al., 1994). Recordings were made with an Axopatch 200B amplifier (Axon Instruments). The whole cell recording method under our conditions shows a sampling bias towards relatively large pyramidal neurons, consistent with results from other laboratories with similar experimental settings (Moore and Nelson, 1998; Margrie et al., 2002). The whole-cell and pipette capacitances were completely compensated and the initial series resistance (20-50MΩ) was compensated for 50-60% to achieve effective series resistances of 10-25 MΩ. Signals were filtered at 5 kHz and sampled at 10 kHz. Only neurons with resting membrane potentials lower than -55 mV and stable series resistance (less than 10% change from the beginning of the recording) were used for further analysis. The CFs of the synaptic TRFs of recorded neurons matched their positions in the tonotopic map determined by extracellular recordings.
Data Analysis
The excitatory synaptic conductance Ge(t) and inhibitory synaptic conductance Gi(t) at time twere derived (Borg-Graham et al., 1998, Anderson et al., 2000) using I(t, V) = Gr(V-Er)+Ge(t)(V-Ee)+Gi(t)(V-Ei) where V is the clamping voltage, Gr is the resting conductance, Er is the resting potential; Ee and Ei are the reversal potentials for excitatory and inhibitory synaptic currents, respectively; and I(t, V) is the current amplitude under V. Currents into the neuron were assigned a negative value. The resting or leak conductance Gr was derived using Ir(V) = Gr(V -Er) where Er is the resting potential, and Ir(V) is the resting current. Measurement of I(V) at two voltages will solve the value of Ge and Gi in the equation. In this study, a corrected clamping voltage V was used, instead of the clamping voltage applied (Vc). V(t) is given by V(t) = Vc -Rs*I(t), where Rs was the effective series resistance. Synaptic currents were obtained with the cell clamped at the reversal potentials for inhibitory and excitatory currents respectively, for each of the 568 test tone stimuli. For some of the experiments, the reversal potentials of glutamatergic and GABAergic (Cl-) currents were roughly measured at the beginning by examining the reversal of spontaneous glutamatergic and GABAergic currents respectively, as the holding potential was changed. Under experimental condition in this study, the reversal potential was found to be 0-8 mV for glutamatergic inputs, and around -70 mV for GABAergic inputs, consistent with the values of Ee and Ei determined by considering the ionic composition of the pipette solution and the cerebrospinal fluid. In some cases, Ei values of -65 and -75 mV were also tested, and this did not change the conclusion of the study.
Estimated membrane potential response Vest was derived from synaptic conductances using Vest(t)=(GrEr+Ge(t)Ee+Gi(t)Ei)/(Gr+ Ge(t)+ Gi(t)), where Er is the resting membrane potential, which was determined for each recorded neuron under current-clamp recording at the beginning of the experiment. If only the excitatory synaptic conductance was taken into account, Gi(t) was set to zero. The spike threshold was set around -45 mV for auditory cortical neurons, an observation from a previous study (Tan et al., 2004).
In this study, we have assumed linear, isopotential neurons in deriving excitatory and inhibitory synaptic conductances, same as in previous studies (Zhang, et al., 2003; Wehr and Zador, 2003 and 2005; Tan, et al., 2004). However, deviations due to space clamp error and cable attenuation for synaptic inputs at the distal dendrites (Spruston et al., 1993) should be kept in mind, as extensively discussed in several recent studies (Wehr and Zador, 2003; Tan et al., 2004). Nevertheless, the two major observations for intensity-tuned neurons, the nonmonotonic excitatory and monotonic inhibitory inputs as well as the nonmonotonic change of temporal delay between excitation and inhibition, are unlikely to be affected. First, the linearity of synaptic IV curves (Figure 2E) suggested that synaptic conductances were not strongly affected by nonlinearities of cortical neurons. This may be attributed to the use of intracellular cesium, TEA, QX-314 and ketamine anaesthesia, which together block most voltage-dependent currents. The relative accuracy of derived excitatory reversal potential (Figure 2E) also suggests reasonably accurate voltage-clamp for those recorded synaptic inputs, because errors in space clamp will result in apparent deviations from the actual real reversal potential (Shu et al., 2003). In addition, the use of cesium and TEA (blockers of potassium channels) will reduce the membrane permeability and thus decrease the cable attenuation (Spruston, 1993). Second, we make comparisons between responses to CF stimuli in the same recorded cell, and between intensity-tuned and non-tuned neurons. Although space clamp errors or cable attenuation will cause an underestimation of absolute conductances, our conclusions are not dependent on the absolute level of conductances or the ratio between excitation and inhibition. Finally, simulation based on a compartmental neuron model suggests that the relative timing between excitatory and inhibitory inputs at 50% peak is not significantly affected by the cable effects (Wehr and Zador, 2003).
Acknowledgments
We thank Dr. A.P. Sampath for helpful discussion. This work is supported by grants from NIH/NIDCD, Searle Scholar Program, Klingenstein Foundation and National Organization for Hearing Research Foundation.
References
- Anderson JS, Carandini M, Ferster D. Orientation tuning of input conductance, excitation, and inhibition in cat primary visual cortex. J. Neurophysiol. 2000;84:909–926. doi: 10.1152/jn.2000.84.2.909. [DOI] [PubMed] [Google Scholar]
- Aitkin L. Rate-level functions of neurons in the inferior colliculus of cats measured with the use of free-field sound stimuli. J. Neurophysiol. 1991;65:383–392. doi: 10.1152/jn.1991.65.2.383. [DOI] [PubMed] [Google Scholar]
- Aitkin LM, Webster WR. Medial geniculate body of the cat: organization and responses to tonal stimuli of neurons in ventral division. J. Neurophysiol. 1972;35:365–380. doi: 10.1152/jn.1972.35.3.365. [DOI] [PubMed] [Google Scholar]
- Bao S, Chang EF, Davis JD, Gobeske KT, Merzenich MM. Progressive degradation and subsequent refinement of acoustic representations in the adult auditory cortex. J. Neurosci. 2003;23:10765–10775. doi: 10.1523/JNEUROSCI.23-34-10765.2003. [DOI] [PMC free article] [PubMed] [Google Scholar]
- Borg-Graham LJ, Monier C, Fregnac Y. Visual input evokes transient and strong shunting inhibition in visual cortical neurons. Nature. 1998;393:369–373. doi: 10.1038/30735. [DOI] [PubMed] [Google Scholar]
- Brudzynski SM, Bihari F, Ociepa D, Fu XW. Analysis of 22 kHz ultrasonic vocalization in laboratory rats: long and short calls. Physiol. Behav. 1993;54:215–221. doi: 10.1016/0031-9384(93)90102-l. [DOI] [PubMed] [Google Scholar]
- Brudzynski SM, Pniak A. Social contacts and production of 50-kHz short ultrasonic calls in adult rats. J. Comp. Psychol. 2002;116:73–82. doi: 10.1037/0735-7036.116.1.73. [DOI] [PubMed] [Google Scholar]
- Brugge JF, Dubrovsky NA, Aitkin LM, Anderson DJ. Sensitivity of single neurons in auditory cortex of cat to binaural tonal stimulation; effects of varying interaural time and intensity. J. Neurophysiol. 1969;32:1005–1024. doi: 10.1152/jn.1969.32.6.1005. [DOI] [PubMed] [Google Scholar]
- Calford MB, Semple MN. Monaural inhibition in cat auditory cortex. J. Neurophysiol. 1995;73:1876–1891. doi: 10.1152/jn.1995.73.5.1876. [DOI] [PubMed] [Google Scholar]
- Cruikshank SJ, Rose HJ, Metherate R. Auditory thalamocortical synaptic transmission in vitro. J. Neurophysiol. 2002;87:361–384. doi: 10.1152/jn.00549.2001. [DOI] [PubMed] [Google Scholar]
- Davies PW, Erulkar SD, Rose JE. Single unit activity in the auditory cortex of the cat. Bull. Johns Hopkins Hosp. 1956;99:55–86. [PubMed] [Google Scholar]
- Doron NN, Ledoux JE, Semple MN. Redefining the tonotopic core of rat auditory cortex: physiological evidence for a posterior field. J. Comp Neurol. 2002;453:345–360. doi: 10.1002/cne.10412. [DOI] [PubMed] [Google Scholar]
- Durstewitz D, Sejnowski TJ. Flexible functional connectivity in working memory networks with non-monotonic neural response functions; Annual Meeting of Society for Neuroscience; 2000; Program Abstract No. 711.1. [Google Scholar]
- Evans EF, Whitfield IC. Classification of unit responses in the auditory cortex of the unanesthetized and unrestrained cat. J. Physiol. Lond. 1964;171:476–493. doi: 10.1113/jphysiol.1964.sp007391. [DOI] [PMC free article] [PubMed] [Google Scholar]
- Faingold CL, Boersma Anderson CA, Caspary DM. Involvement of GABA in acoustically-evoked inhibition in inferior colliculus neurons. Hear. Res. 1991;52:201–216. doi: 10.1016/0378-5955(91)90200-s. [DOI] [PubMed] [Google Scholar]
- Greenwood DD, Maruyama N. Excitatory and inhibitory response areas of auditory neurons in the cochlear nucleus. J. Neurophysiol. 1965;28:863–892. doi: 10.1152/jn.1965.28.5.863. [DOI] [PubMed] [Google Scholar]
- Hashimoto H, Moritani N, Aoki-Komori S, Tanaka M, Saito TR. Comparison of ultrasonic vocalizations emitted by rodent pups. Exp. Anim. 2004;53:409–416. doi: 10.1538/expanim.53.409. [DOI] [PubMed] [Google Scholar]
- Heil P, Rajan R, Irvine DR. Topographic representation of tone intensity along the isofrequency axis of cat primary auditory cortex. Hear Res. 1994;76:188–202. doi: 10.1016/0378-5955(94)90099-x. [DOI] [PubMed] [Google Scholar]
- Heil P, Irvine DR. The posterior field P of cat auditory cortex: coding of envelope transients. Cereb. Cortex. 1998;8:125–141. doi: 10.1093/cercor/8.2.125. [DOI] [PubMed] [Google Scholar]
- Heil P. First-spike latency of auditory neurons revisited. Curr. Opin. Neurobiol. 2004;14:461–467. doi: 10.1016/j.conb.2004.07.002. [DOI] [PubMed] [Google Scholar]
- Kalatsky VA, Polley DB, Merzenich MM, Schreiner CE, Stryker MP. Fine functional organization of auditory cortex revealed by Fourier optical imaging. Proc. Natl. Acad. Sci. USA. 2005;102:13325–13330. doi: 10.1073/pnas.0505592102. [DOI] [PMC free article] [PubMed] [Google Scholar]
- Kaltwasser MT. Acoustic signaling in the black rat (Rattus rattus) J. Comp. Psychol. 1990;104:227–232. doi: 10.1037/0735-7036.104.3.227. [DOI] [PubMed] [Google Scholar]
- Kaur S, Lazar R, Metherate R. Intracortical pathways determine breadth of subthreshold frequency receptive fields in primary auditory cortex. J. Neurophysiol. 2004;91:2551–2567. doi: 10.1152/jn.01121.2003. [DOI] [PubMed] [Google Scholar]
- Kiang NY, Watanabe T, Thomas EC, Clark LF. Discharge patterns of single fibers in the cat’s auditory nerve. MIT Press; Cambridge, MA: 1965. [Google Scholar]
- Kilgard MP, Merzenich MM. Distributed representation of spectral and temporal information in rat primary auditory cortex. Hear Res. 1999;134:16–28. doi: 10.1016/s0378-5955(99)00061-1. [DOI] [PMC free article] [PubMed] [Google Scholar]
- Kitzes LM, Hollrigel GS. Response properties of units in the posterior auditory field deprived of input from the ipsilateral primary auditory cortex. Hear Res. 1996;100:120–30. doi: 10.1016/0378-5955(96)00103-7. [DOI] [PubMed] [Google Scholar]
- Kuwabara N, Suga N. Delay lines and amplitude selectivity are created in subthalamic auditory nuclei: the brachium of the inferior colliculus of the mustached bat. J. Neurophysiol. 1993;69:1713–1724. doi: 10.1152/jn.1993.69.5.1713. [DOI] [PubMed] [Google Scholar]
- Margrie TW, Brecht M, Sakmann B. In vivo, low-resistance, whole-cell recordings from neurons in the anaesthetized and awake mammalian brain. Pflugers Arch. 2002;444:491–498. doi: 10.1007/s00424-002-0831-z. [DOI] [PubMed] [Google Scholar]
- Miller KD, Pinto DJ, Simons DJ. Processing in layer 4 of the neocortical circuit: new insights from visual and somatosensory cortex. Curr. Opin. Neurobiol. 2001;11:488–497. doi: 10.1016/s0959-4388(00)00239-7. [DOI] [PubMed] [Google Scholar]
- Moore CI, Nelson SB. Spatio-temporal subthreshold receptive fields in the vibrissa representation of rat primary somatosensory cortex. J. Neurophysiol. 1998;80:2882–2892. doi: 10.1152/jn.1998.80.6.2882. [DOI] [PubMed] [Google Scholar]
- Nelson S, Toth L, Sheth B, Sur M. Orientation selectivity of cortical neurons during intracellular blockade of inhibition. Science. 1994;265:774–777. doi: 10.1126/science.8047882. [DOI] [PubMed] [Google Scholar]
- Nyby J, Whitney G. Ultrasonic communication of adult myomorph rodents. Neuroscience and Biobehavioral Reviews. 1978;2:1–14. [Google Scholar]
- Ojima H, Murakami K. Intracellular characterization of suppressive responses in supragranular pyramidal neurons of cat primary auditory cortex in vivo. Cereb. Cortex. 2002;12:1079–1091. doi: 10.1093/cercor/12.10.1079. [DOI] [PubMed] [Google Scholar]
- Phillips DP, Orman SS. Responses of single neurons in posterior field of cat auditory cortex to tonal stimulation. J. Neurophysiol. 1984;51:147–63. doi: 10.1152/jn.1984.51.1.147. [DOI] [PubMed] [Google Scholar]
- Phillips DP, Kelly JB. Coding of tone-pulse amplitude by single neurons in auditory cortex of albino rats (Rattus norvegicus) Hear. Res. 1989;37:269–279. doi: 10.1016/0378-5955(89)90027-0. [DOI] [PubMed] [Google Scholar]
- Phillips DP, Semple MN, Kitzes LM. Factors shaping the tone level sensitivity of single neurons in posterior field of cat auditory cortex. J. Neurophysiol. 1995;73:674–686. doi: 10.1152/jn.1995.73.2.674. [DOI] [PubMed] [Google Scholar]
- Pollak GD, Park TJ. The effects of GABAergic inhibition on monaural response properties of neurons in the mustache bat’s inferior colliculus. Hear Res. 1993;65:99–117. doi: 10.1016/0378-5955(93)90205-f. [DOI] [PubMed] [Google Scholar]
- Polley DB, Heiser MA, Blake DT, Schreiner CE, Merzenich MM. Associative learning shapes the neural code for stimulus magnitude in primary auditory cortex. Proc. Natl. Acad. Sci. USA. 2004;101:16351–16356. doi: 10.1073/pnas.0407586101. [DOI] [PMC free article] [PubMed] [Google Scholar]
- Polley DB, Steinberg EE, Merzenich MM. Perceptual learning directs auditory cortical map reorganization through top-down influences. J. Neurosci. 2006;26:4970–4982. doi: 10.1523/JNEUROSCI.3771-05.2006. [DOI] [PMC free article] [PubMed] [Google Scholar]
- Read HL, Winer JA, Schreiner CE. Functional architecture of auditory cortex. Curr. Opin. Neurobiol. 2002;12:433–440. doi: 10.1016/s0959-4388(02)00342-2. [DOI] [PubMed] [Google Scholar]
- Rouiller E, de Ribaupierre Y, Morel A, de Ribaupierre F. Intensity functions of single unit responses to tone in the medial geniculate body of cat. Hear. Res. 1983;11:235–247. doi: 10.1016/0378-5955(83)90081-3. [DOI] [PubMed] [Google Scholar]
- Sales GD, Pye D. Ultrasonic communication by animals. Chapman and Hall; London: 1974. [Google Scholar]
- Schreiner CE, Mendelson JR, Sutter ML. Functional topography of cat primary auditory cortex: representation of tone intensity. Exp. Brain Res. 1992;92:105–122. doi: 10.1007/BF00230388. [DOI] [PubMed] [Google Scholar]
- Shamma SA. Speech processing in the auditory system. II: Lateral inhibition and the central processing of speech evoked activity in the auditory nerve. J. Acoust. Soc. Am. 1985;78:1622–1632. doi: 10.1121/1.392800. [DOI] [PubMed] [Google Scholar]
- Shu Y, Hasenstaub A, McCormick DA. Turning on and off recurrent balanced cortical activity. Nature. 2003;423:288–293. doi: 10.1038/nature01616. [DOI] [PubMed] [Google Scholar]
- Sivaramakrishnan S, Sterbing-D’Angelo SJ, Filipovic B, D’Angelo WR, Oliver DL, Kuwada S. GABA(A) synapses shape neuronal responses to sound intensity in the inferior colliculus. J. Neurosci. 2004;24:5031–5043. doi: 10.1523/JNEUROSCI.0357-04.2004. [DOI] [PMC free article] [PubMed] [Google Scholar]
- Spruston N, Jaffe DB, Williams SH, Johnston D. Voltage- and space-clamp errors associated with the measurement of electrotonically remote synaptic events. J. Neurophysiol. 1993;70:781–802. doi: 10.1152/jn.1993.70.2.781. [DOI] [PubMed] [Google Scholar]
- Suga N, Manabe T. Neural basis of amplitude-spectrum representation in auditory cortex of the mustached bat. J. Neurophysiol. 1982;47:225–255. doi: 10.1152/jn.1982.47.2.225. [DOI] [PubMed] [Google Scholar]
- Sutter ML, Schreiner CE. Topography of intensity tuning in cat primary auditory cortex: single-neuron versus multiple-neuron recordings. J. Neurophysiol. 1995;73:190–204. doi: 10.1152/jn.1995.73.1.190. [DOI] [PubMed] [Google Scholar]
- Sutter ML, Loftus WC. Excitatory and inhibitory intensity tuning in auditory cortex: evidence for multiple inhibitory mechanisms. J. Neurophysiol. 2003;90:2629–2647. doi: 10.1152/jn.00722.2002. [DOI] [PubMed] [Google Scholar]
- Tan AY, Zhang LI, Merzenich MM, Schreiner CE. Tone-evoked excitatory and inhibitory synaptic conductances of primary auditory cortex neurons. J. Neurophysiol. 2004;92:630–643. doi: 10.1152/jn.01020.2003. [DOI] [PubMed] [Google Scholar]
- Tan AY, Atencio CA, Polley DB, Merzenich MM, Schreiner CE. Unbalanced synaptic inhibition can create intensity-tuned auditory cortex neurons.; 21 Jul 2006; arXiv: q-bio.NC/0607036. [DOI] [PubMed] [Google Scholar]
- Wang J, McFadden SL, Caspary D, Salvi R. Gamma-aminobutyric acid circuits shape response properties of auditory cortex neurons. Brain Res. 2002;944:219–231. doi: 10.1016/s0006-8993(02)02926-8. [DOI] [PubMed] [Google Scholar]
- Wehr M, Zador AM. Balanced inhibition underlies tuning and sharpens spike timing in auditory cortex. Nature. 2003;426:442–446. doi: 10.1038/nature02116. [DOI] [PubMed] [Google Scholar]
- Wehr M, Zador AM. Synaptic mechanisms of forward suppression in rat auditory cortex. Neuron. 2005;47:437–45. doi: 10.1016/j.neuron.2005.06.009. [DOI] [PubMed] [Google Scholar]
- Young ED, Brownnell WE. Response to tones and noise of single cells in dorsal cochlear nucleus of unanesthetized cats. J. Neurophysiol. 1976;39:282–300. doi: 10.1152/jn.1976.39.2.282. [DOI] [PubMed] [Google Scholar]
- Zhang LI, Bao S, Merzenich MM. Persistent and specific influences of early acoustic environments on primary auditory cortex. Nat. Neurosci. 2001;4:1123–1130. doi: 10.1038/nn745. [DOI] [PubMed] [Google Scholar]
- Zhang LI, Tan AY, Schreiner CE, Merzenich MM. Topography and synaptic shaping of direction selectivity in primary auditory cortex. Nature. 2003;424:201–205. doi: 10.1038/nature01796. [DOI] [PubMed] [Google Scholar]
- Zhu Y, Stornetta RL, Zhu JJ. Chandelier cells control excessive cortical excitation: characteristics of whisker-evoked synaptic responses of layer 2/3 nonpyramidal and pyramidal neurons. J. Neurosci. 2004;24:5101–5108. doi: 10.1523/JNEUROSCI.0544-04.2004. [DOI] [PMC free article] [PubMed] [Google Scholar]