

Abstract
Attention deficits are considered a hallmark of the teratogenic effects of alcohol. However, characterization of these deficits remains inconclusive. Children with heavy prenatal alcohol exposure and non-exposed controls were evaluated using a paradigm consisting of three conditions: visual focus, auditory focus, and auditory-visual shift of attention. For all conditions, visual (blue or yellow squares) and auditory (high or low tones) stimuli were randomly presented at a rate of 450–1450msec and inter-target intervals (ITI) of 450–30000msec. For the focus conditions, participants were required to respond manually to visual or auditory targets. For the shift condition, participants were required to alternate responses between visual targets and auditory targets. Thus, each target served as a cue to disengage and shift attention to the alternate modality. For the visual focus condition, alcohol-exposed children responded with lower accuracy and slower reaction time for all ITIs. In contrast, for the auditory focus condition, alcohol-exposed children were less accurate but displayed slower reaction time only on the longest ITI. Finally, for the shift condition, the alcohol-exposed group had slower reaction times but had accuracy levels comparable to controls. These results indicate that children with heavy prenatal alcohol exposure have pervasive deficits in visual focused attention and deficits in maintaining auditory attention over longer periods of time. However, no deficits were noted in the ability to disengage and reengage attention when required to shift attention between visual and auditory stimuli, although reaction times to shift were slower.
Keywords: fetal alcohol syndrome, visual attention, auditory attention, fetal alcohol spectrum disorders
INTRODUCTION
Heavy prenatal exposure to alcohol is associated with a range of negative outcomes, one of which is Fetal Alcohol Syndrome (FAS) (Jones & Smith, 1973; Jones, Smith, Ulleland, & Streissguth, 1973). This diagnosis is based on a triad of characteristics: 1) pre- and/or postnatal growth deficiency, 2) facial dysmorphology, such as thin vermillion border, smooth philtrum, and short palpebral fissures, and 3) central nervous system (CNS) dysfunction (Bertrand et al., 2004; Jones & Smith, 1973; Lemoine, Harousseau, Borteyru, & Menuet, 1968; Stratton, Howe, & Battaglia, 1996). Although all three characteristics are required for diagnosis of FAS, many children exposed to alcohol in the prenatal period do not exhibit all features and thus do not qualify for this diagnosis. Importantly, in spite of the lack of physical markers of alcohol’s teratogenicity, these children have CNS impairments similar to those of children with a diagnosis of FAS (Conry, 1990; Mattson, Goodman, Caine, Delis, & Riley, 1999; Mattson, Riley, Gramling, Delis, & Jones, 1998; Schonfeld, Mattson, Lang, Delis, & Riley, 2001). Because the effects of prenatal alcohol exposure exist on a continuum, (Day & Richardson, 1991; Korkman, Autti-Rämö, Koivulehto, & Granström, 1998), the term Fetal Alcohol Spectrum Disorders (FASD) was recently suggested to encompass various alcohol-related (i.e., physical, behavioral, emotional) disorders (Streissguth & O'Malley, 2000) including FAS.
Prenatal Alcohol Exposure and Attention
Although a clear picture of the neuropsychological deficits in children with FASD is still emerging, these deficits can be devastating and include effects on general intelligence, learning, and visuospatial function (for review, see Mattson & Riley, 1998). One of the hallmark characteristics of children with heavy prenatal alcohol exposure is a deficit in attention. Over 60% of children with FASD manifest deficits in attention (LaDue, Streissguth, & Randels, 1992; Streissguth, Barr, Kogan, & Bookstein, 1996) and many receive psychiatric diagnoses of attention disorders (Fryer, McGee, Matt, Riley, & Mattson, Submitted; Steinhausen & Spohr, 1998). One case-control study (Mick, Biederman, Faraone, Sayer, & Kleinman, 2002) indicated that children with attention deficit hyperactivity disorder (ADHD) were 2.5 times more likely to have been exposed to alcohol in utero than children without ADHD and this association was not affected by familial psychopathology, social adversity, or comorbid conduct disorder. In addition, deficits in attention have often been observed on laboratory measures (Jacobson, Jacobson, & Sokol, 1994; Jacobson, Jacobson, Sokol, Martier, & Ager, 1993; Nanson & Hiscock, 1990; Streissguth et al., 1986; Streissguth et al., 1984; Streissguth et al., 1994), as well as on parental (Delaney-Black et al., 2000; Janzen, Nanson, & Block, 1995; Mattson & Riley, 2000) and teacher (Brown et al., 1991; Carmichael Olson, Sampson, Barr, Streissguth, & Bookstein, 1992) reports of behavior. In one study, standard measures of attention were used to statistically classify children with FASD and non-exposed controls with a high degree of accuracy (Lee, Mattson, & Riley, 2004).
Although not all research supports the finding of attention deficits in children with prenatal alcohol exposure (for review, see Linnet et al., 2003), the majority of research points to pervasive attention deficits in this population. Several studies have attempted to delineate which aspects of attention are affected by prenatal alcohol exposure in order to establish a profile of function (Streissguth et al., 1986; Streissguth, Bookstein, Sampson, & Barr, 1995; Streissguth et al., 1994). Importantly, however, although both visual and auditory attention are relevant for daily life, most studies have utilized only visual paradigms of assessing attention (i.e., visual continuous performance tests). There have been three studies assessing auditory attention in alcohol-exposed individuals. Two of these studies compared visual and auditory attention and had conflicting results: one study (Coles, Platzman, Lynch, & Freides, 2002) demonstrated that visual attention was more impaired than auditory attention and the other (Connor, Streissguth, Sampson, Bookstein, & Barr, 1999) found the reverse. The third study (Kerns, Don, Mateer, & Streissguth, 1997) assessed only auditory attention and found that while attention to simple auditory stimuli was not impaired, performance decreased as the complexity of the task (and demand on attention) increased. Given the discrepant findings from these studies, more research is needed to clarify the nature of alcohol-related attention deficits.
Cognitive Models of Attention
There have been several competing cognitive models of attention addressed in the study of FASD. Coles and colleagues (Coles et al., 1997) and Streissguth and colleagues (Connor et al., 1999) have investigated the model of attention proposed by Mirsky et al. (Mirsky, Anthony, Duncan, Ahearn, & Kellam, 1991), which describes attention as comprised of four factors: focus, encode, sustain, and shift. These factors, especially sustain, have been investigated in the previous studies cited above (Coles et al., 2002; Connor et al., 1999; Kerns et al., 1997). Posner and colleagues (Posner & Cohen, 1984) have put forth a different model of attention asserting that attention involves three components: disengage, shift, and engage. In this model of attention, one must remove attention from a currently fixated target (disengage), shift attention to a newly relevant target (shift or move) and focus attention upon that new target (engage). Posner has demonstrated the validity of his model in a number of experiments utilizing a paradigm in which targets are preceded by cues (Posner, 1980; Posner & Cohen, 1984; Posner, Walker, Friedrich, & Rafal, 1984). In trials where the cue matches the subsequent location of the target (valid trial), the subject’s response time is shorter than when the cue is not correct (invalid trial), suggesting that attending to the relevant location saves time over disengaging, shifting, and reengaging (Posner, 1980; Posner & Cohen, 1984). Importantly, the shifting of attention in Posner’s model is the shifting of covert attention from one stimulus or location to another, and distinct from Mirsky’s shifting of cognitive set (Mirsky et al., 1991) that is tapped in a task such as the Wisconsin Card Sorting Test (WCST) (Heaton, Chelune, Talley, Kay, & Curtiss, 1993). Previous studies have suggested alcohol-related deficits, in both children with and without a diagnosis of FAS, in shifting of attention based on performance on the WCST (Coles et al., 1997; Kodituwakku, May, Clericuzio, & Weers, 2001), but no previous studies based on Posner’s model exist. Importantly, Posner’s model posits a neurobiological basis for the different aspects of attention with the parietal lobes involved in the disengage component. This is especially relevant given the proposed involvement of the parietal lobes in the brain dysmorphology of FASD (Sowell, Thompson, Mattson et al., 2002; Sowell, Thompson, Peterson et al., 2002).
The current study used a paradigm based on Posner’s model, that provides a cue to disengage attention from one modality (visual) and shift to the alternate modality (auditory). Specifically, the study tests whether the ability to shift attentional focus between sensory modalities is disrupted in individuals with prenatal alcohol exposure, using a paradigm developed by Courchesne and colleagues (Akshoomoff & Courchesne, 1992; Courchesne, Townsend, Akshoomoff, Saitoh et al., 1994). The task involves both visual and auditory focused attention conditions as well as an inter-modality shift condition. In the shift condition, a cue is provided to disengage attention from one modality (visual) and shift to the alternate modality (auditory) and thus successful performance requires the components of attention important to the Posner model (i.e., disengage, shift, engage). We hypothesized that visual focused attention would be more impaired than auditory focused attention and that shifting of attention would be impaired in alcohol-exposed children.
METHODS
Participants
Forty children, age 9–14 years, served as participants in this study. These children were drawn from a larger study of the teratogenicity of alcohol (Mattson, Riley, Gramling, Delis, & Jones, 1997; Mattson et al., 1998; Mattson & Roebuck, 2002; Sowell et al., 2001; Sowell, Thompson, Peterson et al., 2002). The sample comprised two groups, one with heavy prenatal alcohol exposure (FASD) and a non-exposed control group (CON). Children in the FASD group were all born to mothers who abused alcohol during pregnancy. Although specifics of dose and timing are not generally known, heavy exposure was confirmed by maternal or collateral report or through medical, legal, or social service records. Examples of exposure include volumes such as a fifth of liquor or more a day or “drunk day and night.” Alcohol-exposed children were ascertained in one of two ways. First, interested families were referred by Dr. Kenneth Lyons Jones, a dysmorphologist at the University of California, San Diego. Second, children were referred by other health professionals from the community or were occasionally self-referred. Dr. Jones evaluated all alcohol-exposed children, either before his referral or as part of participation in our research program. Of the 20 alcohol-exposed children in this study, 10 met diagnostic criteria for FAS, including pre- and/or postnatal growth deficiency, craniofacial anomalies (e.g., epicanthal folds, short palpebral fissures, smooth philtrum), and evidence of central nervous system dysfunction. Those children with documented histories of heavy prenatal alcohol exposure, but who lacked the growth deficiency and facial dysmorphia to receive a diagnosis of FAS (n = 10), were identified as having prenatal exposure to alcohol (PEA). These children are typically not growth retarded and are considered structurally normal on dysmorphic exam. The majority of children in the FASD group (n = 11, 55%) lived with biological families. Of the remaining children in this group, 7 were adopted and 2 lived with foster families. Children in the CON group were recruited from the community in a variety of ways (e.g., responses from recruitment flyers posted in the community, children of staff members and their friends) and screened for teratogenic exposures, including alcohol, by interview and questionnaire. Mothers of these children reported little (i.e., <1 oz AA/day prior to pregnancy recognition), if any, alcohol use during pregnancy. The groups were closely matched on the basis of age, sex, ethnicity, and socioeconomic status. As part of the ongoing study, all children had previously received an IQ test (WPPSI-R or WISC-III). To have a homogeneous and representative sample of normally developing children, we intentionally excluded from our control group children with IQ scores above 120 and below 80 and those who had a diagnosis of attention deficit hyperactivity disorder. No other psychiatric diagnoses were noted in our control group based on a screening questionnaire. All children in the CON group lived with biological families. We also screened, by parent questionnaire, for visual or auditory problems in all participants. Although in total, 59 children were tested, 14 children (5 FASD and 9 CON) were excluded due to group matching restrictions and an additional 5 children with FAS were excluded because they were unable to complete the task. See Table 1 for a summary of group demographics.
Table 1.
Demographic information for children in the alcohol-exposed (FASD) and non-exposed control (CON) groups.
| Variable | FASD | CON |
|---|---|---|
| N | 20 | 20 |
| Diagnosis (%FAS) | 50.0 | -- |
| Sex (%Female) | 50.0 | 55.0 |
| Ethnicity (%White) | 50.0 | 60.0 |
| Handedness (%Right) | 85.0 | 95.0 |
| Age in Years | ||
| Mn (SD) | 11.42 (1.82) | 11.80 (1.80) |
| Range | 9.00–14.58 | 9.33–14.92 |
| SES | ||
| Mn (SD) | 40.98 (12.45) | 46.30 (11.64) |
| Range | 14–63 | 11–66 |
| FSIQ | ||
| Mn (SD)* | 85.60 (13.11) | 102.25 (8.19) |
| Range | 56–110 | 90–117 |
| VIQ | ||
| Mn (SD)* | 86.65 (12.39) | 103.25 (9.87) |
| Range | 57–108 | 84–119 |
| PIQ | ||
| Mn (SD)* | 86.90 (13.80) | 101.45 (11.06) |
| Range | 64–116 | 79–123 |
p≤.001
Measure
Children with heavy prenatal alcohol exposure and controls were evaluated with a computerized test of attention, which included both focus and shift conditions and assessed both auditory and visual attention. This task, developed by Courchesne and colleagues (Akshoomoff & Courchesne, 1992; Courchesne, Townsend, Akshoomoff, Saitoh et al., 1994; Courchesne, Townsend, Akshoomoff, Yeung-Courchesne et al., 1994) consists of three conditions: visual focus, auditory focus, and auditory-visual shift. For all conditions, visual (blue or yellow squares) and auditory (high or low tones) stimuli were randomly presented at a rate of 450–1450msec and inter-target intervals (ITI) of 450–30000msec. Visual stimuli subtended a visual angle of 1.2º and were presented in the center of a computer monitor. Auditory stimuli were 1000 and 2000Hz binaural tones delivered over headphones. All stimuli were 50msec in duration and were quasi-randomly ordered, with the restriction that there were an adequate number of trials in each ITI. All participants received the same stimuli in the same order and no feedback was given regarding accuracy of responses. To assess impulsivity, which is common in children with FASD, false alarms were also recorded.
For the visual and auditory focus conditions, participants were required to respond manually to visual (yellow boxes) or auditory (low tones) targets, respectively, while ignoring visual and auditory distracters. For the shift condition, participants were required to respond alternately to visual targets and auditory targets. Thus, correct detection of a target served as a cue to disengage and shift attention to the alternate modality. More specifically, correct detection of a visual target (the yellow square) served to signal the need to disengage attention to the visual stimuli and engage attention to the auditory stimuli (the low tone). Similarly, following correct detection of the auditory stimulus, the participant must disengage attention to that modality and engage attention to the visual modality. In this way, the participant shifts attention between the two modalities. For a detailed description of this task, the reader is referred to papers by Courchesne et al. (Akshoomoff & Courchesne, 1992; Courchesne, Townsend, Akshoomoff, Saitoh et al., 1994; Courchesne, Townsend, Akshoomoff, Yeung-Courchesne et al., 1994).
Each condition was administered in blocks of 100 stimuli; each block lasted approximately 90sec. Blocks that did not meet the criteria of 75% accuracy and <10 false alarms were repeated to ensure an adequate number of valid trials. There were no group differences in the number of repeated trials. Testing was continued until 12 successful focus blocks (6 visual and 6 auditory) and 12 successful shift bocks were obtained. The three conditions were administered in the same order (visual focus, auditory focus, auditory-visual shift) for all children. Practice trials, which were similar to test trials, preceded test trials and children were tested off stimulant medications (only one alcohol-exposed child normally took stimulant medications; seven alcohol-exposed children and one control normally took other psychoactive medications, mostly antidepressants, and took them on the day of testing). Hits (correct responses), false alarms (incorrect responses) and reaction time to correct responses were measured for five ITI ranges (0–2.5sec, 2.5–4.5sec, 4.5–6.5sec, 6.5–10.5sec, and 10.5–30.0sec) as in previous studies (Akshoomoff & Courchesne, 1992, 1994; Courchesne, Townsend, Akshoomoff, Saitoh et al., 1994; Courchesne, Townsend, Akshoomoff, Yeung-Courchesne et al., 1994).
RESULTS
Demographic Information
Each group consisted of 20 children. No differences between groups were observed on the basis of age, F(1,38) = 0.46, p = .50, or socioeconomic status, F(1,38) = 1.95, p = .17, as measured by the Hollingshead Four Factor Index of Social Status (A. B. Hollingshead, unpublished data, 1975). There were also no significant differences between groups on the basis of sex, Χ2(df = 1) = 0.10, p = .75, ethnicity, Χ2(df = 1) = 0.40, p = .53, or handedness, Χ2(df = 1) = 1.11, p = .29. As expected, the FASD group had lower scores than the CON group on Full Scale IQ, F(1,38) = 23.19, p < 0.001, Verbal IQ, F(1,38) = 21.97, p < 0.001, and Performance IQ, F(1,38) = 13.54, p = 0.001. See Table 1 for a summary of demographic information.
Attention Measures
Accuracy (%hits), false alarms (%), and reaction time (msec) data were analyzed using analysis of variance (ANOVA) with repeated measures. Because the assumption of sphericity was violated, multivariate statistics are reported. Three potential covariates were examined: SES, age, and FSIQ. Only significant covariates (p < .05) were included in final analyses and are noted accompanying the appropriate analyses. Non-significant covariates were dropped from final analyses. In all cases, group and sex were included as between-subjects variables, however, unless noted, there were no main or interactive effects of sex. Measures of effect size were calculated using Cohen’s d or η2 as appropriate.
Focused Attention
The auditory and visual focus data were analyzed in a 2 x 2 x 2 x 5 repeated measures design with group (CON or FASD) and sex (male or female) as the between-subjects variables and stimulus type (auditory or visual) and inter-target interval (0–2.5sec, 2.5–4.5sec, 4.5–6.5sec, 6.5–10.5sec, or 10.5–30sec) as within-subject repeated measures. In terms of accuracy, the FASD group was less accurate than the CON group. This finding was supported by a main effect of Group for %hits, F(1,35) = 20.20, p < .001. The effect size (Cohen’s d) for this difference was 1.43 (i.e., of “large” strength according to Cohen’s criteria). Age was a significant covariate in this analysis. The Type x Interval interaction was also significant, Pillais F(4,32) = 3.67, p = .01, with an effect size (η2) of .064. Pairwise comparisons with Bonferroni correction were conducted to compare accuracy for the visual and auditory modalities at each level of ITI. These comparisons revealed that accuracy was marginally lower for the auditory trials than the visual trials at the three longest ITIs (.01 < p < .05). However, all accuracy scores exceeded 90% and there were no interactions with group for stimulus type or ITI. Accuracy data are presented in Figure 1.
Figure 1.
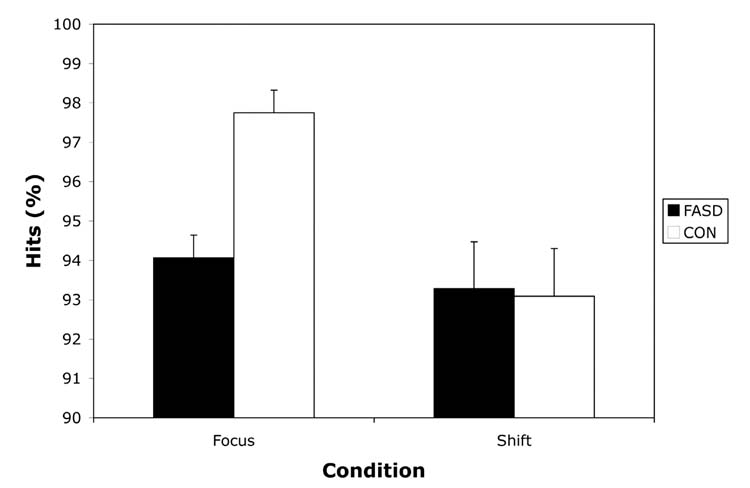
Accuracy (%hits) on focused and shift attention measures for children with heavy preantal alcohol exposure (FASD) and non-exposed controls (CON). Data are presented as Mean +/− SEM.
For the reaction time data, similar analyses were conducted and revealed that the FASD group was slower to respond than the CON group, but this differed by stimulus type and inter-target interval. Specifically, the FASD group was slower to respond to visual stimuli at all ITIs but was only slower to respond to auditory stimuli at the longest ITI. These findings were supported by a significant Group x Type x Interval interaction, Pillais F(4,31) = 3.21, p =.03. The effect size (η2) was .034. Age and SES were significant covariates in this analysis. Pairwise comparisons with Bonferroni correction were conducted to compare the groups at each level of ITI for the visual and auditory modalities separately. These comparisons revealed that for visual stimuli, the FASD group was slower than the CON group at all intervals (p < .01). For auditory stimuli, however, the FASD group was relatively unimpaired and was only significantly slower than the CON group at the longest ITI (p < .01). The groups were marginally different at the middle ITIs (.01 < p < .05) and not significantly different at the two shortest intervals (p > .05). The Group x Interval interaction was also significant, Pillais F(4,31) = 3.55, p =.02, as was the main effect of Group, F(1,34) = 17.34, p <.001. The effect sizes for these analyses were .044 (η2) and 1.33 (Cohen’s d), respectively. In addition, the main effect of Stimulus Type was marginally significant, Pillais F(1,34) = 3.96, p =.06, with an effect size (η2) of .088. However these effects must be interpreted in light of the significant three-way interaction. Reaction time data for the focus conditions are presented in Figure 2a.
Figure 2.
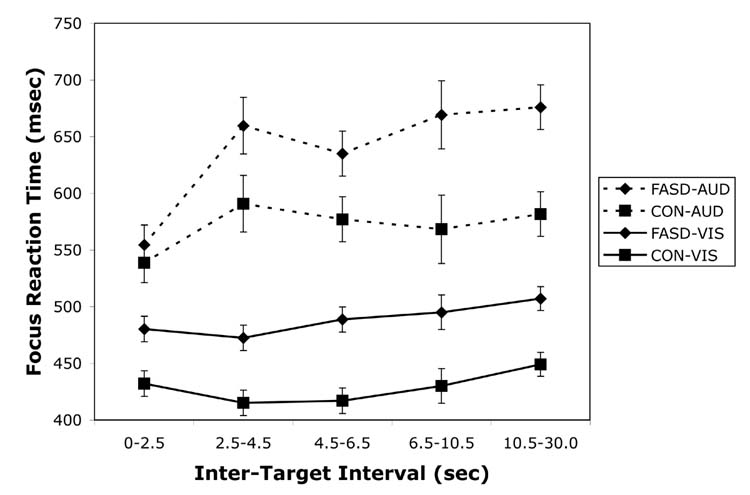
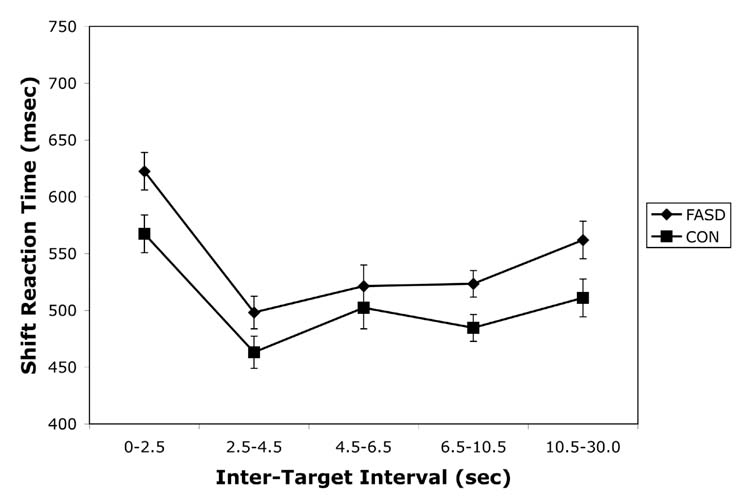
Reaction time on the visual and auditory focused attention measures (a) and the shift of attention measure (b) for children with heavy preantal alcohol exposure (FASD) and non-exposed controls (CON). Data are presented as Mean +/− SEM.
Shift of Attention
Data from the shift condition were analyzed in a similar fashion as the focused attention data, with a 2 x 2 x 5 repeated measures design with group (CON or FASD) and sex (male or female) as the between-subjects variables and inter-target interval (0–2.5sec, 2.5–4.5sec, 4.5–6.5sec, 6.5–10.5sec, or 10.5–30.0sec) as the within-subject repeated measure. For this condition, both groups were equally accurate, resulting in no significant group differences, F (1,35) = 0.01, p = .92. The effect size (Cohen’s d) for this comparison was 0.036 (i.e., of “very small” strength according to Cohen’s criteria). FSIQ was a significant covariate in this analysis. There were no significant effects of interval length or any significant interactions. Accuracy data are presented in Figure 1.
For the reaction time data, a similar analysis revealed that the FASD group was slower to respond than the CON group over all ITIs. This was supported by a significant main effect of Group, F(1,34) = 5.73, p = .02. The effect size (Cohen’s d) for this difference was 0.78 (i.e., of “medium” strength according to Cohen’s criteria). As covariates, SES was significant and age was marginally significant (p = .05). There were no significant effects of interval length or any significant interactions. Reaction time data for the shift condition are presented in Figure 2b.
False Alarms
The number of false alarms made during the focus and shift conditions were analyzed using similar analyses as described for the accuracy and reaction time data. In no case were there any significant differences between the groups or interactions with group. However, for the focused conditions, a significant Type x Interval interaction, Pillais F(4,33) = 5.67, p =.001, was found, with an effect size (η2) of .142. Pairwise comparisons with Bonferroni correction were conducted to compare accuracy for the visual and auditory modalities at each level of ITI. These comparisons revealed that there were more false alarms made on the shortest ITI for the auditory condition than the visual condition (p < .01) and on the middle ITI, there were marginally more false alarms made on the visual condition (.01 < p < .05). SES was a significant covariate for the shift analysis.
Trials to criterion
The number of trials to criterion for the focus and shift conditions were analyzed using similar analyses as described above. For the focused conditions, there was a main effect of Group, F(1,35) = 7.27, p = .01, indicating that the FASD group required more trials to reach criterion than the CON group. The effect size (Cohen’s d) for this difference was 0.86 (i.e., of “large” magnitude according to Cohen’s criteria). However, the Group x Type interaction was also marginally significant, F(1,35) = 3.61, p = .07, with an effect size (η2) of .067. Pairwise comparisons with Bonferroni correction were conducted to compare the groups for each modality collapsed over ITI. These comparisons revealed significant group differences for the auditory condition (p < .01) but not the visual condition (p = .24). Age was a significant covariate in this analysis. For the shift condition, there were no differences between the groups, F(1,35) = 0.08, p = .78, in the number of trials to criterion. The effect size (Cohen’s d) was 0.10 (i.e., of “very small” magnitude according to Cohen’s criteria). FSIQ was a significant covariate in this analysis.
Comparison of FAS and PEA subgroups
All analyses were redone comparing the FAS (n=10) and PEA (n=10) subgroups to each other. There were no differences between these subgroups on any demographic or attention measure.
Relationship to FSIQ
In order to evaluate the relationship of FSIQ to the variables analyzed for this study, Pearson correlations were calculated for the accuracy, reaction time, trials to criterion, and false alarm measures for the visual, auditory and shift conditions. The groups were analyzed separately so that group differences would not drive the correlations. A liberal p < .10 was used for the significance level. For the control group, the following variables were related to FSIQ: number of trials to criterion for the auditory condition, r (18)= −.54, p = .01, and shift accuracy for two of the five ITIs (0–2.5s ITI, r (18) = .65, p = .002; 4.5–6.5s ITI, r (18) = .58, p = .007). For the alcohol-exposed group, the following variables were related to FSIQ: number of trials to criterion for the shift condition, r (18)= −.44, p = .05 and shift accuracy for one of the five ITIs (2.5–4.5s ITI, r (18) = .39, p = .09).
DISCUSSION
These data suggest that children with heavy prenatal alcohol exposure have deficits in attention that are not global in nature. Rather, they appear to exhibit a consistent and significant deficit in visual focused attention, displaying lower accuracy levels and slower reaction times across all intervals. In contrast, in the auditory domain, while the alcohol-exposed children displayed lower accuracy levels, their reaction times are relatively unaffected except at the longest interval, suggesting a difficulty maintaining attention over long intervals (>10sec). In the shift condition, children with FASD were equally accurate but demonstrated slower reaction times across all ITIs. In general, reaction times in both conditions were slower in the FASD group than in the CON group. Recent results from our laboratory (Simmons, Wass, Thomas, & Riley, 2002) suggest that the slowed reaction times seen in the current study are likely due to both central (premotor) and peripheral (motor) slowing.
In this study, the focus conditions were originally considered as control tasks for the shift condition. Both focus and shift conditions have the same task requirements, including selective attention, target discrimination, and motoric responses (Courchesne, Townsend, Akshoomoff, Yeung-Courchesne et al., 1994). The difference between the two conditions is that the shift condition requires shifting attention between modalities. The interesting findings however, appeared in the focus conditions. Specifically, although reaction times were slower for auditory stimuli than visual stimuli for both groups, there were modality-specific effects with persistent deficits in visual attention and ITI-dependent deficits in auditory attention. These results are consistent with reports of slower processing speed and longer reaction times to visual stimuli in infancy following prenatal alcohol exposure (Jacobson et al., 1994; Jacobson et al., 1993) and replicate the findings of Coles et al. (Coles et al., 2002) who suggested a specific deficit in visual attention, based on CPT performance. Interestingly, the inter-stimulus interval in the Coles et al. study was 850msec. At this interval between targets, our alcohol-exposed participants also displayed auditory attention comparable to our controls. It should be noted, however, that unlike in continuous performance tasks, in the current study, there were intervening stimuli (both visual and auditory) between targets. It was only when the ITI was extended that auditory attention deficits became apparent. The fact that auditory attention worsens as the delay between targets increases suggests a deficit in the ability to maintain auditory attention over time. At short intervals, as in our shorter ITIs and the task used in the Coles et al. study, children with prenatal alcohol exposure appear to attend as well as controls to auditory stimuli. However, when task demands are increased and children with FASD are required to maintain this focused attention over time, their ability declines. Such a deficit is likely to impact daily functioning, especially when sustained auditory attention is required, e.g., in the classroom. The deficit in auditory attention at long but not short ITIs is similar to visual attention deficits in children with ADHD who demonstrate difficulty sustaining focused attention over time although initial orienting to visual stimuli is intact (Swanson et al., 1991). The pattern of performance demonstrated by the FASD group in the current study could reflect an underlying deficit in working memory capacity given that group differences were only seen at longer ITIs. The suggestion of Engle and colleagues (e.g. Bleckley, Durso, Crutchfield, Engle, & Khanna, 2003) that working memory capacity is in fact an attentional mechanism is consistent with the data presented herein.
The shift task used in this study was designed to represent an ecologically valid measure, in which stimuli are presented in both visual and auditory modalities. This is different from previous studies, including those of alcohol-exposed individuals, in which stimuli are presented in only one modality. For both groups, the reaction times in the shift condition were intermediate between the visual and auditory reaction times (see Figures 2a and 2b). The FASD group was equally accurate but demonstrated slower reaction time than controls. This pattern of performance is interesting as it suggests that children with FASD are capable of switching between visual and auditory stimuli but are slower to respond, possibly suggesting a greater cognitive effort to respond accurately.
The task was also designed to test the ability to disengage attention from one modality and shift to the alternate modality in the context of rapidly presented stimuli. Failure to disengage on the shift task would register as a false alarm, e.g., the participant continues to respond to a visual target rather than switching to the auditory modality (Courchesne, Townsend, Akshoomoff, Yeung-Courchesne et al., 1994). Contrary to our expectations, there were no group differences in false alarms. We are unable to reconcile this lack of differences with the presumed role of the parietal lobe in this component of attention, given the abnormalities reported in this brain region in FASD (Sowell, Thompson, Mattson et al., 2002; Sowell, Thompson, Peterson et al., 2002). It is possible that this failure to find group differences was related to the methodology used, because trials were repeated if a large number of false alarms were made. However, there were no differences in the number of trials to criterion for the shift condition suggesting that this was not the case. In addition, exploratory analyses, not presented, comparing a subgroup of participants on uncorrected trials (i.e., with more liberal criteria) resulted in the same findings. In addition, FSIQ was a significant covariate in this analysis indicating overall ability level was related to the number of false alarms made in the shift component. When tested without this covariate, there was a difference between the FASD and CON groups, suggesting a role of overall ability level in this measure. However, correlations between FSIQ and the number of false alarms were not significant for either group on any condition.
In terms of the ability to reengage attention, failure to rapidly reengage attention in the opposite modality would register as a missed response and would lead to a lower rate of hits (Courchesne, Townsend, Akshoomoff, Yeung-Courchesne et al., 1994). There were no group differences in this measure on the shift task suggesting that prenatal alcohol exposure does not detrimentally affect the ability to rapidly reengage attention to the alternate modality. There were no differences in accuracy, but the FASD group was slower to respond overall than the CON group on the shift condition. This slowing of reaction time also indicates a general slowing of response that was not clearly dependent on ITI. Given the deficits noted on the visual focus task, this result may be due to the visual demands of the task. There was however, a slight tendency for the difference in reaction time to be larger at the longest ITIs (see Figure 2b), which may be related to the additive effects of pervasive visual deficits and difficulty sustaining auditory attention at these long delays. This tendency was not supported by a group x interval interaction however, and must be viewed as speculative.
Another interesting speculation comes from comparison with the control children included in the studies of Akshoomoff and Courchesne (Akshoomoff & Courchesne, 1992; Courchesne, Townsend, Akshoomoff, Saitoh et al., 1994). Two groups of controls were included in that study, younger (Mn age = 8.6y) and older (Mn age = 13.8y). Visual examination of the mean reaction times for the shift condition suggests that our FASD group (Mn age = 11.4y) is more similar, in reaction time, to the younger controls in the Akshoomoff and Courchesne study. The reaction times of our CON group (Mn age = 11.8y) fell in between the two control groups in the Akshoomoff and Courchesne study, suggesting that the reaction time slowing seen in our FASD group on the shift condition may represent a developmental lag or arrest. A longitudinal study could clarify this possibility. Interestingly, several studies of hyperactive children (Brown, 1982; Pearson, Lane, & Swanson, 1991; Prior, Sanson, Freethy, & Geffen, 1985) suggest that they have difficulty orienting to auditory stimuli and that these skills are “qualitatively immature” (i.e., are more similar to younger children). Future studies of older alcohol-exposed individuals might clarify whether deficits in reaction time improve with age.
Although these results appear, on the surface, to be in contrast to previous studies (Coles et al., 1997; Kodituwakku et al., 2001) reporting that shifting of attention was a weakness in alcohol-exposed children, the discrepancy is most likely due to the definition of “shift” and the measures used. Both previous studies used the Wisconsin Card Sorting test, as suggested by Mirsky (Mirsky et al., 1991) for a measure of shift of attention. The Wisconsin Card Sorting Test requires the participant to shift attention between salient features of a stimulus without a cue. This type of cognitive, or conceptual set-shifting appears to be distinct from the inter-modality shift required by the current task.
These results are also in contrast with the findings of Connor et al. who suggested auditory attention was more affected than visual attention in adults with FASD (Connor et al., 1999). This discrepancy may be related to task-specific factors, e.g., the ITIs studied. Our data clearly show that ITI is an important factor in the study of attention in this population. The discrepancy may also be due to sample differences, e.g., participant age. Connor et al. studied adults with FASD and it may be that attention abilities change with age in this population. Studies of attention in normally developing children as well as hyperactive children indicate developmental differences in this domain (Brown, 1982).
The generalizability of this study may be limited by characteristics specific to the sample tested. For example, the participants in this study were ascertained retrospectively through professional- or self-referral. It may be that families of these children were more likely to participate in our study based on behavioral concerns. However, in previous studies we have demonstrated effects similar to those reported in other studies that do not involve a retrospectively ascertained sample. Importantly, the study of Coles et al. (Coles et al., 2002) that demonstrated similar deficits in visual but not auditory attention was conducted in a prospectively ascertained sample, suggesting that referral source is not a relevant concern in this study.
In addition, factors other than prenatal alcohol exposure may have influenced the results. Specifically, there were group differences in IQ. Although such reductions in IQ are typical for this population, it is possible that the effects seen are secondary to these IQ deficits. However, prenatal alcohol exposure did not uniformly affect all aspects of attention tested in this study. Thus, the pattern of deficits noted is not likely to be due to a reduction in overall cognitive functioning but rather represents a specific profile of attentional deficits. In addition, FSIQ was tested as a covariate for all analyses but did not account for significant variance in most cases. The exception, as noted above, was the analysis of accuracy and trials to criterion for the shift condition, which may be related to overall ability level. Finally, correlations between FSIQ and the study variables revealed only a small number of correlations (5 out of 96 tested), close to the number expected by chance, and did not suggest any clear relationship with FSIQ in this study. Thus, while we don’t exclude a role for overall ability in the profile of attention deficits seen in individuals with heavy prenatal alcohol exposure, the results presented herein do not appear to be confounded by such deficits.
In conclusion, this study tested the ability to focus attention in the visual and auditory modalities as well as the ability to shift attention between these modalities. Thus, the ability to focus, disengage, and reengage attention were tested within one study. Our findings suggest consistent and significant deficits in the ability to focus and sustain attention to visual stimuli and deficits in the ability to sustain attention to auditory stimuli only over longer intervals. In addition, our results suggest a general slowing of reaction time but accurate responses in the alcohol-exposed children when required to shift attention between modalities. However, there were no deficits in the ability to disengage or reengage attention, as supported by the number of hits and false-positive responses. Thus, the attention deficits in children with FASD appear to be primarily those in the focus or engage component of attention and are more pervasive in the visual than auditory modality.
Acknowledgments
The authors thank the members of the Center for Behavioral Teratology especially Dr. Edward Riley. We also thank the families who graciously participate in our studies, the laboratory of Dr. Eric Courchesne for making the measure available and particularly Dr. Jeanne Townsend for providing training and support. Dr. Natacha Akshoomoff provided helpful feedback on earlier versions of this manuscript and Dr. Linda Gallo provided statistical advice.
Footnotes
Research Supported by NIAAA Grants AA10820 and AA12596
References
- Akshoomoff NA, Courchesne E. A new role for the cerebellum in cognitive operations. Behavioral Neuroscience. 1992;106:731–738. doi: 10.1037//0735-7044.106.5.731. [DOI] [PubMed] [Google Scholar]
- Akshoomoff NA, Courchesne E. ERP evidence for a shifting attention deficit in patients with damage to the cerebellum. Journal of Cognitive Neuroscience. 1994;6:388–399. doi: 10.1162/jocn.1994.6.4.388. [DOI] [PubMed] [Google Scholar]
- Bertrand J, Floyd RL, Weber MK, O'Connor M, Riley EP, Johnson KA, Cohen DE. National task force on FAS/FAE: Guidelines for referral and diagnosis. Atlanta, GA: Centers for Disease Control and Prevention; 2004. [Google Scholar]
- Bleckley MK, Durso FT, Crutchfield JM, Engle RW, Khanna MM. Individual differences in working memory capacity predict visual attention allocation. Psychonomic Bulletin & Review. 2003;10:884–889. doi: 10.3758/bf03196548. [DOI] [PubMed] [Google Scholar]
- Brown RT. A developmental analysis of visual and auditory sustained attention and reflection-impulsivity in hyperactive and normal children. Journal of Learning Disabilities. 1982;15:614–618. doi: 10.1177/002221948201501012. [DOI] [PubMed] [Google Scholar]
- Brown RT, Coles CD, Smith IE, Platzman KA, Silverstein J, Erickson S, Falek A. Effects of prenatal alcohol exposure at school age. II. Attention and behavior. Neurotoxicology and Teratology. 1991;13:369–376. doi: 10.1016/0892-0362(91)90085-b. [DOI] [PubMed] [Google Scholar]
- Carmichael Olson H, Sampson PD, Barr H, Streissguth AP, Bookstein FL. Prenatal exposure to alcohol and school problems in late childhood: A longitudinal prospective study. Development and Psychopathology. 1992;4:341–359. [Google Scholar]
- Coles CD, Platzman KA, Lynch ME, Freides D. Auditory and visual sustained attention in adolescents prenatally exposed to alcohol. Alcoholism: Clinical and Experimental Research. 2002;26:263–271. [PubMed] [Google Scholar]
- Coles CD, Platzman KA, Raskind-Hood CL, Brown RT, Falek A, Smith IE. A comparison of children affected by prenatal alcohol exposure and attention deficit, hyperactivity disorder. Alcoholism: Clinical and Experimental Research. 1997;21:150–161. [PubMed] [Google Scholar]
- Connor PD, Streissguth AP, Sampson PD, Bookstein FL, Barr HM. Individual differences in auditory and visual attention among fetal alcohol-affected adults. Alcoholism: Clinical and Experimental Research. 1999;23:1395–1402. [PubMed] [Google Scholar]
- Conry J. Neuropsychological deficits in fetal alcohol syndrome and fetal alcohol effects. Alcoholism: Clinical and Experimental Research. 1990;14:650–655. doi: 10.1111/j.1530-0277.1990.tb01222.x. [DOI] [PubMed] [Google Scholar]
- Courchesne E, Townsend J, Akshoomoff NA, Saitoh O, Yeung-Courchesne R, Lincoln AJ, et al. Impairment in shifting attention in autistic and cerebellar patients. Behavioral Neuroscience. 1994;108:848–865. doi: 10.1037//0735-7044.108.5.848. [DOI] [PubMed] [Google Scholar]
- Courchesne E, Townsend JP, Akshoomoff NA, Yeung-Courchesne R, Press GA, Murakami JW, et al. A new finding: Impairment in shifting attention in autistic and cerebellar patients. In: Broman SH, Grafman J, editors. Atypical cognitive deficits in developmental disorders: Implications for brain function. Hillsdale, NJ: Erlbaum; 1994. pp. 101–137. [Google Scholar]
- Day NL, Richardson GA. Prenatal alcohol exposure: A continuum of effects. Seminars in Perinatology. 1991;15:271–279. [PubMed] [Google Scholar]
- Delaney-Black V, Covington CY, Templin T, Ager J, Nordstrom-Klee B, Martier S, et al. Teacher-assessed behavior of children prenatally exposed to cocaine. Pediatrics. 2000;106:782–791. doi: 10.1542/peds.106.4.782. [DOI] [PubMed] [Google Scholar]
- Fryer SL, McGee CL, Matt GE, Riley EP, Mattson SN. Evaluation of psychopathology in children with heavy prenatal alcohol exposure. Submitted. [DOI] [PubMed] [Google Scholar]
- Heaton RK, Chelune GJ, Talley JL, Kay GG, Curtiss G. Wisconsin card sorting test manual. Odessa, FL: Psychological Assessment Resources, Inc.; 1993. [Google Scholar]
- Jacobson SW, Jacobson JL, Sokol RJ. Effects of fetal alcohol exposure on infant reaction time. Alcoholism: Clinical and Experimental Research. 1994;18:1125–1132. doi: 10.1111/j.1530-0277.1994.tb00092.x. [DOI] [PubMed] [Google Scholar]
- Jacobson SW, Jacobson JL, Sokol RJ, Martier SS, Ager JW. Prenatal alcohol exposure and infant information processing ability. Child Development. 1993;64:1706–1721. [PubMed] [Google Scholar]
- Janzen LA, Nanson JL, Block GW. Neuropsychological evaluation of preschoolers with fetal alcohol syndrome. Neurotoxicology and Teratology. 1995;17:273–279. doi: 10.1016/0892-0362(94)00063-j. [DOI] [PubMed] [Google Scholar]
- Jones KL, Smith DW. Recognition of the fetal alcohol syndrome in early infancy. Lancet. 1973;2:999–1001. doi: 10.1016/s0140-6736(73)91092-1. [DOI] [PubMed] [Google Scholar]
- Jones KL, Smith DW, Ulleland CN, Streissguth AP. Pattern of malformation in offspring of chronic alcoholic mothers. Lancet. 1973;1:1267–1271. doi: 10.1016/s0140-6736(73)91291-9. [DOI] [PubMed] [Google Scholar]
- Kerns KA, Don A, Mateer CA, Streissguth AP. Cognitive deficits in nonretarded adults with fetal alcohol syndrome. Journal of Learning Disabilities. 1997;30:685–693. doi: 10.1177/002221949703000612. [DOI] [PubMed] [Google Scholar]
- Kodituwakku PW, May PA, Clericuzio CL, Weers D. Emotion-related learning in individuals prenatally exposed to alcohol: An investigation of the relation between set shifting, extinction of responses, and behavior. Neuropsychologia. 2001;39:699–708. doi: 10.1016/s0028-3932(01)00002-1. [DOI] [PubMed] [Google Scholar]
- Korkman M, Autti-Rämö I, Koivulehto H, Granström ML. Neuropsychological effects at early school age of fetal alcohol exposure of varying duration. Child Neuropsychology. 1998;4:199–212. [Google Scholar]
- LaDue RA, Streissguth AP, Randels SP. Clinical considerations pertaining to adolescents and adults with fetal alcohol syndrome. In: Sonderegger TB, editor. Perinatal substance abuse: Research findings and clinical implications. Baltimore: The Johns Hopkins University Press; 1992. pp. 104–131. [Google Scholar]
- Lee KT, Mattson SN, Riley EP. Classifying children with heavy prenatal alcohol exposure using measures of attention. Journal of the International Neuropsychological Society. 2004;10:271–277. doi: 10.1017/S1355617704102142. [DOI] [PubMed] [Google Scholar]
- Lemoine P, Harousseau H, Borteyru JP, Menuet JC. Les enfants de parents alcooliques. Anomalies observees. A propos de 127 cas [Children of alcoholic parents. Abnormalities observed in 127 cases] Ouest Medical. 1968;21:476–482. [Google Scholar]
- Linnet KM, Dalsgaard S, Obel C, Wisborg K, Henriksen TB, Rodriguez A, et al. Maternal lifestyle factors in pregnancy risk of attention deficit hyperactivity disorder and associated behaviors: Review of the current evidence. American Journal of Psychiatry. 2003;160:1028–1040. doi: 10.1176/appi.ajp.160.6.1028. [DOI] [PubMed] [Google Scholar]
- Mattson SN, Goodman AM, Caine C, Delis DC, Riley EP. Executive functioning in children with heavy prenatal alcohol exposure. Alcoholism: Clinical and Experimental Research. 1999;23:1808–1815. [PubMed] [Google Scholar]
- Mattson SN, Riley EP. A review of the neurobehavioral deficits in children with fetal alcohol syndrome or prenatal exposure to alcohol. Alcoholism: Clinical and Experimental Research. 1998;22:279–294. doi: 10.1111/j.1530-0277.1998.tb03651.x. [DOI] [PubMed] [Google Scholar]
- Mattson SN, Riley EP. Parent ratings of behavior in children with heavy prenatal alcohol exposure and IQ-matched controls. Alcoholism: Clinical and Experimental Research. 2000;24:226–231. [PubMed] [Google Scholar]
- Mattson SN, Riley EP, Gramling LJ, Delis DC, Jones KL. Heavy prenatal alcohol exposure with or without physical features of fetal alcohol syndrome leads to IQ deficits. Journal of Pediatrics. 1997;131:718–721. doi: 10.1016/s0022-3476(97)70099-4. [DOI] [PubMed] [Google Scholar]
- Mattson SN, Riley EP, Gramling LJ, Delis DC, Jones KL. Neuropsychological comparison of alcohol-exposed children with or without physical features of fetal alcohol syndrome. Neuropsychology. 1998;12:146–153. doi: 10.1037//0894-4105.12.1.146. [DOI] [PubMed] [Google Scholar]
- Mattson SN, Roebuck TM. Acquisition and retention of verbal and nonverbal information in children with heavy prenatal alcohol exposure. Alcoholism: Clinical and Experimental Research. 2002;26:875–882. [PubMed] [Google Scholar]
- Mick E, Biederman J, Faraone SV, Sayer J, Kleinman S. Case-control study of attention-deficit hyperactivity disorder and maternal smoking, alcohol use, and drug use during pregnancy. Journal of the American Academy of Child and Adolescent Psychiatry. 2002;41:378–385. doi: 10.1097/00004583-200204000-00009. [DOI] [PubMed] [Google Scholar]
- Mirsky AF, Anthony BJ, Duncan CC, Ahearn MB, Kellam SG. Analysis of the elements of attention: A neuropsychological approach. Neuropsychology Review. 1991;2:109–145. doi: 10.1007/BF01109051. [DOI] [PubMed] [Google Scholar]
- Nanson JL, Hiscock M. Attention deficits in children exposed to alcohol prenatally. Alcoholism: Clinical and Experimental Research. 1990;14:656–661. doi: 10.1111/j.1530-0277.1990.tb01223.x. [DOI] [PubMed] [Google Scholar]
- Pearson DA, Lane DM, Swanson JM. Auditory attention switching in hyperactive children. Journal of Abnormal Child Psychology. 1991;19:479–492. doi: 10.1007/BF00919090. [DOI] [PubMed] [Google Scholar]
- Posner MI. Orienting of attention. Quarterly Journal of Experimental Psychology. 1980;32:3–25. doi: 10.1080/00335558008248231. [DOI] [PubMed] [Google Scholar]
- Posner MI, Cohen Y. Components of visual orienting. In: Bouma H, Bouwhuis DG, editors. Attention and performance X: Control of language processes. Hillsdale, New Jersey: Lawrence Erlbaum Associates; 1984. pp. 531–557. [Google Scholar]
- Posner MI, Walker JA, Friedrich FJ, Rafal RD. Effects of parietal injury on covert orienting of attention. Journal of Neuroscience. 1984;4:1863–1874. doi: 10.1523/JNEUROSCI.04-07-01863.1984. [DOI] [PMC free article] [PubMed] [Google Scholar]
- Prior M, Sanson A, Freethy C, Geffen G. Auditory attentional abilities in hyperactive children. Journal of Child Psychology and Psychiatry. 1985;26:289–304. doi: 10.1111/j.1469-7610.1985.tb02267.x. [DOI] [PubMed] [Google Scholar]
- Schonfeld AM, Mattson SN, Lang AR, Delis DC, Riley EP. Verbal and nonverbal fluency in children with heavy prenatal alcohol exposure. Journal of Studies on Alcohol. 2001;62:239–246. doi: 10.15288/jsa.2001.62.239. [DOI] [PubMed] [Google Scholar]
- Simmons RW, Wass T, Thomas JD, Riley EP. Fractionated simple and choice reaction time in children with prenatal exposure to alcohol. Alcoholism: Clinical and Experimental Research. 2002;26:1412–1419. doi: 10.1097/01.ALC.0000030563.14827.29. [DOI] [PubMed] [Google Scholar]
- Sowell ER, Mattson SN, Thompson PM, Jernigan TL, Riley EP, Toga AW. Mapping callosal morphology and cognitive correlates: Effects of heavy prenatal alcohol exposure. Neurology. 2001;57:235–244. doi: 10.1212/wnl.57.2.235. [DOI] [PubMed] [Google Scholar]
- Sowell ER, Thompson PM, Mattson SN, Tessner KD, Jernigan TL, Riley EP, Toga AW. Regional brain shape abnormalities persist into adolescence after heavy prenatal alcohol exposure. Cerebral Cortex. 2002;12:856–865. doi: 10.1093/cercor/12.8.856. [DOI] [PubMed] [Google Scholar]
- Sowell ER, Thompson PM, Peterson BS, Mattson SN, Welcome SE, Henkenius AL, et al. Mapping cortical gray matter asymmetry patterns in adolescents with heavy prenatal alcohol exposure. NeuroImage. 2002;17:1807–1819. doi: 10.1006/nimg.2002.1328. [DOI] [PubMed] [Google Scholar]
- Steinhausen HC, Spohr HL. Long-term outcome of children with fetal alcohol syndrome: Psychopathology, behavior and intelligence. Alcoholism: Clinical and Experimental Research. 1998;22:334–338. doi: 10.1111/j.1530-0277.1998.tb03657.x. [DOI] [PubMed] [Google Scholar]
- Stratton K, Howe C, Battaglia F. Fetal alcohol syndrome: Diagnosis, epidemiology, prevention, and treatment. Washington, DC: National Academy Press; 1996. [Google Scholar]
- Streissguth AP, Barr HM, Kogan J, Bookstein FL. Final report: Understanding the occurrence of secondary disabilities in clients with fetal alcohol syndrome (FAS) and fetal alcohol effects (FAE) Seattle, WA: University of Washington Publication Services; 1996. [Google Scholar]
- Streissguth AP, Barr HM, Sampson PD, Parrish-Johnson JC, Kirchner GL, Martin DC. Attention, distraction and reaction time at age 7 years and prenatal alcohol exposure. Neurobehavioral Toxicology and Teratology. 1986;8:717–725. [PubMed] [Google Scholar]
- Streissguth AP, Bookstein FL, Sampson PD, Barr HM. Attention: Prenatal alcohol and continuities of vigilance and attentional problems from 4 through 14 years. Development and Psychopathology. 1995;7:419–446. [Google Scholar]
- Streissguth AP, Martin DC, Barr HM, Sandman BM, Kirchner GL, Darby BL. Intrauterine alcohol and nicotine exposure: Attention and reaction time in 4-year-old children. Developmental Psychology. 1984;20:533–541. [Google Scholar]
- Streissguth AP, O'Malley K. Neuropsychiatric implications and long-term consequences of fetal alcohol spectrum disorders. Seminars in Clinical Neuropsychiatry. 2000;5:177–190. doi: 10.1053/scnp.2000.6729. [DOI] [PubMed] [Google Scholar]
- Streissguth AP, Sampson PD, Olson HC, Bookstein FL, Barr HM, Scott M, et al. Maternal drinking during pregnancy: Attention and short-term memory in 14-year-old offspring -- a longitudinal prospective study. Alcoholism: Clinical and Experimental Research. 1994;18:202–218. doi: 10.1111/j.1530-0277.1994.tb00904.x. [DOI] [PubMed] [Google Scholar]
- Swanson JM, Posner M, Potkin S, Bonforte S, Youpa D, Fiore C, et al. Activating tasks for the study of visual-spatial attention in ADHD children: A cognitive anatomic approach. Journal of Child Neurology. 1991;6(Suppl):S119–127. doi: 10.1177/0883073891006001s12. [DOI] [PubMed] [Google Scholar]