

Abstract
This article reviews dual X-ray absorptiometry (DXA) technique and interpretation with emphasis on the considerations unique to pediatrics. Specifically, the use of DXA in children requires the radiologist to be a “clinical pathologist” monitoring the technical aspects of the DXA acquisition, a “statistician” knowledgeable in the concepts of Z-scores and least significant changes, and a “bone specialist” providing the referring clinician a meaningful context for the numeric result generated by DXA. The patient factors that most significantly influence bone mineral density are discussed and are reviewed with respect to available normative databases. The effects the growing skeleton has on the DXA result are also presented. Most important, the need for the radiologist to be actively involved in the technical and interpretive aspects of DXA is stressed. Finally, the diagnosis of osteoporosis should not be made on DXA results alone but should take into account other patient factors.
Keywords: Pediatric DXA, Technique interpretation, Osteoporosis
Introduction
After its commercial introduction in 1987, dual energy X-ray absorptiometry (DXA) has become a widely available and clinically useful tool in the evaluation and management of adult bone diseases. More recently, its utilization in the pediatric population has rapidly increased. DXA presents unique challenges to pediatric radiologists, and the aim of this article is to review the technique and interpretation of DXA. Special focus is on the issues unique to pediatric DXA emphasizing the need for an expanded role for the pediatric radiologist in the performance and interpretation of DXA examinations.
Is the result of a DXA examination a number or a diagnosis? From the radiologist’s perspective, it is both, making it different from all other imaging studies. Like many laboratory tests, the DXA examination generates a numerical result. The radiologist, like the clinical pathologist, must be knowledgeable about the processes by which that number is obtained and must ensure that meticulous technique is used [1]. Additionally, the radiologist must be knowledgeable about the statistical limitations and uses of a numerical result. For example, he or she must be familiar with the precision and accuracy of the technique and be able to consult regarding the least significant change and be able to suggest appropriate follow-up intervals [2]. The radiologist must also interpret the study in terms of the relevant patient factors that influence the numeric result. These factors include gender, ethnicity, height, weight, body composition, and physiologic maturity, and they might be incorporated in the interpretation of the study. Therefore, the result of a DXA examination is both a number and a diagnosis, and radiologists should be expert in understanding and reporting both aspects in the DXA report. The diagnosis of osteoporosis should not be made on DXA results alone but should take into account other patient factors. Additionally, the radiologist needs to be aware of the limitations of DXA in children [3]: there are difficulties in scan interpretation because DXA is an areal rather than a volumetric density measurement; the growing skeleton has an impact on follow-up measurements; there is a lack of consensus regarding the patient demographic and physiologic factors that should be incorporated into normative databases; and there is yet to be determined a prognostic value of pediatric DXA with regard to fracture risk or peak bone mineral density (BMD) [4].
Areal vs. volumetric bone mineral density
As in all radiologic studies, DXA relies on the differential absorption of X-rays to differentiate tissues of different radiographic density. In addition, DXA can quantify (in grams) the bone mineral content (BMC) at various body sites. By selecting regions of interest, a bone area (BA) is selected with units of centimeters squared. (The abbreviation BA for bone area should not be mistaken for bone age.) BMD is measured directly for each pixel in the region of interest (ROI) by comparing the X-ray attenuation of that pixel to a reference standard. It has units of grams per centimeter squared. This value is multiplied by the pixel’s area to derive the BMC of that pixel with units of grams. The areas of all the pixels in the ROI are summed to give BA. Thus, BMD = BMC/BA.
Unlike other density measurements, the DXA-derived BMD is based on the two-dimensional projected area of a three-dimensional structure. The third dimension, depth, cannot be accounted for directly because it is in the same direction as the X-ray beam. Therefore, DXA-derived BMD is an areal (aBMD) rather than a true volumetric (vBMD) density. Because the third dimension is unaccounted for, problems with DXA-derived BMD can arise [5]. Specifically, smaller bones will be found to have lower aBMD than larger bones, even when the vBMD is the same (Fig. 1). For material of the same true density, a larger cube will be stronger than a smaller cube. Thus, in giving a lower aBMD for smaller bones when compared to larger bones with the same vBMD, an aBMD might give a more accurate indication of bone strength relative to size than a vBMD. Additionally, unlike adult patients in whom the bone volume does not change over time, a child’s bones grow over time and the growth of individual bones is not uniform in three dimensions. Thus, errors resulting from areal measurements of BMD might be introduced with DXA and can make comparison of follow-up and baseline studies more challenging to interpret in pediatric patients [4].
Fig. 1.

For two bones of known BMD=1g/cm2, the DXA-derived areal BMD will be higher in the larger bone because of the lack of accounting for the true volume of the measured bone. It should be noted that the larger cube will be stronger than the smaller cube (adapted from Carter et al. [5], with permission)
Technical aspects of DXA performance
Patient positioning and ROI selection as performed by the technologist require precision [6] and evaluation by the radiologist for each study. The lumbar spine should be straight and centered in the image, with visualization of the last rib pair and the upper sacrum. Artifacts, including enteric tubes, orthopedic hardware, and jewelry, should be excluded from the image, if possible. Vertebral segments with overlying artifacts should be excluded from BMD analysis. The ROIs are generated automatically using edge-detection software and are selected for the L1 to L4 vertebral bodies. These regions should include the entire vertebral body with a minimum of adjacent soft tissue (Fig. 2). For evaluation of the hip, the femoral shaft should be parallel to the long axis of the image with only a small amount of the lesser trochanter visualized. When using the manufacturer’s provided positioning device, there should be no overlap of the trochanters and the femoral neck or acetabulum. The ROIs include the femoral neck, trochanter, intertrochanteric, and total hip, (Fig. 2). The region of lowest femoral neck BMD, known as Ward’s triangle, is not used in pediatric DXA analysis, and, often, use of the total hip measurement is favored over the other subgroups in clinical practice because of its higher precision than the subgroups. Whole-body scanning provides total body BMC and BMD but also allows for subregions with appropriately drawn ROIs (Fig. 2). Because of the normally low BMD in young children, software analysis is modified for children to improve edge detection of lower-density bone. Such algorithms have been validated in healthy, obese, and chronically ill children for the assessment of lumbar BMD [7]. The adult algorithm significantly overestimates lumbar BMD when compared to the pediatric low-density algorithm (Table 1), because lower-density bone pixels will be excluded using the adult algorithm [8, 9]. It is suggested that normative pediatric data be collected using the low-density analysis routinely in children, thus allowing meaningful comparisons of patient data to normal data, and that the DXA report indicate which algorithm (adult or pediatric) was used [3].
Fig. 2.

DXA images. a AP image of the lumbar spine shows regions of interest from L1 to L4. The bone area and mineral content are used to derive the bone mineral density at each level. The areal density is based on the bone area; the depth dimension is not directly assessed with DXA. Note transitional lumbosacral vertebral body. b AP image of the lumbar spine shows regions of interest from L1 to L4. AP DXA image of the left hip shows regions of interest of the femoral neck, greater trochanter, and total hip. c Total body scan with sub-regions of interests for trunk, extremities, and head
Table 1.
Effect of pediatric vs. adult software analysis on bone area and BMC results. Total body DXA from a 13-year-old patient processed using pediatric and adult software. Note decreased BA (1315 cm2) and BMC (1149 g) but increased BMD (0.874 g/cm2) with the adult technique. Low-density portions of the bone are included using the pediatric technique and thus a larger BA (1810 cm2) with a greater BMC (1375 g) are obtained but the BMD (0.759 g/cm2) is lower because of the inclusion of low-density bone pixels
| Region | Pediatric | Adult | ||||
|---|---|---|---|---|---|---|
| BA (cm2) | BMC (g) | BMD (g/cm2) | BA (cm2) | BMC (g) | BMD (g/cm2) | |
| Left arm | 201 | 93 | 0.465 | 114 | 71 | 0.622 |
| Right arm | 196 | 97 | 0.497 | 116 | 76 | 0.655 |
| Left ribs | 79 | 40 | 0.507 | 75 | 39 | 0.511 |
| Right ribs | 98 | 51 | 0.525 | 92 | 48 | 0.525 |
| Thoracic spine | 85 | 48 | 0.569 | 83 | 48 | 0.524 |
| Lumbar spine | 49 | 28 | 0.50 | 33 | 20 | 0.599 |
| Pelvis | 179 | 136 | 0.760 | 115 | 95 | 0.829 |
| Left leg | 353 | 269 | 0.76 | 228 | 199 | 0.873 |
| Right leg | 338 | 245 | 0.724 | 226 | 187 | 0.829 |
| Subtotal | 1577 | 1008 | 0.639 | 1081 | 782 | 0.723 |
| Head | 233 | 367 | 1.572 | 233 | 367 | 1.572 |
| Total | 1810 | 1375 | 0.759 | 1315 | 1149 | 0.874 |
The sites selected for BMD analysis should provide a robust evaluation of the patient bone density status. If technically feasible, the pediatric DXA examination should measure lumbar spine and total body BMD [3]. The manufacturers’ normative data for the hip in preadolescents are limited, and evaluation of the hip is not recommended in these young children. There are normative DXA data for the adolescent hip, especially in girls [10], and for these patients this site might be a useful addition to the standard examination. When evaluating group data of normal children, there is usually close correlation of BMD between the lumbar spine and hip [11]. For individuals, when the DXA results deviate from normal, there is less concordance between these two sites. For example, if the hip Z- score is between +1 and −1, the lumbar Z-score will vary an average of less than 0.5 SD from the hip score. As the hip Z-score decreases to −3, the lumbar score varies on average 1.7 SD from the hip Z-score. For example, immobilized or paraplegic children might have preserved lumbar BMD but low hip BMD. If evaluation of the spine and hip is not feasible because of extensive orthopedic hardware or patient positioning issues, DXA of the forearm can be performed. However, there are few normative data for pediatric forearm studies, and the value obtained might be useful only when compared to subsequent studies. Because of its reproducibility and lack of areal density-related errors, the total body BMC is preferred for the assessment of bone status by some clinicians and researchers [12].
The DXA lumbar ROI will not include the thoracic spine. However, the identification of a thoracic body compression deformity in patients with osteoporosis has significant prognostic value, indicating a higher risk of subsequent vertebral compression fractures. Evaluation of thoracic and lumbar vertebral bodies can be achieved with modern DXA scanners (Fig. 3) and can identify thoracic compression fractures that would have been otherwise undiagnosed. Makitie et al. [13] found compressive thoracic deformities in 11 of 32 children suspected of having secondary osteoporosis who were studied with DXA. Of these 11 children, 8 had normal lumbar DXA, and the demonstration of a thoracic compressive deformity was thought to be an important diagnostic and prognostic finding. The addition of vertebral morphologic assessment might be an important adjunct in the diagnosis of pediatric osteoporosis.
Fig. 3.
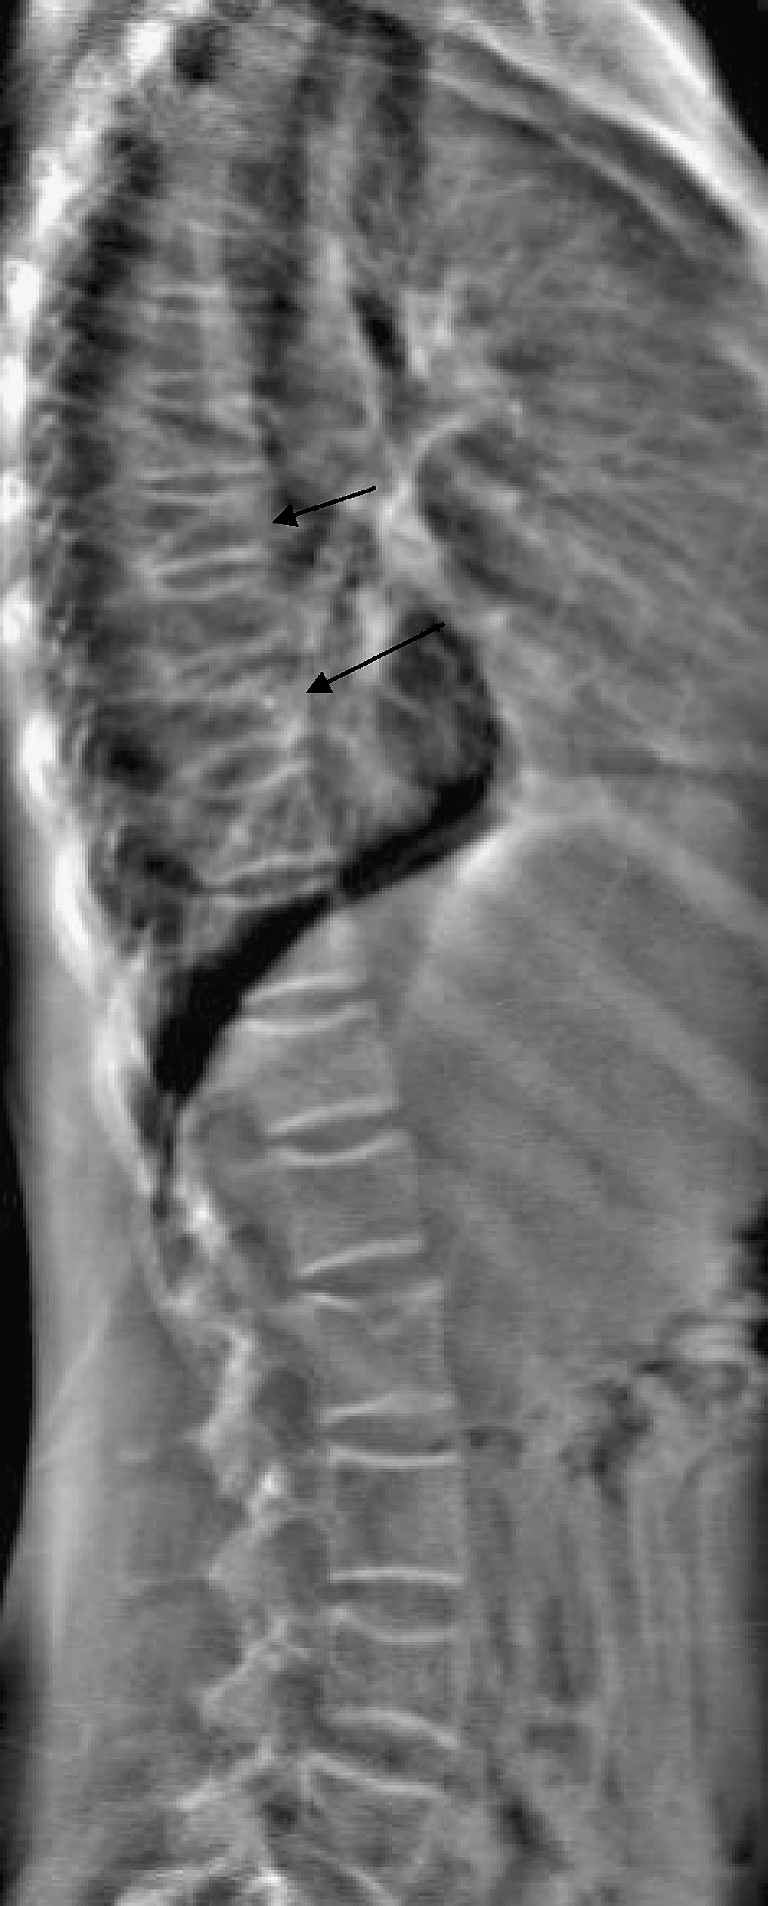
Lateral thoracic and lumbar spine image from DXA study for vertebral morphology. Note compressive deformities at T-7 and T-9, and a Schmorl’s node at L1, with otherwise normal vertebral morphology of the lumbar spine
DXA requires remarkably low radiation doses. Using manufacturers’ data, the effective dose for lumbar spine and whole-body DXA is reported to be 1−5 μSv [14]. This is less than the dose of a standard PA chest radiograph. Scanning times are now less than 2 min for the spine, hip or forearm, and less than 3 min for the total body.
Accuracy, precision, and least significant change
DXA provides both accurate and precise bone mineral data. Accuracy refers to how close a measured value is to the true value as determined by a gold-standard technique. For BMC, the gold standard is the laboratory assessment of ashed bones, and DXA measurements of BMC are within 7–9% of ashed bone measurements [15, 16]. Precision is a measure of reproducibility of a measurement and can be expressed in terms of coefficients of variation (%CV). Both short- and long-term precision are important in performing DXA examinations. Short-term precision reflects both the imprecision of the equipment (manufacturers report this to be less than 1%) and the imprecision resulting from variation in patient positioning and motion effects (typical values are less than 2–3% for the spine, up to 5% for the hip, and 1–2% for the whole body) [14, 17, 18]. This component varies with each technologist and should be calculated with a repeated measures procedure [2]. Long-term precision is a measure of machine drift. It is normally well below 1%, and the radiologist should review the daily quality control scans of phantoms graphed over a period of weeks in order to detect this [15].
Because the DXA result is a number, the radiologist must be aware that the magnitude of change required to be statistically significant varies with the precision of the measurement technique. This is expressed in terms of the least significant change (LSC), and is equal to 2.8×%CV for the 95% confidence limit [2]. If the %CV was 1.5, then a change from the baseline measurement of 4.2% would be required for it to be considered statistically significant. The LSC can also be used to suggest the timing of follow-up measurements, i.e. if the LSC is 4.2% and the expected annual rate of change in the BMC or BMD is 2%, a follow-up study before 2 years would likely result in a value not statistically significantly different from the baseline. The annual rates of change in BMC and BMD vary considerably during childhood, with dramatic acceleration of bone accrual during the early pubertal years [19–21], especially in females [22]. The annual rates of change for early-stage and late-stage adolescents are approximately 25% and 10% for BMC and 10% and 3% for BMD [23]. For most pediatric conditions, follow-up examinations are obtained between 6 and 12 months.
DXA in newborns
DXA has been used to evaluate bone mineralization in newborns and young infants since its inception as a clinical tool, and numerous investigators have established its precision and accuracy [24–28]. The technique has a high degree of accuracy, even in preterm low-birth-weight neonates, with a slight underestimation of BMC of approximately 7% [26, 28]. The high precision of DXA has been shown in neonates with %CV of 2.4% [25] for measurements of the lumbar spine and of the total body BMC when assessed in piglets [26]. The absorbed dose is extremely low, and most neonates and infants can be imaged with gentle immobilization without the need for sedation.
Normative data for neonates indicate a very close relationship of total body BMC and BA with weight; height is also strongly correlated with BMC in the newborn [25]. Koo et al. [29] found weight and, to a lesser extent, body length but not gender or race to predict total body BMC, BA and BMD in newborns. Additionally, body mass was more closely correlated with BMC and BA than BMD. This may be because of DXA-derived BMD is areal rather than volumetric. Last, the proportional contribution to total body BMC from each subregion (head, trunk, and upper and lower extremities) is maintained across gestational ages (27–42 weeks) and birth weights (1–4 kg) with only slight variation [29].
Indications for pediatric DXA
Despite many potential uses of DXA, there has been relatively little written regarding the indications for DXA in children. The International Society for Clinical Densitometry has suggested that any child being treated or considered for treatment of osteoporosis should undergo a DXA examination [3]. The National Osteoporosis Foundation lists the following indications for DXA in children: systemic long-term steroids, chronic inflammatory conditions, hypogonadism, prolonged immobilization, osteogenesis imperfecta, idiopathic juvenile osteoporosis, recurrent low trauma fractures, and apparent osteopenia on radiographs [14]. It is important to note that DXA would be inappropriate for skeletal pain, chronic disease and traumatic fractures without any of the additional risk factors listed above [14]. The National Institutes of Health recommend a baseline DXA examination for patients for whom systemic corticosteroids will be used for more than 2 months or who are at significant risk of osteoporotic fracture [30]. These guidelines are also suggested by the American College of Rheumatology [31]. The American College of Radiology has listed DXA of the lumbar spine and hip as highly appropriate for pediatric patients with a significant risk factor for osteoporosis [32]. Recommendations from other subspecialty societies have been slow in coming. Neither the Society for Pediatric Radiology nor the American Academy of Pediatrics has made recommendations regarding pediatric DXA.
Pediatric DXA interpretation
As with other laboratory tests, the numeric value reported is meaningless without comparison to the appropriate normal controls. After comparison is made, the reported value is given as a percentile or a standard deviation score, the Z-score. A Z-score of zero is equivalent to the mean, and Z-scores of −1 and +1.5 are equivalent to values one standard deviation below and 1.5 standard deviations above the mean, respectively. The T-score (comparison of the current Z-score with peak adult BMD) is used in adult interpretation of DXA but should not be included in the pediatric DXA report [3]. Because the T-score is a measure of bone density loss since early adulthood, its use in children whose BMD has yet to peak will always yield a low result. Because the World Health Organization’s DXA-based definitions of osteopenia and osteoporosis are in terms of T-scores, T<−1.0 and T<−2.5, respectively [3], a different terminology is needed for pediatric patients. It is recommended that the phrase “low bone density” be used in DXA reports [3]. Some clinicians and researchers use the terms osteopenia and osteoporosis in children when Z-scores are less than −1.0 and −2.5, respectively. It is important to note that the diagnosis of osteoporosis should not be made on DXA results alone but should take into account other patient factors.
Much of the research in pediatric DXA has focused on determining which factors most influence BMD and should be accounted for in the development of normative pediatric datasets. The factors age, gender, ethnicity, and physiologic maturity level have been extensively studied and are included in most current normative datasets provided by the major DXA manufacturers. Some of the earliest reports indicate the influence of age on BMD values, and several authors have presented normal data accounting for age [10, 19–21, 33]. The effect that age has on BMD is largely related to the increase in frame size that occurs with increasing chronologic age. Increasing height and weight strongly correlate with increasing BMC and BMD. The changes in height and weight are most pronounced during the pubertal growth spurt. BMD increases rapidly during early puberty [21, 34], but because the age of pubertal onset is quite variable, physiologic maturity has a stronger influence on BMD than age. Several authors have included Tanner stage or gynecologic age as a primary factor in their normative datasets [21, 34–37]. Weight is an important factor influencing BMD for multiple reasons [4, 19, 20, 32, 38, 39] and has been included in normal datasets [10, 34]. Ethnicity has been determined to be important in the analysis of BMD results, with black children showing significantly higher BMD values than non-black children [10, 20, 36, 39–41]. Multiple factors are thought to account for this, including increased cross-sectional area in the axial skeleton and thicker trabecula in cancellous bone [36]. Lifestyle and anthropometric factors might also play a role [42].
There are numerous published pediatric normative datasets, many of which are summarized in Table 2. These datasets have been developed using a variety of scanners and processing software and are based on various combinations of demographic and physiologic patient variables. Rather than simplifying pediatric DXA interpretation, the sheer number of available normal databases has made DXA interpretation complex, confusing, and at times erroneous [43]. To report the numeric result generated from the manufacturer’s automated processing without consideration of factors specific to the patient being studied is unacceptable. This often will lead to misdiagnoses and can result in inappropriate therapy [44]. In fact, the diagnosis of osteoporosis in a child based on a DXA result is often a misinterpretation of the scan data. Gafni and Baron [45] found this to be the case in more than half of the pediatric patients referred to them with the diagnosis of osteoporosis. The most common causes for misdiagnosis were the use of T-scores, inappropriate normative datasets, inadequate ROIs, and inattention to short stature.
Table 2.
Normative pediatric DXA databases (C/B/H/A/O Caucasian/black/Hispanic/Asian/other, GA gestational age, (L) longitudinal study, SA surface area)
| Reference | Year | Scanner | No. of patients (M/F) | Age range | Ethnicity (C/B/H/A/O) | Input | Output |
|---|---|---|---|---|---|---|---|
| 25 | 1992 | Hologic 1000 PB | 29/28 | Newborn | GA + weight + height + SA | Lumbar BMD and BMC | |
| 25 | 1992 | Hologic 1000 PB | 22 total | 1–24 months | GA + weight + height + SA | Lumbar BMD and BMC | |
| 29 | 1996 | Hologic 1000 PB | 82/68 | GA 27–42 weeks | Weight | Total BMD, BMC and BA | |
| 35 | 1991 | Hologic 1000 PB | 84/134 | 2–17 years | 162/56/0/0/0 | Weight + Tanner stage | Lumbar BMD |
| 56 | 1990 | Lunar DP-3 | 184 total | 5–11 years | Weight | Lumbar BMD | |
| 57 | 1993 | Norland XR-26 | 86/68 | 5–18 years | Gender + Tanner stage | Total BMC and % fat | |
| 46 | 1997 | Hologic 1000 PB | 142/201 | 4–19 years (L) | 343/0/0/0/0 | Gender + Tanner stage | Total BMD, BMC and BA |
| 58, 59 | 2002 | Lunar DPXL/PED | 188/256 | 4–20 years (L) | 444/0/0/0/0 | Gender + age | Lumbar BMD and apparent BMD or total BMC, % fat and lean body mass |
| Gender + Tanner stage | Lumbar BMD and apparent BMD or total BMD and BMC | ||||||
| 62 | 2002 | Hologic 4500 FB | 107/124 | 5–22 years | 226/0/0/3/2 | Gender + age | Total BMC and BA |
| Gender + height | Total BA | ||||||
| Gender + total BMC | Total BMD | ||||||
| 61 | 2005 | Hologic 4500 FB | up to 1948 | 3–20 years | Gender + age | Lumbar, total hip and total BMD | |
| 21 | 1991 | Hologic 1000 PB | 109/98 | 9–18 years | 207/0/0/0/0 | Gender + Tanner stage or age | Lumbar BMC, BA and BMD, femoral neck BMD |
| 22, 33 | 1996 | Hologic 2000 FB | 110/124 | 8–17 years (L) | 220/0/0/0/0 | Gender + age | Lumbar and total BMC and BMD |
| Femoral neck BMC and BMD | |||||||
| 40a | 1999 | Hologic 1000 PB | 193/230 | 9–25 years (L) | 103/114/103/103 | Gender + age + ethnicity | Lumbar, femoral neck, and total hip BMD and BMAD |
| Total BMD and BMC/Ht | |||||||
| 10 | 2004 | Hologic 4500 FB | 0/422 | 12–18 years | 153/264/0/0/5 | Age + weight + ethnicity | Lumbar and femoral neck BMD, femoral neck apparent BMD |
| 60b | 2001 | Hologic 2000 PB | 0/151 | 9–14 years (L) | 151/0/0/0/0 | Breast stage + age | Lumbar, femoral neck, trochanter and forearm BMC and BMD |
| 54 | 2003 | Lunar DPX PB | 210/249 | 3–30 years | 459/0/0/0/0 | Gender + height or age | Total lean body mass and total BMC/lean body mass |
aFurther data available at http://www.stat-class.stanford.edu/pediatric-bones
bFurther data available at http://www.bcm.edu/bodycomplab
As with any other radiologic study, a methodical evaluation of the results should be undertaken in order to minimize the risk of misdiagnosis. The radiologist needs to review all input data, including patient age, gender, ethnicity, weight, height, and Tanner stage (if provided). Patient positioning should be evaluated, and the ROIs need to be analyzed for artifact and appropriateness. Comparison should be made with previous studies to ensure consistency of positioning and ROI selection. In addition, changes in patient height, weight, and Tanner stage should be noted. After these steps have been taken, interpretation of the numeric result is performed. An appropriate database for comparison purposes is selected. Ideally, this is based on data generated locally using the same equipment and technologists, but this is rarely possible. Normative data provided by the DXA manufacturers can be used, but historically these datasets do not include the parameters currently thought to be most important for interpretation. At a minimum, patient body size (height and weight) and physiologic maturity (Tanner stage, gynecologic or bone age) should be factors included in the normative dataset. Ethnicity and gender are also frequently included in the generation of normative data and are generally thought to affect BMD significantly. Table 2 summarizes a large number of normal databases that can be used to best match the patient scan to be analyzed.
More complex and scientifically rigorous analyses of the BMD result have been suggested. Molgaard et al. [46] described a three-step analysis of BMD. Bone length is categorized as short or long by assessing the patient’s height for age. Height is highly correlated with BMC [12] and thus needs to be accounted for, especially when BMD Z-score is abnormal (Z=±2). Bone width is categorized as thin or thick by assessing BMC for height. Last, bone mineralization is categorized with assessment of BMC for BA. The first step takes into account height because of its profound effect on BMC; taller children will have a higher bone content. However, bone width is also important in determining bone content, thus the second step accounts for this. The last step is often the only step performed by many radiologists with reporting of BMC for BA which, by definition, is BMD. Height for age can be assessed using standard growth charts corrected for age, gender, and ethnicity. Percentile rankings can be easily converted to a Z-score [47]. Bone area for height tables are available for select groups, but normative data for all pediatric patients need to be developed. Using this three-step analysis, Molgaard and Michaelsen [48] found that the causes for low BMC might be various combinations of factors such as short stature and thin bones, as in children with cystic fibrosis, or short stature and reduced mineralization, as in children with milk allergy. BMC might be normal despite short stature in the presence of wide bones, as in children with previously treated leukemia.
In summary, an abnormal BMD Z-score should lead to evaluation of confounding patient factors that influence BMD, including height, weight, and physiologic maturity, before a diagnosis of low bone density is made. Until the manufacturers’ databases sufficiently account for the physiologic factors that most impact BMD results, normative data derived locally or from the medical literature should be used in pediatric DXA interpretation. The report should include the DXA equipment and software algorithm used (pediatric or adult, low bone density or standard), the source of the normative reference data, the Z-score (not the T-score), and an impression giving a clinical context for the result. The diagnosis of “low bone density” does not rest solely on the DXA numeric result, and the report should indicate which patient factors were incorporated into the final impression. A specimen DXA report and the examination protocol from Columbus Children’s Hospital are given in Appendix.
Bone growth over time and changes in BMD
As mentioned previously, bone size affects the DXA aBMD result. Changes in bone size over time, as occur in normal pediatric development, confound DXA interpretation. This is one of the major limitations in the use of pediatric DXA. On both follow-up studies, when the child’s data are compared to prior results, as well as when the child’s DXA values are compared to normative values, the effect of bone size needs to be accounted for. These problems could be avoided, at least in part, if a true volumetric BMD were available with DXA. As this is not possible with current DXA technology, investigators have attempted to account for the effect of bone volume on the DXA result and minimize the effect the growing skeleton has on the BMD value [49]. Katzman et al. [50] estimated the volume of the lumbar vertebral bodies, assuming it to be a cube, using this formula: apparent lumbar BMD (BMAD) = BMC/BA1.5. Kroger et al. [51] suggested a volumetric correction based on the assumption that the vertebral body is a cylinder using this formula: BMAD=(BMC)(4/[π{bone width}]). This correction can also be applied to the femoral shaft and neck [52]. These corrections do not fully account for changes over time in lumbar BMD but do eliminate age and height dependence of BMD at the hip. A different approach has been to not evaluate BMD at all, but to measure BMC only, because it is determined with greater accuracy and precision than BMD [53]. In an effort to incorporate the fundamental relationship between the mechanical stress a bone experiences through muscle action and its mineral content, Hogler et al. [54] and Crabtree et al. [55] used DXA to assess BMC and proposed algorithms that focus on the evaluation of lean total body mass (LTM) with respect to height and BMC. They found LTM explains greater than 95% of the variation in total body BMC in boys and girls. By incorporating LTM/height and height/age into the DXA interpretation, patients could be grouped as being normal or having a primary, secondary or mixed bone defect. For example, the diagnosis of low BMD for age might be a result of smaller bones and not osteopenia. Hogler et al. [54] found children with growth hormone deficiency to be short for their age (low height/age ratio) but to have a normal amount of bone adaptation (BMC) for the muscle force (LTM). The BMC/LTM ratio for these children is normal. In contrast, children with anorexia nervosa with normal height had low LTM and also low BMC/LTM ratios. Their low BMD for age was a result of decreased muscle loading on bone (a secondary bone defect with low LTM/height) and decreased mineralization for the level of muscle loading present (a primary defect with low BMC/LTM). This indicated that a mixed defect caused their low BMD for their age.
In summary, smaller bones will have lower aBMD than larger bones as measured with DXA, even when the vBMD is the same because of limitations of the areal bone density technique. Attempts to correct for or to circumvent this limitation have been proposed and show promise in improving DXA interpretation and our understanding of bone physiology.
Clinical case studies
The following case studies are examples of common clinical indications for DXA in pediatrics and illustrate the principles used at Columbus Children’s Hospital in DXA interpretation.
Patient 1 was a 4-year-old white female with nutritional rickets and multiple fractures following minimal trauma. She presented for a baseline study and was Tanner stage 1 and weighed 19 kg. Her lumbar BMD was 0.399 g/cm2. Using our normal database that corrects for Tanner stage and weight [35], the patient’s lumbar BMD was far below the first percentile (Z-score was much less than −2.3). The manufacturer’s database (which is based in part on the data from reference 35) yielded a Z-score of −2.1. The total body BMC was 543 g with a Z-score of −2.3 [43]. The patient was reported as having markedly reduced lumbar bone density and reduced total body BMC.
Patient 2 was a 13-year-old black female with lupus. On baseline DXA the lumbar BMD was 0.719 g/cm2, equivalent to a Z-score of 1.6 using our local database and was considered to be a high normal value for a 33-kg and Tanner stage 1 patient. The total body BMC was 1280 g, equivalent to a Z-score of 1.5 [43], and was also thought to be a high normal value. During the next 15 months, she was treated with corticosteroids and gained 15 kg and progressed to Tanner stage 2. On follow-up DXA the lumbar BMD was 0.723 g/cm2. This value corresponds to the 25th percentile and a Z-score of −0.67 [35]. Thus, she had a slight decrease in her lumbar BMD value at a time when rapid bone mineral accrual would be expected [21]. This was made evident by the rather marked decrease in her Z-score, from 1.5 to −0.67. Her total body BMC was unchanged, but the Z-scores also decreased substantially.
Patient 3 was a 16-year-old white female with Turner syndrome and of small stature (150 cm, first percentile, Z-score −2.3). Her lumbar BMD was 0.641 g/cm2, equivalent to the eighth percentile (Z-score −1.3) for Tanner stage 3 and weight 50 kg [43]. It should be noted that the manufacturer’s normal database yielded a lumbar BMD Z-score of −3.0, but it did not take into account height or weight. The low lumbar BMD Z-score was likely a result of the patient’s short stature (low height Z-score). The weight correction in our normal database partially accounted for her short stature and gave a more meaningful interpretation of the numeric DXA result. This patient’s bone age was 13 years (Z-score −2.3), and using this rather than her chronologic age (16 years) with the manufacturer’s normal database would result in a Z-score of −1.0. This value would better reflect the patient’s actual bone status. Because our database corrects for weight and Tanner stage, each patient is weighed and has a Tanner stage determination made by the referring clinician prior to the DXA study. Thus, we do not use the patient’s bone age in DXA interpretation.
Final recommendations
Pediatric radiologists need to assume a more prominent role in DXA performance, interpretation and research. They require expertise with DXA as a laboratory procedure, a numeric result, and a clinical diagnostic examination. The radiologist must be a “clinical pathologist” closely supervising the acquisition of the DXA study with assessment of quality control data as well as the clinical images. The radiologist must be a “statistician” understanding the principles of least significant change and the relationship of standard deviation scores and percentile rankings. The radiologist must also be a “bone specialist” providing a meaningful context for DXA, translating the numeric value to a clinically useful result. As always, pediatric radiologists must be children’s health advocates by ensuring the appropriate clinical use of DXA as well as actively participating in research efforts.
Appendix
Columbus Children’s Hospital DXA examination
The typical scan includes the lumbar spine and total body for all patients. For children younger than 12 years, the hip is not scanned because of a lack of well-controlled norms. The manufacturer’s provided normative database extends down to 4 years of age. However, by correcting only for age, gender and ethnicity, it does not adequately account for patient factors for our clinicians. For patients with an increased risk of vertebral compression fracture, such as those with osteogenesis imperfecta, a vertebral morphologic assessment is performed with the lateral scanogram. The normative data used for comparison are from references 32 (lumbar spine), 10 (female adolescent hip) and 43 (total body BMC). For children weighing less than 10 kg, reference 25 is used for the lumbar spine comparison. Results are given in terms of percentiles [10, 32] and can be converted to Z-scores [47].
The final impression indicates whether the sites measured have normal BMD or whether the values are greater than two standard deviations from the mean compared to the appropriate database and corrected for relevant patient factors. If the results are greater than two standard deviations below the mean, the phrase “low bone density” is used. Comparison with previous studies is made, and changes greater than 5% are reported as significant. (A previous repeated measures study for the lumbar spine and hip at Columbus Children’s Hospital found a standard error of measurement of less than 1% for the lumbar spine and 2% for the total hip.)
Sample DXA report
Utilizing the Hologic Delphi technique and pediatric software analysis, regions of interests were drawn about L1–L4, the total left hip, and the total body. The patient is Tanner stage _ and weighs _ kg. The bone mineral density of the lumbar spine is _ g/cm2. Utilizing the locally derived database that accounts for Tanner stage and weight, the patient’s value corresponds to the _th percentile.
The bone mineral density of the total left hip is _ g/cm2. (The following sentence is inserted for female patients Tanner IV or V: Utilizing normative data from the literature that accounts for weight, age and ethnicity, the patient’s value corresponds to the _th percentile.)
The total body bone mineral content is _ g. This is _____ (insert one of the following: near the mean, above or below the mean but within normal limits, or greater than two standard deviations above or below the mean) when compared to normative data from the literature.
The patient has _% body fat.
References
- 1.Lentle BC, Prior JC (2003) Osteoporosis: what a clinician expects to learn from a patient’s bone density examination. Radiology 228:620–628 [DOI] [PubMed]
- 2.Bonnick SL, Johnston CC Jr, Kleerekoper M, et al (2001) Importance of precision in bone density measurements. J Clin Densitom 4:105–110 [DOI] [PubMed]
- 3.The Writing Group for the ISCD (2004) Position Development Conference. Diagnosis of osteoporosis in men, premenopausal women, and children. J Clin Densitom 7:17–26 [DOI] [PubMed]
- 4.Bachrach LK (2000) Dual energy X-ray absorptiometry (DEXA) measurements of bone density and body composition: promise and pitfalls. J Pediatr Endocrinol Metab 13:983–988 [PubMed]
- 5.Carter DR, Bouxsein ML, Marcus R (1992) New approaches for interpreting projected bone densitometry data. J Bone Miner Res 7:137–145 [DOI] [PubMed]
- 6.Hammami M, Koo WW, Hockman EM (2004) Technical considerations for fan-beam dual-energy X-ray absorptiometry body composition measurements in pediatric studies. J Parenter Enteral Nutr 28:328–333 [DOI] [PubMed]
- 7.Leonard MB, Feldman HI, Zemel BS, et al (1998) Evaluation of low density spine software for the assessment of bone mineral density in children. J Bone Miner Res 13:1687–1690 [DOI] [PubMed]
- 8.Cheng S, Nicholson PH, Kroger H, et al (2005) Differences in estimates of change of bone accrual and body composition in children because of scan mode selection with the prodigy densitometer. J Clin Densitom 8:65–73 [DOI] [PubMed]
- 9.Simpson DE, Dontu VS, Stephens SE, et al (2005) Large variations occur in bone density measurements of children when using different software. Nucl Med Commun 26:483–487 [DOI] [PubMed]
- 10.Cromer BA, Binkovitz L, Ziegler J, et al (2004) Reference values for bone mineral density in 12- to 18-year-old girls categorized by weight, race, and age. Pediatr Radiol 34:787–792 [DOI] [PubMed]
- 11.Henderson RC (1997) The correlation between dual-energy X-ray absorptiometry measures of bone density in the proximal femur and lumbar spine of children. Skeletal Radiol 26:544–547 [DOI] [PubMed]
- 12.Ellis KJ, Shypailo RJ, Hardin DS, et al (2001) Z score prediction model for assessment of bone mineral content in pediatric diseases. J Bone Miner Res 16:1658–1664 [DOI] [PubMed]
- 13.Makitie O, Doria AS, Henriques F, et al (2005) Radiographic vertebral morphology: a diagnostic tool in pediatric osteoporosis. J Pediatr 146:395–401 [DOI] [PubMed]
- 14.National Osteoporosis Society (2004) A practical guide to bone densitometry in children. National Osteoporosis Society, Camerton, Bath, UK
- 15.Wahner HW, Fogelman I (1994) The evaluation of osteoporosis: dual energy X-ray absorptiometry in clinical practice. Martin Dunitz, Cambridge
- 16.Ho CP, Kim RW, Schaffler MB, et al (1990) Accuracy of dual-energy radiographic absorptiometry of the lumbar spine: cadaver study. Radiology 176:171–173 [DOI] [PubMed]
- 17.Koo WWK, Walters J, Bush AJ (1995) Technical considerations of dual-energy X-ray absorptiometry-based bone mineral measurements for pediatric studies. J Bone Miner Res 10:1998–2004 [DOI] [PubMed]
- 18.Margulies L, Horlick M, Thornton JC, et al (2005) Reproducibility of pediatric whole body bone and body composition measures by dual-energy X-ray absorptiometry using the GE lunar prodigy. J Clin Densitom 8:298–304 [DOI] [PubMed]
- 19.Glastre C, Braillon P, David L, et al (1990) Measurement of bone mineral content of the lumbar spine by dual energy X-ray absorptiometry in normal children: correlations with growth parameters. J Clin Endocrinol Metab 70:1330–1333 [DOI] [PubMed]
- 20.McCormick DP, Ponder SW, Fawcett HD, et al (1991) Spinal bone mineral density in 335 normal and obese children and adolescents: evidence for ethnic and sex differences. J Bone Miner Res 6:507–513 [DOI] [PubMed]
- 21.Bonjour JP, Theintz G, Buchs B, et al (1991) Critical years and stages of puberty for spinal and femoral bone mass accumulation during adolescence. J Clin Endocrinol Metab 73:555–563 [DOI] [PubMed]
- 22.Faulkner RA, Bailey DA, Drinkwater DT, et al (1993) Regional and total body bone mineral content, bone mineral density, and total body tissue composition in children 8–16 years of age. Calcif Tissue Int 53:7–12 [DOI] [PubMed]
- 23.Sabatier JP, Guaydier-Souquieres G, Benmalek A, et al (1999) Evolution of lumbar bone mineral content during adolescence and adulthood: a longitudinal study in 395 healthy females 10–24 years of age and 206 premenopausal women. Osteoporos Int 9:476–482 [DOI] [PubMed]
- 24.Barden HS, Mazess RB (1988) Bone densitometry in infants. J Pediatr 113:172–177 [DOI] [PubMed]
- 25.Salle BL, Braillon P, Glorieux FH, et al (1992) Lumbar bone mineral content measured by dual energy X-ray absorptiometry in newborns and infants. Acta Paediatr 81:953–958 [DOI] [PubMed]
- 26.Braillon PM, Salle BL, Brunet J, et al (1992) Dual energy X-ray absorptiometry measurement of bone mineral content in newborns: validation of the technique. Pediatr Res 32:77–80 [DOI] [PubMed]
- 27.Brunton JA, Bayley HS, Atkinson SA (1993) Validation and application of dual-energy X-ray absorptiometry to measure bone mass and body composition in small infants. Am J Clin Nutr 58:839–845 [DOI] [PubMed]
- 28.Koo WWK, Massom LR, Walters J (1995) Validation of accuracy and precision of dual energy X-ray absorptiometry for infants. J Bone Miner Res 10:1111–1115 [DOI] [PubMed]
- 29.Koo WWK, Walters J, Bush AJ, et al (1996) Dual-energy X-ray absorptiometry studies of bone mineral status in newborn infants. J Bone Miner Res 11:997–1002 [DOI] [PubMed]
- 30.National Institutes of Health(2000) Osteoporosis prevention, diagnosis, and therapy. Consensus Development Conference Statement27–29 March. National Institutes of Health, Bethesda, MD http://consensus.nih.gov/2000/2000Osteoporosis111html.htm
- 31.American College of Rheumatology (2005) Practice guidelines. American College of Rheumatology, Atlanta, GA http://www.rheumatology.org/publications/guidelines/index.asp?aud=mem
- 32.American College of Radiology (2006) ACR appropriateness criteria. Osteoporosis and bone mineral density. American College of Radiology, Reston, VA http://www.acr.org/s_acr/bin.asp?TrackID=&SID=1&DID=11796&CID=1206&VID=2&DOC=File.PDF
- 33.Faulkner RA, Bailey DA, Drinkwater DT, et al (1996) The densitometry in Canadian children 8–17 years of age. Calcif Tissue Int 59:344–351 [DOI] [PubMed]
- 34.Sabatier JP, Guaydier-Souquieres G, Laroche D, et al (1996) Bone mineral acquisition during adolescence and early adulthood: a study in 574 healthy females 10–24 years of age. Osteoporos Int 6:141–148 [DOI] [PubMed]
- 35.Southard RN, Morris JD, Mahan JD, et al (1991) Bone mass in healthy children: measurement with quantitative DXA. Radiology 179:735–738 [DOI] [PubMed]
- 36.Gilsanz V, Skaggs DL, Kovanlikaya A, et al (1998) Differential effect of race on the axial and appendicular skeletons of children. J Clin Endocrinol Metab 83:1420–1427 [DOI] [PubMed]
- 37.Molgaard C, Thomsen BL, Michaelsen KF (1998) Influence of weight, age and puberty on bone size and bone mineral content in healthy children and adolescents. Acta Paediatr 87:494–499 [DOI] [PubMed]
- 38.Li JY, Specker BL, Ho ML, et al (1989) Bone mineral content in black and white children 1 to 6 years of age. Am J Dis Child 143:1346–1349 [DOI] [PubMed]
- 39.Nelson DA, Simpson PM, Johnson CC, et al (1997) The accumulation of whole body skeletal mass in third- and fourth-grade children: effects of age, gender, ethnicity, and body composition. Bone 20:73–78 [DOI] [PubMed]
- 40.Bachrach LK, Hastie T, Wang MC, et al (1999) Bone mineral acquisition in healthy Asian, Hispanic, black, and Caucasian youth: a longitudinal study. J Clin Endocrinol Metab 84:4702–4712 [DOI] [PubMed]
- 41.Wang MC, Aguirre M, Bhudhikanok GS, et al (1997) Bone mass and hip axis length in healthy Asian, black, Hispanic, and white American youths. J Bone Miner Res 12:1922–1935 [DOI] [PubMed]
- 42.Ettinger B, Sidney S, Cummings SR, et al (1997) Racial differences in bone density between young adult black and white subjects persist after adjustment for anthropometric, lifestyle, and biochemical differences. J Clin Endocrinol Metab 82:429–434 [DOI] [PubMed]
- 43.Leonard MB, Propert KJ, Zemel BS, et al (1999) Discrepancies in pediatric bone mineral density reference data: potential for misdiagnosis of osteopenia. J Pediatr 135:182–188 [DOI] [PubMed]
- 44.Whyte MP, Wenkert D, Clements KL, et al (2003) Bisphosphonate-induced osteopetrosis. N Engl J Med 349:457–463 [DOI] [PubMed]
- 45.Gafni RI, Baron J (2004) Overdiagnosis of osteoporosis in children due to misinterpretation of dual-energy X-ray absorptiometry (DEXA). J Pediatr 144:253–257 [DOI] [PubMed]
- 46.Molgaard C, Thomsen BL, Prentice A, et al (1997) Whole body bone mineral content in healthy children and adolescents. Arch Dis Child 76:9–15 [DOI] [PMC free article] [PubMed]
- 47.Gravetter FJ, Wallnau LB (2000) Statistics for the behavioral sciences (5th edn). Wadsworth, Stamford, pp 690–692
- 48.Molgaard C, Michaelsen KF (2005) Evaluation of whole body DXA scans in children. Bone 36 (S1):S73–74
- 49.Fewtrell MS, Gordon I, Biassoni L, et al (2005) Dual X-ray absorptiometry (DXA) of the lumbar spine in a clinical paediatric setting: does the method of size-adjustment matter? Bone 37:413–419 [DOI] [PubMed]
- 50.Katzman DK, Bachrach LK, Carter DR, et al (1991) Clinical and anthropometric correlates of bone mineral acquisition in healthy adolescent girls. J Clin Endocrinol Metab 73:1332–1339 [DOI] [PubMed]
- 51.Kroger H, Kotaniemi A, Vainio P, et al (1992) Bone densitometry of the spine and femur in children by dual-energy X-ray absorptiometry. Bone Miner 17:75–85 [DOI] [PubMed]
- 52.Lu PW, Cowell CT, Lloyd-Jones SA, et al (1996) Volumetric bone mineral density in normal subjects, aged 5–27 years. J Clin Endocrinol Metab 81:1586–1590 [DOI] [PubMed]
- 53.Wren TAL, Liu X, Pitukcheewanont P, et al (2005) Bone acquisition in healthy children and adolescents: comparisons of dual-energy X-ray absorptiometry and computed tomography measures. J Clin Endocrinol Metab 90:1925–1928 [DOI] [PubMed]
- 54.Hogler W, Briody J, Woodhead HJ, et al (2003) Importance of lean mass in the interpretation of total body densitometry in children and adolescents. J Pediatr 143:81–88 [DOI] [PubMed]
- 55.Crabtree NJ, Kibirige MS, Fordham JN, et al (2004) The relationship between lean body mass and bone mineral content in paediatric health and disease. Bone 35:965–972 [DOI] [PubMed]
- 56.Ponder SW, McCormick DP, Fawcett HD, et al (1990) Spinal bone mineral density in children aged 5.00 through 11.99 years. Am J Dis Child 144:1346–1348 [DOI] [PubMed]
- 57.Rico H, Revilla LF, Villa ER, et al (1993) Body composition in children and Tanner’s stages: a study with dual-energy X-ray absorptiometry. Metabolism 42:967–970 [DOI] [PubMed]
- 58.van der Sluis IM, de Ridder MAJ, Boot AM, et al (2002) Reference data for bone density and body composition measured with dual energy X-ray absorptiometry in white children and young adults. Arch Dis Child 87:341–347 [DOI] [PMC free article] [PubMed]
- 59.Boot AM, Bouquet J, de Ridder MAJ, et al (1997) Determinants of body composition measured by dual-energy X-ray absorptiometry in Dutch children and adolescents. Am J Clin Nutr 66:232–238 [DOI] [PubMed]
- 60.van Coeverden SCCM, de Ridder CM, Roos JC, et al (2001) Pubertal maturation characteristics and the rate of bone mass development longitudinally toward menarche. J Bone Miner Res 16:774–778 [DOI] [PubMed]
- 61.Kelly TL, Specker BL, Binkely T, et al (2005) Pediatric BMD reference database for US white children. Bone (Suppl) 36(O-15):S30
- 62.Binkley TL, Specker BL, Wittig TA (2002) Centile curves for bone densitometry measurements in healthy males and females ages 5–22 yr. J Clin Densitom 5:343–353 [DOI] [PubMed]