

Abstract
Studies using fear-conditioning paradigms have found that anxiety patients are more conditionable than individuals without these disorders, but these effects have been demonstrated inconsistently. It is unclear whether these findings have etiological significance, or whether enhanced conditionability is linked only to certain anxiety characteristics. To further examine these issues, we assessed the predictive significance of relevant subsyndromal characteristics in 72 healthy adults, including measures of worry, avoidance, anxious mood, depressed mood, and fears of anxiety symptoms (anxiety sensitivity), as well as the dimensions of neuroticism and extraversion. Of these variables, we found that the combination of higher levels of subsyndromal worry and lower levels of behavioral avoidance predicted heightened conditionability, raising questions about the etiological significance of these variables in the acquisition or maintenance of anxiety disorders. In contrast, we found that anxiety sensitivity was more linked to individual differences in orienting response than differences in conditioning per se.
Keywords: Fear conditioning, etiology, worry, avoidance, anxiety sensitivity, psychophysiology
Prediction of “Fear” Acquisition in Healthy Control Participants in a De Novo Fear-Conditioning Paradigm
Differences in fear conditionability—the ease by which new fear associations are learned or maintained—is a potential etiological factor for the development of anxiety disorders. Individuals who easily acquire fears to negative stimuli might be at greater risk for developing anxiety disorders in response to panic attacks, anxiety-provoking social situations, traumatic events, or, in the case of specific phobias, exposure to stimuli such as snakes or spiders. At present, there is encouraging evidence for heightened conditionability in anxiety patients relative to healthy control samples (e.g., Grillon & Morgan, 1999; Orr et al., 2000; Pitman & Orr, 1986; Thayer, Friedman, Borkovec, Johnsen, & Molina, 2000), but the implications of these findings for the etiology of anxiety disorders have not been elucidated, and inconsistent findings in the literature have not been adequately addressed.
In these conditioning studies, a stimulus is associated with a mildly-aversive unconditioned stimulus (UCS; e.g., an annoying but not painful shock) during acquisition trials. Autonomic responses, commonly skin conductance response (SCR) or heart rate, are used to measure anticipation of the UCS, and are informally referred to as representing the acquired or “conditioned fear” response to the conditioned stimulus (CS).
Conditioned fear responses in humans have been assessed primarily with two different conditioning paradigms. In the first of these procedures, researchers have used the average SCR to a single, repeatedly-presented CS during acquisition as an index of conditioning. This approach, referred to as simple conditioning, has yielded moderate (d = .42) and fairly reliable effect sizes indicating greater conditionability for anxiety patients relative to healthy control participants (Lissek et al., 2005). However, the use of a single stimulus has important weaknesses, including the inability to assess the specificity of the fear response to the CS; responses to the CS could reflect a generalized increase in reactivity to the “threatening” context and/or to any stimulus presented within that context.
A second approach for the assessment of conditioning has been to measure the difference between the response to a cue that signals the UCS (designated as the CS+) and the response to a second cue that is not paired with the UCS (designated as the CS-). This method assesses the differential learning of “fear” and “safety” to the CS+ and CS-, respectively, where the magnitude of conditioning may depend as much on the acquisition of a “safety” response in relation to the CS- as the learning of “fear” responses to the CS+. As suggested by Lissek et al. (2005), this measure has the advantage of controlling for non-specific reactivity, as would be reflected by large SCRs to both CS+ and CS-. Research using a differential conditioning paradigm has produced widely inconsistent findings, with effect sizes for comparisons between anxious and non-anxious samples ranging from d = −.91 to +1.03, according to meta-analytic review (Lissek et al., 2005); the average effect size across studies was d = .08.
Although these studies differ in the specific dependent variable used (e.g., assessment of heart rate vs. SCR), Lissek et al. (2005) concluded that this source of variation was an unlikely candidate for explaining the heterogeneity in results. An alternative hypothesis is that these inconsistent findings are a result of heterogeneous participant characteristics within the samples studied. Indeed, conditioning studies have sampled a range of anxiety disorders (e.g., generalized anxiety disorder, posttraumatic stress disorder, social phobia, and panic disorder), and effect sizes vary widely both between and within these diagnostic groups. Among these varied samples, conditionability may be linked to a particular feature of anxiety conditions (e.g., tendencies toward avoidance or worry, or degree of mood disruption) rather than representing a general characteristic of clinical anxiety. Moreover, this more-detailed accounting of the link between features of anxiety disorders and conditionability helps underscore questions of etiology. Specifically, do differences in conditionability between clinically anxious and non-anxious samples simply reflect a state characteristic of anxious mood, rather than pre-existing traits that may have led to the disorder in the first place?
Questions of etiology are best addressed by large-scale longitudinal studies, but a relevant starting point for such investigations is the examination of the correlates of conditioning outcomes in individuals who do not currently have anxiety disorders. Specifically, studying individuals who are free of anxiety and mood disorders allows for the examination of variables that may influence fear conditioning in the absence of clinical psychopathology. Although this approach is likely to be disadvantaged by a limited range of scores on symptom measures, it has the advantage of revealing findings for sub-clinical characteristics that may have a role in the development of anxiety disorders. In addition, this approach may be useful for foretelling the characteristics of clinical and non-clinical samples (e.g., tendencies toward worry or depressed mood) that may influence the degree of conditionability in any one sample, and thereby help explain inconsistent findings of differences in conditionability between anxiety patients and controls.
In the present study, we focused on individual differences in conditionability among adults free of anxiety and mood disorders. As predictors, we evaluated a variety of characteristics relevant to the etiology or maintenance of anxiety disorders, including measures of worry frequency, behavioral avoidance, anxious mood, depressed mood, and fears of anxiety symptoms (anxiety sensitivity). We also evaluated measures of neuroticism and extraversion, given longstanding hypotheses about the role of these traits in the development and maintenance of anxiety and phobic responses (e.g., Eysenck, 1979, see also Pitman & Orr, 1986). Any one of these variables may be responsible for the link between anxiety disorders and conditionability; hence, our study is exploratory in nature, and is designed to examine which of these variables are linked most strongly with conditioning outcomes. Because these variables tend to be inter-correlated (e.g., Freeston et al., 1996; Jain, Blais, Otto, Hirshfeld, & Sachs, 1999; Otto, Pollack, Fava, Uccello, & Rosenbaum, 1995; Steer Beck, Riskind, & Brown, 1986), we used multiple regression procedures to study the non-redundant predictability afforded by consideration of these variables.
Of primary importance was identification of predictors of the degree of differential conditioning (difference in responding to the CS+ and CS-). In addition, because of the variable findings between simple and differential conditioning paradigms (Lissek et al., 2005), we also sought to clarify the meaning of associations between predictors and conditioning outcomes by examining predictors of the elements of conditioned responses, including: (1) orienting responses to the first presentation of the CSs during the habituation phase prior to the conditioning trials, (2) responsivity to the UCS, and (3) responsivity to the CS+ without consideration of the CS-. This lattermost measure is of interest because it is potentially contaminated by the orienting response to any stimulus appearing during the acquisition phase. We refer to this responsivity to the CS+ during acquisition as a measure of “general” as compared to the better controlled “differential conditioning” measure that evaluates responsivity to the CS+ relative to the CS-.
Methods
Participants
Seventy-three participants (37 men and 36 women) were recruited through advertisements at a local university and within the community. Inclusion criteria required participants to be 18 to 64 years of age, free of serious medical conditions, and not currently taking psychotropic medication. Diagnostic exclusion criteria included current pregnancy and the presence of any past or present DSM-IV mood, anxiety, psychotic, eating or substance use disorders (other than nicotine) as determined by Structured Clinical Interview for DSM-IV (SCID-IV; First, Spitzer, Gibbon, & Williams, 1996).
Of the 73 participants, 61 identified themselves as White, 2 Asian, 2 White Hispanic, 2 Black non-Hispanic, 1 American Indian, 1 Hawaiian, and 4 unknown, other, or unspecified. Age data were not obtained for 9 of the 73 participants. The mean age of the remaining 64 participants was 27 years with a range of 18–57.
Failure to show an average SCR greater than 0.1 μSiemens to the five presentations of the UCS was used as an indicator of physiologic non-responsiveness. Because an individual who fails to demonstrate a measurable unconditioned response also would be expected not to show a conditioned response, physiologic non-responders were excluded from all analyses (n=1). Only individuals who completed the conditioning study and for whom all predictor variables were available were included the analyses (N = 72).
Predictor Measures
Predictor variables included self-report measures of various dimensions of anxiety-related symptoms and personality characteristics including, anxiety sensitivity, anxious mood, depressed mood, worry, behavioral avoidance, and the dimensions of neuroticism and extraversion. These characteristics are represented to varying degrees in individuals with anxiety disorders, and, as noted below, are also valid targets for assessment in healthy populations. These characteristics were assessed with the following questionnaires.
Anxiety Sensitivity Index (ASI; Reiss, Peterson, Gursky, & McNally, 1986)
The Anxiety Sensitivity Index is a 16-item self-report questionnaire that assesses fear of anxiety sensations. Each item is rated on a five-point Likert scale, and the total of these items serves as the primary score. High ASI scores (e.g., in the mid 30s) characterize panic disorder and PTSD, with moderate scores for patients with major depression or other anxiety disorders (Taylor, Koch, & McNally, 1992; Otto et al., 1995). Moreover, ASI scores have been shown to have good reliability and validity in adult samples (Peterson & Reiss, 1992), and in healthy adults have been supported as a risk factor for the development of panic attacks (Schmidt, Lerew, & Jackson, 1997) and anxiety and panic disorders (Schmidt, Zvolensky, & Maner, in press; see also Gardenswartz & Craske, 2001).
Beck Anxiety Inventory (BAI; Beck, Epstein, Brown, & Steer, 1990)
The BAI is a commonly used 21-item self-report inventory designed to measure severity of anxiety symptoms. The internal consistency and concurrent validity of the BAI are adequate (Beck & Steer, 1990). The BAI was selected as a measure of general anxiety to examine the influence of this state characteristic on conditioning outcomes.
Beck Depression Inventory (BDI; Beck, Ward, Mendelson, Mock, & Erbaugh, 1961.; Beck & Steer, 1987)
The BDI is a widely used 21-item self-report inventory designed to measure severity of depressive symptoms. The internal consistency of the BDI is strong and it has been found to have good concurrent validity (Beck & Steer, 1987). The BDI was selected as a measure of depressed mood to examine the influence of this state characteristic relevant to both healthy samples and patients with anxiety disorders.
Penn State Worry Questionnaire (PSWQ; Meyer, Miller, Metzger, & Borkovec, 1990)
The PSWQ is a 16-item, self-report measure of worry. Items are rated on a five-point Likert scale, and are summed to form a total score ranging from 16 to 80. Previous large-sample research indicates mean PSWQ scores in the mid sixties for GAD, mid 50s for other anxiety disorders and major depression, and low 40s for health control participants (Chelminski & Zimmerman, 2003). The PSWQ has excellent psychometric properties in student, community, and clinical samples (Brown, Anthony, & Barlow, 1992; Molina & Borkovec, 1994; van Rijsoort, Emmelkamp, & Vervaeke, 1999). Accordingly, this measure is appropriate for use in both healthy and clinical samples. For this study, the potential importance of worry is underscored by findings indicating that cognitive rehearsal of aversive stimuli can influence conditioning outcomes (Jones & Davey, 1990).
Fear Questionnaire (FQ; Marks & Mathews, 1979)
The FQ is a 15-item questionnaire with 3 subscales: Agoraphobia, Social Phobia, and Blood/Injury Phobia. The FQ is self-administered, with items rated according to a 9-point Likert scale. The sum of the items provides a total phobia score. The FQ is a valid and reliable index of behavioral avoidance in clinical studies (Marks & Mathews, 1979; Mavissakalian, 1986; Oei, Moylan & Evans, 1991), and has been found to be appropriate for use in healthy populations as well (Osman, Barrios, Osman, & Markway, 1993). Accordingly, the FQ serves as a general measure of avoidance, ubiquitous to the anxiety disorders, that also can be applied to healthy samples.
NEO-Five Factor Inventory (NEO-FFI; Costa & MacCrae, 1992)
The NEO-FFI is a 60-item, self-report instrument that provides an index of personality traits across five dimensions: Neuroticism, Extraversion (Introversion), Agreeableness, Conscientiousness, and Openness to Experience. Scoring keys are designed to transform scores into standardized T scores, with norm expectation for a mean of 50 and standard deviation of 10. Only the Neuroticism and Extraversion scores were used as predictors in the current study, given the importance of these measures to early accounts of fear conditioning (e.g., Eysenck, 1979).
Stimuli
The CS+ and CS- stimuli consisted of a yellow circle and a white square, respectively. The colored CSs were computer-generated and displayed on a monitor positioned 1.5m in front of the participant. The UCS was a 500 ms. electric shock delivered through electrodes attached to the second and third fingers of the dominant hand. The UCS was generated by a Coulbourn Transcutaneous Aversive Finger Stimulator (E13-22; designed for human conditioning research), which uses a 9-V dry cell battery attached to an adjustable step-up transformer. Shocks were intended to be "highly annoying but not painful,” and at the beginning of the testing session, each participant established shock levels appropriate to this description. Because the CS+ and CS- were not randomized across subjects, we evaluated whether either CS was associated with a stronger SCR during habituation; according to a t-test, there was no significant difference in the reaction of participants to the to-be-designated CS+ and CS- (p-value > 0.69).
Psychophysiological Assessment
Skin conductance was recorded using a Coulbourn Lablinc V, Human Measurement System and Coulbourn Isolated Skin Conductance coupler (V71-23); 9mm (sensor diameter) Invivo Metric Ag/AgCl electrodes were placed on the hypothenar surface of the subject's non-dominant hand in accordance with published guidelines (Fowles et al, 1981). The SC electrodes were separated by 14 mm, as determined by the width of the adhesive collar. The SC analog signal was digitized at 1000 Hz by a Coulbourn Lablinc Analog to Digital Converter (V19-16). An IBM-compatible computer system with custom designed software provided by Coulbourn Instruments Inc. was used to sample and store the digitized physiologic signals.
Study Procedures
All participants provided written informed consent, and then completed a diagnostic screening interview using the SCID-IV to assess for the presence or absence of anxiety and mood disorders, psychosis, mania, current substance use disorder (other than nicotine), suicidality, and homicidality. Screening questionnaires were used to ensure that participants were not taking psychotropic agents, and participants were asked to refrain from alcohol intake in the 24 hours prior to the session and from caffeine and nicotine intake in the two hours prior to the session. On the day of the study, participants were asked to complete a questionnaire packet consisting of the ASI, BAI, BDI, PSWQ, FQ and NEO-FFI. Subsequent physiological assessment was completed in a temperature-controlled, sound-attenuated room (connected via wires to an adjoining laboratory in which the experimental apparatus was located). The participant was seated in a comfortable armchair and monitored via an unobtrusive video camera. Physiologic recording electrodes and the aversive electric finger stimuli administering the shock (UCS) were attached. Prior to setting the UCS level the technician gave the following instructions:
For this experiment, you will set your own level of electric stimulation. You should choose a level that is highly annoying but not painful. I will start the stimulation at a very low level and gradually increase the level until you say stop. The level that you set will then be used throughout the remainder of the experiment.
After reading the instructions the technician then proceeded to set the UCS level, taking note of the final dial setting of the transformer (ranging between .2 and 4.0 milliamperes), which provided a measure of the UCS intensity selected by the participant. Once the UCS level was established, the participant was instructed to relax during a 5-min. baseline period, and received instructions about the upcoming phases of the study.
When the participant indicated they were ready to proceed, the technician left the room and activated the computer, which took over the administration of the experiment. There was a 5-min. baseline recording period during which SC level was sampled at 1000 Hz. Habituation (Phase I) consisted of five similar presentations, in pseudo-random order, of each (10 total presentations) of the stimuli that later served as the CS+ and CS-, i.e., there were no more than three consecutive presentations of the same stimulus type. The CS duration was 8 s, and the inter-trial interval 30 +/− 5 s, determined at random by the computer. Acquisition (Phase II) consisted of five presentations of each stimulus type; a 500-msec. shock pulse occurred immediately following each CS+ offset. For this procedure, the SC level was sampled at 1000 Hz, beginning 2 s prior to CS onset and ending 6 s following CS offset (6.5 s when the UCS was presented). Participants received monetary compensation for their time.
Data Reduction and Analysis
Physiological responses to the shock stimulus (UCRs) were calculated by subtracting the mean SC level for the 6–8 s interval following CS onset from the peak SC level within 6 s following offset of the UCS. SCRs to the CSs were measured in the 8 s interval (beginning at CS onset and ending at CS offset) for both the habituation and acquisition phases.1 SCRs for the CSs were calculated as the highest SC level during the 8-s CS interval, minus the mean SC level in the 2-s interval immediately preceding CS onset. Differential conditioning SCRs were calculated by subtracting the average SCR for the five CS- trials from the average SCR for the five CS+ trials. A larger differential SCR during the acquisition phase indicates greater fear conditioning. The averaged response for the five CS+ presentations during the acquisition phase, without consideration of the CS- presentations, served as the “general conditioning” measure.
Paired t-tests were used to evaluate the acquisition of a (fear) CR to the CS+ alone (general conditioning) as well as to the CS+ versus CS- (differential conditioning). In addition to these two measures of conditioning, we evaluated two measures of responsivity which may be related to general conditioning results: (1) magnitude of the SCR to the aversive electrical stimulus (UCR), and (2) magnitude of the SCR to the first presentations of the “to be” CSs during habituation (orienting response). We first examined the association between the predictors and each of these SCR measures using simple regression equations, and represented the results as Pearson correlation coefficients. With a sample size of 72, power to detect a moderate effect size (r = .3) as defined by Cohen (1988) was .72 for these analyses. We subsequently examined more-complex models of the general and differential conditioning outcomes in multiple regression analyses, evaluating which variables offered non-redundant prediction of these scores, and evaluating potential confounding relationships by examining relevant covariates (i.e., the impact of considering orienting-response magnitude on the prediction of conditioning outcomes).
Results
Conditioning Effects
For general conditioning, comparison of the mean reactivity to the CS+ during habituation and during acquisition revealed a significant increase in SCR magnitude (t 71 = 7.09, p < .0001). Likewise, for differential conditioning, comparison of the mean difference in reactivity to the CS+ and CS- during habituation and during acquisition revealed a significant increase in the differential SCR magnitude (t 71 = 6.89, p < .0001). These results are depicted in Figure 1.
Figure 1.
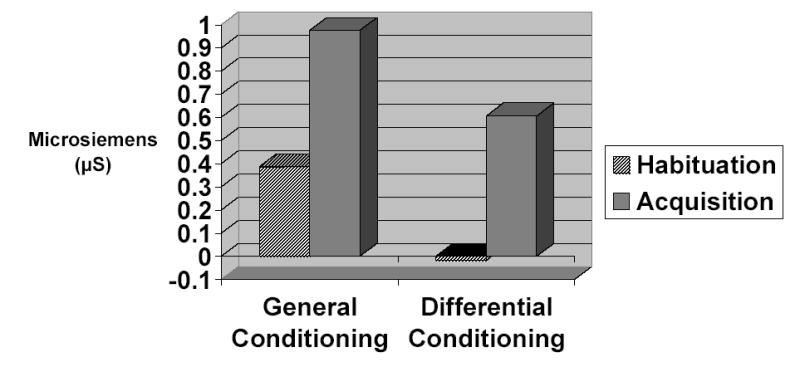
Acquisition of the conditioned response as illustrated by the difference between skin conductance between the habituation and acquisition phases as assessed by both the general and differential conditioning indices.
Prediction of Individual Differences in Conditioning Outcomes
Mean scores for each of the predictor variables are provided in Table 1. The sample was characterized by very low scores on all individual-difference symptom measures, and a mildly-lower, mean T score for Neuroticism and mildly-elevated, mean T score for Extraversion, consistent with the absence of current or lifetime affective disorders in this sample.
Table 1.
Mean value, standard deviation (SD), and correlation coefficients for each of the predictor variables with the conditioning-related variables for the 72 healthy participants.
| Measure | Mean (SD) | Range | UCR Pearson r | Orienting Response Pearson r | General Conditioning Pearson r | Differential Conditioning Pearson r |
|---|---|---|---|---|---|---|
| Anxiety Sensitivity Index | 10.6 (5.3) | 0–22 | .18 | .21 | .26 | .19 |
| Beck Anxiety Inventory | 3.2 (3.4) | 0–12 | .10 | −.04 | −.01 | .02 |
| Beck Depression Inventory | 1.9 (2.7) | 0–10 | .16 | −.05 | −.11 | −.15 |
| Fear Questionnaire Total Score | 10.4 (9.8) | 0–45 | .06 | −.14 | −.21 | −.23 |
| Penn State Worry Questionnaire | 36.5 (10.6) | 22–58 | .15 | .22 | .28 | .22 |
| NEO – Neuroticism t-score | 45.4 (8.0) | 32–67 | .16 | .24 | .16 | .09 |
| NEO – Extraversion t-score | 54.9 (12.8) | 24–76 | −.11 | −.05 | −.13 | −.16 |
Note: UCR refers to the average response to the electrical stimulus, i.e., the mean SC level for the 6–8 sec. interval following CS onset subtracted from the maximum SC level during the 6 sec. interval following offset of the UCS and averaged across five presentations.
Orienting response refers to the average response to the first presentation of the “to be” CSs during the habituation phase as defined by the mean SC level for the 2 sec. immediately preceding CS onset subtracted from the highest SC level during the 8-sec CS interval.
General conditioning refers to the average response to the CS+ (i.e., the CS that predicted the UCS during the acquisition phase); as defined by the mean SC level for the 2 sec. immediately preceding CS onset subtracted from the highest SC level during the 8-sec CS interval and averaged across the five CS+ presentations.
Differential conditioning refers to the average difference between the responses to the CS+ and responses to the CS-, as defined by the mean SC level for the 2 sec. immediately preceding CS onset subtracted from the highest SC level during the 8-sec CS interval, averaged across the five CS- presentations and subtracted from the averaged response to the five CS+ presentations.
Coefficients in bold are significant at p < .05.
Correlations between the predictor variables and the SCR outcomes (i.e., the UCR, orienting response, general conditioning, and differential conditioning SCRs) are presented in Table 1. Preliminary analyses indicated no significant associations between the levels of the electrical stimulus selected by participants and either the predictor variables or the conditioning outcomes, and likewise, as can be seen in Table 1, no significant associations were found between the predictor variables and the UCR magnitude. For the orienting response measure, a significant positive association with neuroticism was evident, but neuroticism was not significantly related to the measures of general and differential conditioning. Trends were evident toward positive associations between ASI and PSWQ scores, and the orienting response and two measures of conditioning, but the associations reached significance only with the measure of general conditioning. Trends were evident for negative associations between FQ scores and both general and differential conditioning SCRs, but reached significance only for differential conditioning.
Further evaluation of these associations with general conditioning SCRs using stepwise regression analyses indicated that ASI, PSWQ, and FQ scores provided non-redundant and significant prediction of the general conditioning SCR. PSWQ scores entered the model first (F 1, 70 = 6.14, p < .016), accounting for 8% of the variance in general conditioning SCR. FQ scores entered the model at the second step (F 1, 69 = 13.44, p < .001), accounting for an additional 15% of the variance in the general conditioning SCR. ASI entered at the final step, (F 1, 68 = 4.75, p < .033), accounting for an additional 5% of the variance in general conditioning SCR. Twenty-eight percent of the total variance in the general conditioning SCR was explained by the combination of ASI, PSWQ, and FQ scores.
Stepwise regression analysis suggested that the PSWQ and FQ also played a role in predicting the differential conditioning SCR. In this analysis, FQ total scores entered the model first (F 1, 70 = 3.99, p < .05), accounting for 5% of the variance. The PSWQ entered the model at the second and final step (F 1, 69 = 9.24, p < .004), accounting for an additional 14% of the variance in differential conditioning scores. No other variable provided significant prediction (see Table 2). Nineteen percent of the total variance in the differential conditioning SCR was explained by the combination of PSWQ and FQ scores.
Table 2.
Results of the stepwise multiple regression analyses of general and differential conditioning.
| General Conditioning | Differential Conditioning | ||||||
|---|---|---|---|---|---|---|---|
| Variables Entered in the Model | Standardized Coefficient | F to remove | Incremental R-squared | Variables Entered in the Model | Standardized Coefficient | F to remove | Incremental R-squared |
| Step 1: | Step 1: | ||||||
| PSWQ | .284 | 6.14 | .08 | FQ-total | −.232 | 3.99 | .05 |
| Step 2: | Step 2: | ||||||
| PSWQ | .484 | 16.59 | -- | FQ-total | −.421 | 11.32 | -- |
| FQ-total | −.436 | 13.44 | .15 | PSWQ | .411 | 11.87 | .14 |
| Step 3: | Step 3: | ||||||
| PSWQ | .376 | 8.89 | -- | na | . | ||
| FQ-total | −.493 | 17.25 | -- | ||||
| ASI | .266 | 4.75 | .05 | ||||
| Variables Excluded From the Model | Partial Correlation | F to enter | Variables Excluded From the Model | Partial Correlation | F to enter | ||
| Beck Anxiety Inventory | −.10 | 0.63 | na | Beck Anxiety Inventory | −.01 | 0.12 | na |
| Beck Depression Inventory | −.19 | 2.37 | na | Beck Depression Inventory | −.17 | 2.06 | na |
| NEO – Neuroticism T-score | −.06 | 0.23 | na | NEO – Neuroticism T-score | −.06 | 0.21 | na |
| NEO – Extraversion T-score | −.09 | 0.50 | na | NEO – Extraversion T-score | −.15 | 1.51 | na |
| -- | -- | -- | -- | Anxiety Sensitivity Index | .20 | 2.72 | na |
To assess whether the positive correlation between ASI scores and orienting response magnitude (albeit statistically non-significant) might explain the apparent contribution of ASI scores to the prediction of general conditioning SCRs, we examined the effect of the orienting response variable in the multiple regression analysis of conditioning outcomes. When included as a covariate in the multivariate analysis of general conditioning outcomes, orienting response offered significant prediction (F 1, 67 = 30.35, p < .0001), and eliminated the predictive significance of ASI scores (F 1, 67 = 2.31, p < .133). However, including the orienting response as a covariate did not alter the multivariate significance of the PSWQ and FQ scores for prediction of either general- or differential-conditioning SCRs.
Discussion
Although the range of scores was restricted in our samples of healthy participants, we found that subsyndromal characteristics associated with anxiety disorders were related to fear-conditioning outcomes and reflected moderate effect sizes (Cohen, 1988). Variables implicated as potentially important included fears of anxiety symptoms as assessed by the ASI, subsyndromal worry as assessed by the PSWQ, and subsyndromal behavioral avoidance as assessed by the FQ. In the univariate regression analyses, only the ASI and PSWQ reached significance as predictors of the general measure of conditionability, and only the FQ reached significance as a predictor of differential conditioning. Of these measures, only the ASI was implicated as significantly predictive of the orienting response as well, raising the possibility that the predictive significance of the ASI for the measure of general conditioning likely reflects its relationship with the orienting response; i.e., a generalized sensitivity and reactivity to any novel stimulus within the context of a conditioning study.
Further analysis with stepwise, multiple regression analyses showed that the FQ and PSWQ offered non-redundant prediction of the magnitude of conditioned responses. Specifically, the FQ and the PSWQ emerged as powerful predictors, together accounting for 23% and 19% of the variance in general and differential conditioning outcomes, respectively. We found that, within the subsyndromal range, subtle avoidance behaviors were associated with lower conditioning to fear cues. In the clinical context, subtle avoidance behaviors also appear to interfere with new learning, but this effect has been demonstrated for interference with safety learning from exposure (e.g., Powers, Smits, & Telch, 2004; Telch et al., 2004) rather than interference with fear acquisition. Accordingly, the potential protective effect of subtle avoidance on the learning of new fears, as observed in our study of non-patients, needs to be balanced against the obvious detrimental effects of avoidance on maintaining anxiety disorders once developed (Barlow, 2002). Nonetheless, our observation of potential protective effects from subtle avoidance for fear acquisition in this conditioning study is consistent with reports of a trend toward lower levels of PTSD pathology in response to indirect exposure (via media coverage) to the terrorist attacks of September 11th in behaviorally inhibited (avoidant) children (Otto et al., in press pending).
As for the detrimental effects of subsyndromal worry, studies indicate that worry has a number of effects that may help incubate or maintain fears. For example, worry appears to increase the number of intrusive images after the viewing of a stressful film (Butler, Wells, & Dewick, 1995; Wells & Papagerorgiou, 1995), helping ensure that negative images, when confronted, are repeatedly rehearsed. Moreover, Jones and Davey (1990) showed that such cognitive rehearsal of aversive stimuli can enhance fear responding in a conditioning paradigm. More precisely, they found that the cognitive rehearsal of a UCS and the UCR (i.e., to think about the loud tone UCS and reactions to the tone) in the absence of further presentation of the CS and UCS, aided the persistence of the fear CR (see also Davey and Matchett, 1994). Accordingly, worry may serve as a risk factor for greater fear acquisition after exposure to negative stimuli.
In our laboratory, the next step will be to examine the role of these variables in predicting the higher levels of fear conditioning observed in some studies of patients with anxiety disorders. Of particular focus will be investigations of the inconsistent findings for comparisons of anxiety and healthy-control samples by considering individual differences in levels of worry, avoidance, and anxiety sensitivity in these samples. Based on the present findings, individuals who are higher in worry, but who have lower levels of avoidance, would be expected to show the greatest differences in conditionability relative to healthy control samples.
In addition to identifying potential predictors of fear conditionability among healthy participants, our findings failed to support neuroticism and extraversion as predictors of the degree of fear acquisition; effect sizes for these variables were in the small range. Nonetheless, we found that neuroticism was a significant predictor of the magnitude of the SC orienting response as defined by responsivity to the “to be” CS+ during the habituation phase. Accordingly, neuroticism may discriminate individuals who are reactive to their environment, but perhaps not identify individuals who quickly learn contingencies between cues and aversive events.
Anxiety sensitivity may serve as a similar predictor of reactivity in conditioning studies. In our study, the ASI offered significant prediction for the general conditioning measure only, accounting for an additional 5% of the variance. However, this predictive significance was redundant with the prediction afforded by consideration of individual differences in the orienting response to the CS during habituation, suggesting that the ASI primarily predicted the elements of the general conditioning measure that were contaminated by the orienting response. One interpretation of this finding is that the ASI is predictive of general sensitivity and reactivity to novel stimuli rather than fear learning per se. Such a confound would not be expected for differential conditioning scores because this measure controls for general reactivity to CSs by examining the difference in reactivity between CS+ and CS-. Indeed, consideration of differences in ASI scores among anxiety samples may have methodological value in helping explain inconsistent findings in previous studies of simple and differential conditioning. If ASI scores in the clinical range are indeed markers of the component of simple fear conditioning that is linked to general reactivity (i.e., orienting response), then samples characterized by patients with high ASI scores—such as patients with panic disorder, posttraumatic stress disorder, or social phobia comorbid with depression (Ball, Otto, Pollack, Uccello, & Rosenbaum, 1995; Taylor et al., 1992)--would be expected to show inflated simple-conditioning but not differential-conditioning SCRs. This speculative hypothesis awaits testing in both simple and differential conditioning comparisons between anxiety patients high and low in anxiety sensitivity, as well as comparisons of these patients to healthy controls who are relatively high and low in anxiety sensitivity.
In summary, we identified a number of subsyndromal anxiety-related characteristics that were predictive of fear acquisition in a de novo fear-conditioning paradigm. Although we have speculated that these differences in fear-conditioning may be of importance to the etiology of anxiety disorders, we can not rule out the possibility that our findings simply reflect state correlates of subtle levels of worry, avoidance, or anxiety sensitivity, but have no implications for the development of anxiety disorders. Nonetheless, these state effects of worry may be important for the maintenance of anxiety conditions, changing the ease by which additional fears may be learned once initial levels of worry and anxiety sensitivity are established. Longitudinal studies can help clarify these competing accounts.
Acknowledgments
This research was supported by a NIMH translational research grant (MH072165) to the first author. The authors thank Evelyn Behar, Ph.D. for helpful comments on a previous draft.
Footnotes
Although some investigators have found it useful to subdivide the SC response to a CS-UCS pairing into first-interval and second-interval responses (e.g., Ohman, 1971), Orr and colleagues have not found this refinement to be necessary in order to obtain meaningful SC conditioning results (e.g., Orr & Lanzetta, 1980; Pitman & Orr, 1986; Orr et al., 2000; Milad, Orr, Pitman, & Rauch, 2005).
References
- Ball SG, Otto MW, Pollack MH, Uccello R, Rosenbaum JF. Differentiating social phobia and panic disorder: A test of core beliefs. Cognitive Research and Therapy. 1995;19:473–482. [Google Scholar]
- Barlow, D. H. (2002). Anxiety and Its Disorders: The Nature and Treatment of Anxiety and Panic (2ndEdition). New York: Guilford.
- Beck AT, Epstein N, Brown G, Steer RA. An inventory for measuring clinical anxiety: psychometric properties. Journal of Consulting and Clinical Psychology. 1988;56:893–897. doi: 10.1037//0022-006x.56.6.893. [DOI] [PubMed] [Google Scholar]
- Beck, A.T., Steer, R.A. (1987). Beck Depression Inventory manual. San Antonio: The Psychological Press.
- Beck, A. T., Steer, R. A. (1990). Beck Anxiety Inventory manual. San Antonio: The Psychological Press.
- Beck AT, Ward CH, Mendelson M, Mock J, Erbaugh J. An inventory for measuring depression. Archives of General Psychiatry. 1961;4:561–571. doi: 10.1001/archpsyc.1961.01710120031004. [DOI] [PubMed] [Google Scholar]
- Brown TA, Anthony MM, Barlow DH. Psychometric properties of the Penn state worry questionnaire in a clinical anxiety disorder sample. Behaviour Research and Therapy. 1992;30:33–37. doi: 10.1016/0005-7967(92)90093-v. [DOI] [PubMed] [Google Scholar]
- Butler G, Wells A, Dewick H. Differential effects of worry and imagery after exposure to a stressful stimulus: a pilot study. Behavioral & Cognitive Psychotherapy. 1995;23:45–56. [Google Scholar]
- Chelminski I, Zimmerman M. Pathological worry in depressed and anxious patients. Journal of Anxiety Disorders. 2003;17:533–546. doi: 10.1016/s0887-6185(02)00246-3. [DOI] [PubMed] [Google Scholar]
- Cohen, J. (1988). Statistical power analysis for the behavioral sciences (2nd ed.). Hillsdale, NJ: Lawrence Earlbaum Associates.
- Costa, P. T., Jr., & McCrae, R. R. (1992). NEO Five-Factory Inventory (NEO-FFI) Professional Manual. Psychological Assessment Resources: Odessa, FL.
- Davey GC, Matchett G. Unconditioned stimulus rehearsal and the retention and enhancement of differential "fear" conditioning: effects of trait and state anxiety. Journal of Abnormal Psychology. 1994;103:708–718. doi: 10.1037//0021-843x.103.4.708. [DOI] [PubMed] [Google Scholar]
- Eysenck HJ. The conditioning model of neurosis. Behavioral and Brain Sciences. 1979;2:155–199. [Google Scholar]
- First, M. B., Spitzer, R. L., Gibbon, M., & Williams, J. B., (1997). Structured Clinical Interview for DSM-IV Axis I Disorders, Patient Edition (SCID-I/P, Version 2.0). Arlington, Virginia: American Psychiatric Publishing Inc.
- Fowles DC, Christie MJ, Edelberg R, Grings WW, Lykken DT, Venables PH. Publication recommendations for electrodermal measurements. Psychophysiology. 1981;18:232–239. doi: 10.1111/j.1469-8986.1981.tb03024.x. [DOI] [PubMed] [Google Scholar]
- Freeston MH, Dugas MJ, Letarte H, Rhéaume J, Blais F, Ladouceur R. Physical symptoms associated with worry in a nonclinical population. Journal of Anxiety Disorders. 1996;10:365–377. [Google Scholar]
- Gardenswartz CA, Craske ME. Prevention of panic disorder. Behavior Therapy. 2001;32:725–737. [Google Scholar]
- Grillon C, Morgan CA., III Fear-potentiated startle conditioning to explicit and contextual cues in Gulf War veterans with posttraumatic stress disorder. Journal of Abnormal Psychiatry. 1999;44:990–997. doi: 10.1037//0021-843x.108.1.134. [DOI] [PubMed] [Google Scholar]
- Jain U, Blais MA, Otto MW, Hirshfeld DR, Sachs GS. Five-factor personality traits in patients with seasonal depression: treatment effects and comparisons with bipolar patients. Journal of Affective Disorders. 1999;55:51–54. doi: 10.1016/s0165-0327(98)00206-7. [DOI] [PubMed] [Google Scholar]
- Jones T, Davey GC. The effects of cued UCS rehearsal on the retention of differential “fear” conditioning: an experimental analogue of the “worry” process. Behaviour Research and Therapy. 1990;28:159–164. doi: 10.1016/0005-7967(90)90028-h. [DOI] [PubMed] [Google Scholar]
- Lissek S, Powers AS, McClure EB, Phelps EA, Woldehawariat G, Grillon C, et al. Classical fear conditioning in the anxiety disorders: a meta-analysis. Behaviour Research and Therapy. 2005;43:1391–1424. doi: 10.1016/j.brat.2004.10.007. [DOI] [PubMed] [Google Scholar]
- Marks IM, Mathews AM. Brief standard self-rating for phobic patients. Behaviour Research and Therapy. 1979;17:263–267. doi: 10.1016/0005-7967(79)90041-x. [DOI] [PubMed] [Google Scholar]
- Mavissakalian M. The Fear Questionnaire: a validity study. Behaviour Research and Therapy. 1986;24:83–85. doi: 10.1016/0005-7967(86)90154-3. [DOI] [PubMed] [Google Scholar]
- McNally RJ. Anxiety sensitivity and panic disorder. Biological Psychiatry. 2002;52:938–946. doi: 10.1016/s0006-3223(02)01475-0. [DOI] [PubMed] [Google Scholar]
- Meyer TJ, Miller ML, Metzger RL, Borkovec TD. Development and validation of the Penn State Worry Questionnaire. Behaviour Research and Therapy. 1990;28:487–495. doi: 10.1016/0005-7967(90)90135-6. [DOI] [PubMed] [Google Scholar]
- Molina, S., & Borkovec, T. D. (1994). The Penn State Worry Questionnaire: psychometric properties and associated characteristics. In: G. Davey & F. Tallis (Eds.), Worrying: perspectives on theory, assessment and treatment (pp. 265–283). Chichester, UK: Wiley.
- Oei T, Moylan A, Evans L. Validity and clinical utility of the Fear Questionnaire for anxiety-disorder patients. Psychological Assessment. 1991;3:391–397. [Google Scholar]
- Ohman A. Differentiation of conditioned and orienting response components in electrodermal conditioning. Psychophysiology. 1971;8:7–22. doi: 10.1111/j.1469-8986.1971.tb00432.x. [DOI] [PubMed] [Google Scholar]
- Orr SP, Lanzetta JT. Facial expressions of emotion as conditioned stimuli for human autonomic responses. Journal of Personality and Social Psychology. 1980;38:278–282. doi: 10.1037//0022-3514.38.2.278. [DOI] [PubMed] [Google Scholar]
- Orr SP, Metzger LJ, Lasko NB, Macklin ML, Peri T, Pitman RK. De novo conditioning in trauma-exposed individuals with and without posttraumatic stress disorder. Journal of Abnormal Psychology. 2000;109:290–298. [PubMed] [Google Scholar]
- Osman A, Barrios FX, Osman JR, Markway K. Further psychometric evaluation of the Fear Questionnaire: responses of college students. Psychological Reports. 1993;73:1259–1266. doi: 10.2466/pr0.1993.73.3f.1259. [DOI] [PubMed] [Google Scholar]
- Otto, M. W., Henin, A., Hirshfeld-Becker, D., Pollack, M. H., Biederman, J., & Rosenbaum, J. F. (in press – pending). Posttraumatic stress disorder symptoms following media exposure to tragic events: Impact of 9/11 on children at risk. Journal of Anxiety Disorders [DOI] [PubMed]
- Otto MW, Pollack MH, Fava M, Uccello R, Rosenbaum JF. Elevated Anxiety Sensitivity Index scores in patients with major depression: Correlates and changes with antidepressant treatment. Journal of Anxiety Disorders. 1995;9:117–123. [Google Scholar]
- Peterson, R. A., & Reiss, S. (1992). Anxiety Sensitivity Index manual (2nd ed.). Worthington, Ohio: International Diagnostic Services, Inc.
- Pitman RK, Orr SP. Test of the conditioning model of neurosis: Differential aversive conditioning of angry and neutral facial expressions in anxiety disorder patients. Journal of Abnormal Psychology. 1986;95:208–213. doi: 10.1037//0021-843x.95.3.208. [DOI] [PubMed] [Google Scholar]
- Powers MB, Smits JA, Telch MJ. Disentangling the effects of safety-behavior utilization and safety-behavior availability during exposure-based treatment: a placebo-controlled trial. Journal of Consulting and Clinical Psychology. 2004;72:448–454. doi: 10.1037/0022-006X.72.3.448. [DOI] [PubMed] [Google Scholar]
- Reiss S, Peterson RA, Gursky DM, McNally RJ. Anxiety sensitivity, anxiety frequency and the prediction of fearfulness. Behaviour Research and Therapy. 1986;24:1–8. doi: 10.1016/0005-7967(86)90143-9. [DOI] [PubMed] [Google Scholar]
- Schmidt NB, Lerew DR, Jackson RJ. The role of anxiety sensitivity in the pathogenesis of panic: Prospective evaluation of spontaneous panic attacks during acute stress. Journal of Abnormal Psychology. 1997;106:355–364. doi: 10.1037//0021-843x.106.3.355. [DOI] [PubMed] [Google Scholar]
- Schmidt, N. B., Zvolensky, M. J., & Maner, J. K. (in press). Anxiety sensitivity: Prospective prediction of panic attacks and Axis I pathology. Journal of Psychiatric Research [DOI] [PubMed]
- Steer RA, Beck AT, Riskind JH, Brown G. Differentiation of depressive disorders from generalized anxiety by the Beck Depression Inventory. Journal of Clinical Psychology. 1986;42:475–478. doi: 10.1002/1097-4679(198605)42:3<475::aid-jclp2270420311>3.0.co;2-d. [DOI] [PubMed] [Google Scholar]
- Taylor S, Koch WJ, McNally RJ. How does anxiety sensitivity vary across the anxiety disorders? Journal of Anxiety Disorders. 1992;6:249–259. [Google Scholar]
- Telch MJ, Valentiner DP, Ilai D, Young PR, Powers MB, Smits JA. Fear activation and distraction during the emotional processing of claustrophobic fear. Journal of Behavior Therapy and Experimental Psychiatry. 2004;35:219–232. doi: 10.1016/j.jbtep.2004.03.004. [DOI] [PubMed] [Google Scholar]
- Thayer JF, Friedman BH, Borkovec TD, Johnsen BH, Molina S. Phasic heart period reactions to cued threat and nonthreat stimuli in generalized anxiety disorder. Psychophysiology. 2000;37:361–368. [PubMed] [Google Scholar]
- van Rijsoort S, Emmelkamp P, Vervaeke G. The Penn State Worry Questionnaire and the Worry Domains Questionnaire: structure, reliability, and validity. Clinical Psychology and Psychotherapy. 1999;6:297–307. [Google Scholar]
- Wells A, Papageorgiou C. Worry and the incubation of intrusive images following stress. Behaviour Research and Therapy. 1995;33:579–83. doi: 10.1016/0005-7967(94)00087-z. [DOI] [PubMed] [Google Scholar]