

Abstract
Oleoylethanolamide (OEA) is a lipid mediator that inhibits food intake by activating the nuclear receptor peroxisome proliferator-activated receptor- α (PPAR-α). In the rodent small intestine, OEA levels decrease during food deprivation and increase upon refeeding, suggesting that endogenous OEA may participate in the regulation of satiety. Here we show that feeding stimulates OEA mobilization in the mucosal layer of rat duodenum and jejunum, but not in the serosal layer from the same intestinal segments, in other sections of the gastrointestinal tract (stomach, ileum, colon), or in a broad series of internal organs and tissues (e.g., liver, brain, heart, plasma). Feeding also increases the levels of other unsaturated fatty-acid ethanolamides (FAEs) (e.g., linoleoylethanolamide) without affecting those of saturated FAEs (e.g., palmitoylethanolamide). Feeding-induced OEA mobilization is accompanied by enhanced accumulation of OEA-generating N-acyl phosphatidylethanolamines (NAPEs), increased activity and expression of the OEA-synthesizing enzyme NAPE-phospholipase D (NAPE-PLD), and decreased activity and expression of the OEA-degrading enzyme fatty-acid amide hydrolase (FAAH). Immunostaining studies revealed that NAPE-PLD and FAAH are expressed in intestinal enterocytes and lamina propria cells. Collectively, these results indicate that nutrient availability controls OEA mobilization in the mucosa of the proximal intestine through a concerted regulation of OEA biosynthesis and degradation.
The gastrointestinal tract controls key aspects of feeding behavior through both neuronal and humoral mechanisms. Among the regulatory signals released by the gut, peptides such as cholecystokinin (CCK), glucagon-like peptide-1 (GLP-1) and ghrelin have attracted the most attention (1), but recent evidence indicates that lipid-derived messengers such as oleoylethanolamide (OEA) may also be involved (2). OEA is synthesized in the small intestine of various vertebrate species, where its levels decrease during food deprivation and increase upon refeeding (3–5). The possibility that these fluctuations represent a satiety signal is suggested by experiments in rodents, which show that pharmacological administration of OEA delays meal initiation and prolongs the interval between successive meals, resulting in a persistent inhibition of food intake (3,6–8). These anorexiant effects are strikingly different from those elicited by traditional satiety factors such as CCK, which reduce meal size without affecting the interval between meals (9). Moreover, the hypophagic actions of OEA differ from those exerted by GLP-1 (10) and corticotropin-releasing factor (CRF) (11), in that they are not accompanied by behavioral signs of malaise and anxiety or by changes in circulating corticosterone levels (3,12).
The molecular mechanism through which OEA inhibits feeding has been partially elucidated. In vitro studies have shown that OEA is a high-affinity agonist of peroxisome proliferator-activated receptor-α (PPAR-α) (13) – a nuclear receptor present in the small intestine and implicated in the regulation of energy balance and lipid metabolism (14–17). OEA binds to the purified ligand-binding domain of PPAR-α with a KD of approximately 40 nM and activates this receptor in cell-based assays with a half-maximal effective concentration (EC50) of 120 nM (13). Furthermore, in vivo experiments have revealed that genetic deletion of PPAR-α abrogates the anorexiant effects of OEA without altering those evoked by CCK-8 and fenfluramine (13). Finally, it has been shown that synthetic PPAR-α agonists, but not agonists of PPAR-δ and PPAR-γ, produce a hypophagic response that is behaviorally indistinguishable from that elicited by OEA, and is absent in mutant mice lacking PPAR-α (13). A parsimonious interpretation of these results is that OEA regulates food intake in rodents by selectively activating intestinal PPAR-α. Notably, OEA can also activate the G protein-coupled receptor, GPR119 (8), and the vanilloid receptor channel, TRPV1 (18), albeit at micromolar concentrations. However, the contribution of these receptors to the satiety-inducing effects of OEA is still undefined.
The enzyme pathway considered responsible for OEA formation and deactivation in mammalian tissues is illustrated in Fig. 1. Its first step is the transfer of a fatty-acid residue from the sn-1 position of phosphatidylcholine to the free amine group of phosphatidylethanolamine. This reaction is catalyzed by an N-acyltransferase (NAT), which remains to be molecularly identified, and yields a heterogeneous family of N-acyl phosphatidylethanolamine (NAPE) species. The second step is the cleavage of NAPEs to produce other fatty-acid ethanolamides (FAEs), including OEA, a step catalyzed by NAPE-specific phospholipase D (NAPE-PLD) (19,20). OEA deactivation consists in the intracellular hydrolysis of this lipid amide to oleic acid and ethanolamine, which is thought to be mediated by fatty-acid amide hydrolase (FAAH), an intracellular membrane-bound serine hydrolase (21), and/or N-acylethanolamine-hydrolyzing acid amidase (NAAA), a lysosomal cysteine hydrolase (22) (Fig. 1).
Fig. 1.
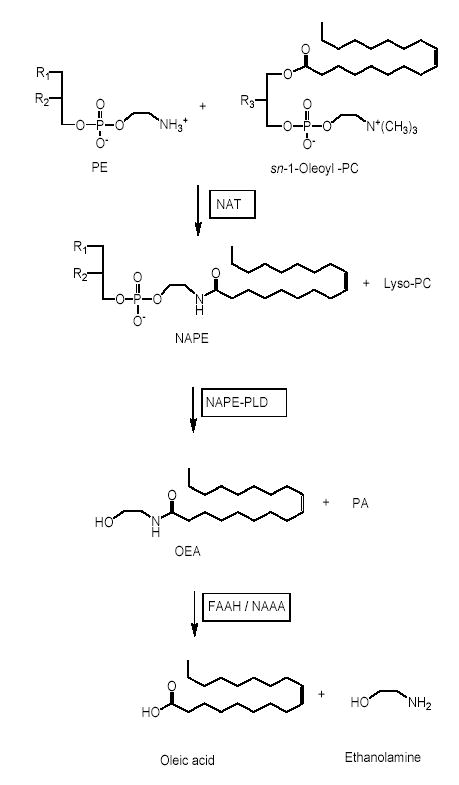
Proposed route of OEA formation and degradation in vertebrate tissues. PE, phosphatidylethanolamine; PC, phosphatidylcholine; PA, phosphatidic acid; NAT, N-acyl transferase; NAPE-PLD, N-acyl phosphatidylethanolamine-specific phospholipase D; FAAH, fatty-acid amide hydrolase; NAAA, N-acylethanolamine-hydrolyzing acid amidase.
Although previous reports have shown that feeding regulates intestinal OEA levels (3–5,13), the mechanistic details of this process have not been fully elucidated. In the present study, we show that food intake promotes OEA mobilization in the mucosal layer of the rodent proximal intestine through a concerted regulation of NAPE biosynthesis, NAPE-PLD activity and OEA hydrolysis.
Experimental Procedures
Animals
Adult male Wistar rats (250–300 g) were purchased from Charles River (Wilmington, MA). FAAH−/− and NAPE-PLD−/− mice were generated and bred as described (23,24). A 12-hour light/dark cycle was set with lights on at 5:30 am. Water and standard chow pellets (Prolab RMH 2500; PMI Nutrition International, Brentwood, MO) were available ad libitum, except when animals were food deprived. Food deprivation was conducted for 24 h in bottom-wired cages to prevent coprophagia. All procedures met the National Institutes of Health guidelines for the care and use of laboratory animals and were approved by the Institutional Animal Care and Use Committee of the University of California, Irvine.
Chemicals
Fatty acid chlorides were purchased from Nu-Chek Prep (Elysian, MN), 1,2-dipalmitoyl-sn-glycero-3-phosphoethanolamine from Sigma-Aldrich (St. Louis, MO), and tetrahydrolipstatin (THL) from ChemPacific (Baltimore, MD). N-cyclohexanecarbonylpentadecylamine was a kind gift from Dr. Natsuo Ueda (Kagawa University, Japan).
Chemical syntheses
URB597 was synthesized as described (25). OEA and other FAEs were prepared by the reaction of fatty-acid chlorides with a 10-fold molar excess of ethanolamine (Sigma-Aldrich) or [2H4]-ethanolamine (Cambridge Isotope Laboratories, Andover, MA). Reactions were conducted in dichloromethane at 0–4°C for 15 min, with stirring. The products were washed with water, dehydrated over sodium sulphate, filtered, and dried under N2. They were characterized by liquid chromatography/mass spectrometry (LC/MS) and 1H nuclear magnetic resonance spectroscopy. Purity was >98% by LC/MS. NAPEs were prepared by the reaction of fatty-acid chlorides with a two-fold molar excess of 1,2-dipalmitoyl-sn-glycero-3-phosphoethanolamine. Reactions were conducted in dichloromethane at 25°C for 2 hours, using triethylamine (Sigma-Aldrich) as a catalyst. The products were washed with water, fractionated by silica gel thin-layer chromatography (chloroform/methanol/ammonia, 80:20:2, vol/vol/vol) and characterized by LC/MS coupled to tandem mass spectrometry (LC/MSn). Purity was >95%.
Lipid extractions
Rats were sacrificed with halothane and tissues were rapidly collected and snap-frozen in liquid N2. Plasma was prepared as described (26). Frozen tissues were weighed and homogenized in methanol (1ml per 100 mg tissue) containing [2H4]-FAEs and 1,2-dipalmitoyl-sn-glycero-3-phosphoethanolamine-N-heptadecanoyl as internal standards. Lipids were extracted with chloroform (2 vol) and washed with water (1 vol). Organic phases were collected and dried under N2. FAEs and NAPEs were fractionated by open-bed silica gel column chromatography, as described (27). Briefly, the lipids were reconstituted in chloroform and loaded onto small glass columns packed with Silica Gel G (60-Å 230–400 Mesh ASTM; Whatman, Clifton, NJ). FAEs and NAPEs were eluted with 9:1 and 5:5 chloroform/methanol (vol/vol), respectively. Eluates were dried under N2 and reconstituted in 0.1 ml of chloroform/methanol (1:4, vol/vol) for LC/MS and LC/MSn analyses.
LC/MS analyses
We used an 1100-LC system coupled to a 1946A-MS detector (Agilent Technologies, Inc., Palo Alto, CA) equipped with an electrospray ionization (ESI) interface. FAEs were separated using a XDB Eclipse C18 column (50×4.6 mm i.d., 1.8 μm, Zorbax), eluted with a gradient of methanol in water (from 85% to 90% methanol in 2.5 min) at a flow rate of 1.5 ml/min. Column temperature was kept at 40°C. MS detection was in the positive ionization mode, capillary voltage was set at 3 kV and fragmentor voltage was varied from 120 to 140 V. N2 was used as drying gas at a flow rate of 13 liters/min and a temperature of 350°C. Nebulizer pressure was set at 60 PSI. Quantifications were conducted using an isotope-dilution method, monitoring Na+ adducts of the molecular ions ([M+Na]+). Limit of quantification for OEA was 0.25 pmol, as determined by injecting into the LC/MS various amounts of OEA in the presence of 100 pmol of [2H4]-OEA standard.
LC/MSn analyses
We used an 1100-LC system (Agilent Technologies) equipped with a Ion Trap XCT (Agilent Technologies). NAPEs were separated using a Poroshell 300SB C18 column (2.1×75 mm i.d., 5 μm, Agilent) maintained at 50°C. A linear gradient of methanol (A) in water (B) containing 5 mM ammonium acetate and 0.25% acetic acid (from 85% to 100% of B in 4 min) was applied at a flow rate of 1 ml/min. Detection was set in the negative mode, capillary voltage was 4.5kV, skim1 −40V, and capillary exit −151V. N2 was used as drying gas at a flow rate of 12 liters/min, temperature of 350°C and nebulizer pressure of 80 PSI. Helium was used as collision gas. Tissue-derived NAPEs were identified by comparison of their LC retention times and MSn fragmentation patterns with those of authentic standards, prepared as described above. We acquired full-scan MSn spectra of selected NAPE precursor-ions by multiple reaction monitoring. Extracted ion chromatograms were used to quantify each NAPE precursor-ion by monitoring characteristic productions, as follows: 1-stearoyl-2-arachidonoyl-sn-glycero-phosphoethanolamine-N-oleoyl (m/z 1030.8>744.8), 1-stearoyl-2-arachidonoyl-sn-glycero-phosphoethanolamine-N-palmitoyl (m/z 1004.8>718.8) and 1,2-dipalmitoyl-sn-glycero-3-phosphoethanolamine-N-heptadecanoyl (m/z 942.8>704.8), which was used as internal standard. Detection and analysis was controlled by Agilent/Bruker Daltonics software version 5.2 and 3D maps were generated using MS Processor from Advanced Chemistry Development, Inc. (Toronto, Canada).
NAPE-PLD Assays
Rats were anesthetized with halothane and sacrificed by decapitation. Tissues were removed and homogenized in ice-cold Tris-HCl (20 mM, 10 vol, pH 7.4) containing 0.32 M sucrose. NAPE-PLD activity was measured at 37°C for 30 min in Tris-HCl buffer (50 mM, pH 7.4) containing 0.1% Triton X-100, 1 mM of phenylmethylsulphonylfluoride (PMSF), tissue homogenate protein (100 μg) and 1,2-dipalmitoyl-sn-glycero-3-phosphoethanolamine-N-heptadecenoyl (100 μM) as substrate. The reactions were stopped by adding chloroform-methanol (2:1, vol/vol) containing [2H4]-OEA as internal standard. After centrifugation at 1,500×g at 4°C for 5 min, the organic layers were collected and dried under N2. The residues were suspended in 50 μl of chloroform/methanol (1:3, vol/vol) and analyzed by LC/MS. For quantification purposes, we monitored the [M+Na]+ ions of m/z = 334 for N-heptadecanoylethanolamide and m/z = 352 for [2H4]-OEA.
FAAH Assays
Tissues homogenates were centrifuged at 800×g for 15 min and then at 27,000×g for 30 min. The 27,000×g pellet was suspended in phosphate-buffered saline (PBS, pH 7.4). Reactions were conducted at 37°C for 30 min in 0.5 ml of Tris buffer (50 mM, pH 8.0) containing fatty acid-free bovine serum albumin (0.05%), protein (50 μg) and anandamide[ethanolamine-3H] (10,000 dpm, specific activity 20 Ci/mmol; American Radiolabeled Chemicals [ARC], St. Louis, MO) or OEA[ethanolamine-3H] (10,000 dpm, specific activity 15 Ci/mmol; ARC). After stopping the reaction with 1 ml chloroform/methanol (1:1, vol/vol), we measured radioactivity in the aqueous layers by liquid scintillation counting.
Quantitative PCR
Total RNA was extracted from tissue with TRIzol™ (Invitrogen, Carlsbad, CA) and quantified with Ribogreen™ (Molecular Probes, Eugene, OR). cDNA was synthesized from 2 μg of total RNA by using Superscript II RNase H-reverse transcriptase (Invitrogen) following the manufacturer’s instructions. Real-time quantitative PCR (Q-PCR) was performed in an Mx 3000P system (Stratagene, La Jolla, CA). Primers and fluorogenic probes were synthesised at TIB (Adelphia, NJ). The primer/probe sequences were: NAPE-PLD, forward primer: TGGCTGGGACACGCG, reverse primer: GGGATCCGTGAGGAGGATG, probe: CGCTGATGGTGGAAATGGACGAGC; FAAH, forward primer: GCCTCAAGGAATGCTTCAGC, reverse primer: TGCCCTCATTCAGGCTCAAG, probe: ACAAGGGCCACGACTCCACACTGG; GAPDH, forward primer: AAGTATGATGACATCAAGAAGGTGGT, reverse primer: AGCCCAGGATGCCCTTTAG, probe: AAGCAGGCGGCCGAGGGC. mRNA expression levels were normalized by using glyceraldehyde 3-phosphate dehydrogenase (GAPDH) as an internal standard, and were calculated as described (28).
Antibody Generation
We constructed a glutathione S-transferase (GST)-linked peptide comprising residues 38–53 of rat NAPE-PLD. The DNA fragment was amplified using primers incorporated with BamHI and XhoI restriction sites on the 5′ and 3′ end of amplicon, respectively. After digestion with BamHI and XhoI, amplicon was subcloned into vector pGEX-4T-1 (Amersham, Piscataway, NJ). The fusion protein was expressed in E. coli BL-21 cells (Novagen, Madison, WI) and purified using Glutathione Sepharose™ 4B (Amersham) following manufacturer’s instruction. The polyclonal NAPE-PLD antibody was raised in rabbits and characterized using standard procedures (29).
Immunohistochemistry
Mice were deeply anesthetized with halothane and their tissues were fixed by cardiac perfusion with saline followed by 4% paraformaldehyde in PBS (0.1 M, pH 7.2). The duodenum was collected and rinsed with PBS. 15 μm-thick transverse sections were cut with a Cryostat. The sections were rehydrated and treated with 0.3% H2O2 in methanol for 30 min to inactivate endogenous peroxidases, rinsed in PBS for 10 min, exposed to blocking serum (3% normal goat serum) for 2 hr at room temperature, rinsed again in PBS, and incubated overnight at 4ºC with the NAPE-PLD antibody (1:1,000 dilution) or a commercial anti-FAAH antibody (1:500 dilution; Chemicon, Temecula, CA). After the incubation, the sections were rinsed in 0.1 M PBS for 10 min and exposed to anti-rabbit IgG HRP (1:1,000 dilution, Vector Lab, Burlingame, CA) for 1 hour. After an additional 10 min rinse, the sections were treated with VectaStain® Elite ABC reagent (Vector Lab) for 30 min and developed with the diaminobenzidine (DAB) detection kit (Vector Lab). The sections were counterstained by hematoxylin and mounted with Permount (Sigma).
Protein analysis
Rat jejunal mucosa was homogenized in Tris-HCl buffer (50 mM, pH8.0) containing protease inhibitor cocktail V (Calbiochem, San Diego, CA). 20 μg of homogenate were electrophoresed on 4–15% SDS polyacrylamide gel (Invitrogen), and transferred onto Immobilon™ membranes (Millipore, Billerica, MA). Western blot analyses were conducted using antibodies against NAPE-PLD (1:1,000), FAAH (1:500; Chemicon) and β-actin (1:10,000; Calbiochem). Bands were visualized with an electrochemiluminescence (ECL) -Plus kit (Amersham Biosciences Inc., Piscataway, NJ).
Statistical Analyses
Results are expressed as means ± SEM. Statistical significance was evaluated using the Student’s t-test or, when appropriate, one-way analysis of variance followed by the Dunnett’s post-hoc test. Analyses were conducted using GraphPad Prism (GraphPad Software, San Diego, CA), and differences were considered significant if P < 0.05.
RESULTS
Effects of nutrient availability on OEA mobilization in rat tissue
We used an isotope-dilution LC/MS assay to measure OEA levels in various organs and tissues of free-feeding rats, 24-h food-deprived rats, or 24-h food-deprived rats that had been reexposed to food for 10, 30 or 60 min. Confirming previous results (3,4), we found that fasting decreases OEA content in the two most proximal segments of the small intestine, duodenum and jejunum, while refeeding rapidly reverses this effect (Fig. 2A,B). By contrast, no such a change was observed in other intestinal segments (ileum, stomach and colon) (Fig. 2C and Table 1), in a broad panel of internal organs and tissues (kidney, heart, lung, skeletal muscle, liver, pancreas, spleen, epididymal white adipose pads, plasma) (Table 1), or in brain structures involved in the control of feeding (brainstem, hypothalamus, thalamus, striatum and cortex) (Table 2). Indeed, several visceral organs, including liver and pancreas, responded to food deprivation with an increase rather than a decrease in OEA levels (Table 1), suggesting that nutrient availability regulates OEA mobilization in a tissue-specific manner.
Fig. 2.
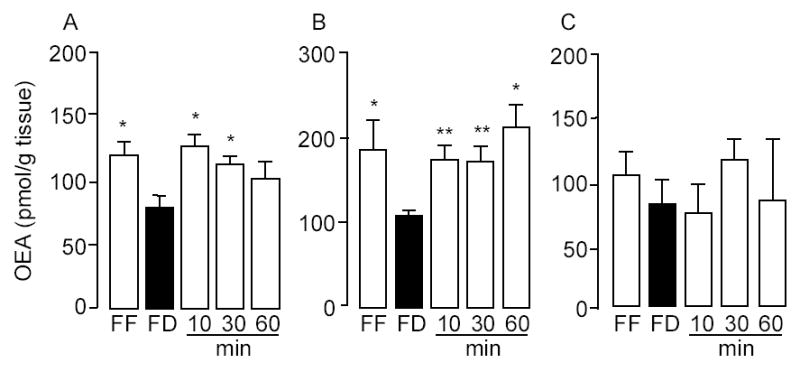
Feeding-induced OEA mobilization in the rat proximal small intestine. Effect of free-feeding (FF), 24-h food deprivation (FD) and refeeding (10, 30 and 60 min) on OEA levels in duodenum (A), jejunum (B) and ileum (C).*p < 0.05, ** p < 0.01 vs FD, n = 10–12.
Table 1.
Effects of 24-h food deprivation on OEA levels# in various organs and tissues of rats.
| Stomach | Colon | Kidney | Heart | Lung | Muscle | Liver | Pancreas | Spleen | WAT | Plasma | |
|---|---|---|---|---|---|---|---|---|---|---|---|
| F F | 108.3±7.4 | 72.8±5.1 | 58.4±5.6 | 104.3±8.6 | 115.8±9.7 | 92.5±3.6 | 80.7±3.2 | 44.3±3.7 | 58.0±2.9 | 174.3±10.3 | 5.9±0.4 |
| F D | 102.1±9.1 | 68.4±2.3 | 62.1±2.9 | 97.9±10.6 | 111.6±8.2 | 89.1±7.2 | 136.3±6.5** | 69.4±12.8** | 66.6±6.6** | 215.8±7.6** | 7.9±0.5** |
Results are expressed as mean ± SEM, n = 10–12.
P<0.05,
P<0.01 vs FD (Student t test).
FF, free-feeding; FD, 24-h food-deprivation.
OEA levels are expressed as pmol per g tissue weight or pmol per ml of plasma.
Table 2.
Effects of 24-h food deprivation on OEA levels in various structures of the rat brain.
| Cortex | Hippocampus | Thalamus | Striatum | Hypothalamus | Cerebellum | Brainstem | |
|---|---|---|---|---|---|---|---|
| FF | 162.5±13.3 | 137.3±12.8 | 264.1±12.6 | 216.8±11.1 | 139.5±8.8 | 195.1±11.8 | 439.3±38.2 |
| FD | 167.2±11.2 | 131.9±11.1 | 255.7±13.4 | 226.6±7.9 | 154.8±10.9 | 190.4±16.2 | 426.9±26.2 |
Results are expressed as mean ± SEM, n = 10–12. FF, free-feeding; FD, 24-h food-deprivation.
OEA levels are expressed as pmol per g tissue weight.
Effects of food deprivation on intestinal FAE mobilization
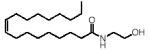
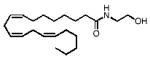
Because OEA is thought to share a common biosynthetic pathway with other bioactive FAEs, we identified and quantified other members of this lipid family in the duodenum and jejunum of fasting and free-feeding rats. The results of these analyses are reported in Table 3. Identifications were based on the detection of sodium adduct ions ([M+Na]+) of appropriate m/z values and retention times, and were confirmed by comparison with synthetic FAE standard. Food deprivation decreased intestinal levels of OEA (18:1Δ9), linoleoylethanolamide (18:2Δ9,12), linolenoylethanolamide (18:3Δ9,12,15) and docosahexaenoylethanolamide (22:6Δ4,7,10,13,16,19) (Table 3). By contrast, food deprivation did not change the duodenal or jejunal content of palmitoylethanolamide (PEA, 16:0) (Fig. 3A,B) and stearoylethanolamide (SEA, 18:0) (Table 3). Moreover, as previously reported (4,30), food deprivation increased levels of the endocannabinoid anandamide (eicosatetraenoylethanolamide, 20:4Δ5,8,11,14) (Fig. 3C,D and Table 3). The findings indicate that food intake (i) enhances the intestinal mobilization of a subgroup of FAEs that include OEA, but not PEA and SEA; and (ii) differentially regulates OEA and anandamide mobilization in the small intestine; the mechanism responsible for fasting-induced anandamide mobilization was not further investigated.
Table 3.
Chemical structures and tissue levels (pmol/g tissue) of various FAEs in rat small intestine.
| F A E | m/z | Structure | Feeding condition | Duodenum | Jejunum |
|---|---|---|---|---|---|
| 18:1, Δ9 | 348 |
|
F D | 85.2±9.5 | 118.7±11.3 |
| F F | 119.2±16.3* | 184.2±36.2* | |||
| 18:2, Δ9–12 | 346 |
|
F D | 36.4±3.8 | 91.5±19.4 |
| F F | 84.3±10.6** | 373.4±104.7* | |||
| 18:3, Δ9–12–15 | 344 |
|
F D | n.d. | n.d. |
| F F | 6.5±0.8*** | 22.5±6.4** | |||
| 18:0 | 350 |
|
F D | 111.3±9.2 | 174.7±20.0 |
| F F | 124.0±10.5 | 151.3±17.2 | |||
| 16:0 | 322 |
|
F D | 96.1±7.1 | 183±27 |
| F F | 97.8±10.2 | 193±39 | |||
| 16:1, Δ9 | 320 |
|
F D | n.d. | n.d. |
| F F | t r | t r | |||
| 20:3, Δ8–11–14 | 372 |
|
F D | n.d. | 3.8±1.3 |
| F F | n.d. | 1.8±0.3 | |||
| 20:4, Δ5–8–11–14 | 370 |
|
F D | 19.7±3.0 | 80.1±21.9 |
| F F | 9.1±1.2** | 25.7±5.6* | |||
| 22:6, Δ4–7–10–13–16–19 | 394 |
|
F D | 11.3±1.0 | 16.6±1.4 |
| F F | 18.6±2.5* | 33.7±9.1* |
Values represent means ± SEM, n = 5-6.
P<0.001,
P<0.01,
P<0.05 vs FD (Student t test).
FF, free-feeding; FD, 24-h food-deprivation. n.d. = non-detectable; tr=trace levels.
Fig. 3.
Effects of nutrient availability on PEA and anandamide levels in the rat proximal small intestine. Effects of free-feeding (FF), 24-h food deprivation (FD) and refeeding (10, 30 and 60 min) on the levels of PEA (A–B) and anandamide (C–D) in duodenum (left) and jejunum (right). * p < 0.05, ** p < 0.01 vs FD, n = 10–12.
Localization of feeding-dependent OEA mobilization in the small intestine
To test whether nutrient availability differentially affects OEA mobilization in the luminal and serosal portions of the small intestinal wall, we separated these structures with a blunt spatula (Fig. 4A) and measured OEA content in each of them separately. Fasting and refeeding strongly altered OEA mobilization in luminal fractions of duodenum or jejunum (Fig. 4B,D), but had no effect in corresponding serosal fractions (Fig. 4C,E). Thus feeding-induced OEA mobilization appears to be restricted to anatomical structures located in the innermost aspect, most likely the mucosal layer, of the duodenal and jejunal wall.
Fig. 4.
Feeding-induced OEA mobilization is restricted to the lumen of the rat proximal small intestine. A, Hematoxylin staining of a section of rat duodenum before (left) or after (right) removal of the lumen by scraping with a blunt spatula. Scale bar, 100 μm. Effects of free-feeding (FF), 24-h food deprivation (FD) and refeeding (10, 30 and 60 min) on OEA contents in luminal (B, D) and serosal fraction (C, E) of duodenum (B–C) and jejunum (D–E). *p < 0.05, **p < 0.01, ***p < 0.001 vs FD, n = 10–12.
Identification of OEA-generating NAPEs in the small intestine
The biosynthesis of NAPEs, catalyzed by NAT, is thought to be the first committed step in OEA mobilization (Fig. 1). We used LC/MSn to identify NAPE species that may serve as OEA precursors in the small intestine. An example of our approach is illustrated in Fig. 5, which shows the elution profile and mass spectra (MS1-MS3) generated by the endogenous NAPE, 1-stearoyl-2-arachidonoyl-sn-glycero-phosphoethanolamine-N-oleoyl (m/z = 1030.8) (Fig. 5A,B), along with the fragmentation pattern deduced from these spectra (Fig. 5C). Notable in this pattern is the sequential loss of the sn-2 and sn-1 fatty-acid substituents, with eventual generation of a fragment containing the N-acyl moiety (Fig. 5C). Fig. 6A depicts a bidimensional LC/MS tracing (LC elution time versus m/z) of NAPE species present in the luminal fraction from the jejunum of refed rats, and Fig. 6B reports the LC/MSn identification and relative quantification of OEA-generating NAPEs within this fraction. Quantifications were conducted using the unnatural synthetic NAPE, 1,2-dipalmitoyl-sn-glycero-3-phosphoethanolamine-N-heptadecanoyl, as an internal standard. These analyses revealed an unexpected paucity of NAPEs containing ether- or vinyl ether-linked fatty acids at the sn-1 position (< 2%). By contrast, sn-1 ether-containing NAPEs, which are readily identifiable by their distinctive fragmentation pattern (Fig. 7A,B), were abundant in the jejunal serosal fraction (Fig. 7C–E). The functional significance of this heterogeneity is unclear at present, but presumably reflects the different functions served by mucosal and serosal cell layers in intestinal physiology.
Fig 5.
Identification of NAPE species in luminal layer of rat jejunum by LC/MSn. A, Representative LC/MS3 extracted ion chromatogram for endogenous 1-stearoyl,2-arachidonoyl-sn-glycero-3-phosphoethanolamine-N-oleyl (m/z 1030.8>744.8>460.3). Chromatographic conditions are described under Experimental Procedures. B, top Negative ion electrospray mass spectra of the precursor-ion (m/z 1030.8) corresponding to the deprotonated NAPE; center, collision-induced dissociation (CID) productions of m/z 1030.8 and, bottom, product-ions for CID of the fragment with m/z 744.8. C, Proposed fragmentation pattern for 1-stearoyl,2-arachidonoyl-sn-glycero-3-phosphoethanolamine-N-oleoyl.
Fig. 6.
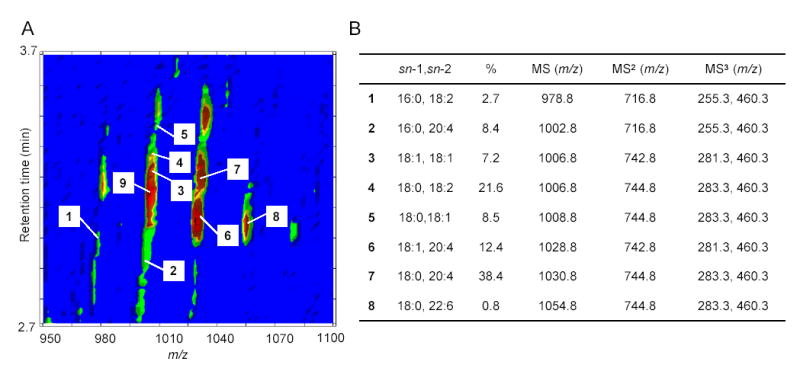
Molecular composition and relative quantification of OEA-generating NAPE species in the luminal layer of rat jejunum. A, Representative bidimensional LC/MS contour map. The first dimension is elution time and the second is m/z. The colored density distribution represents relative intensity of the signal. Numbers denote individual pseudo-molecular ions [M-H]− for OEA-generating NAPEs (1–8). The precursor ion labeled as 9 is the most abundant PEA-generating, which was identified by LC/MSn (1004.8>718.8>434.3). B, ESI-MSn identification, sn-1 and sn-2 fatty acid composition and relative amounts (%) of the main OEA-generating NAPE species in jejunal luminal fraction.
Fig. 7.
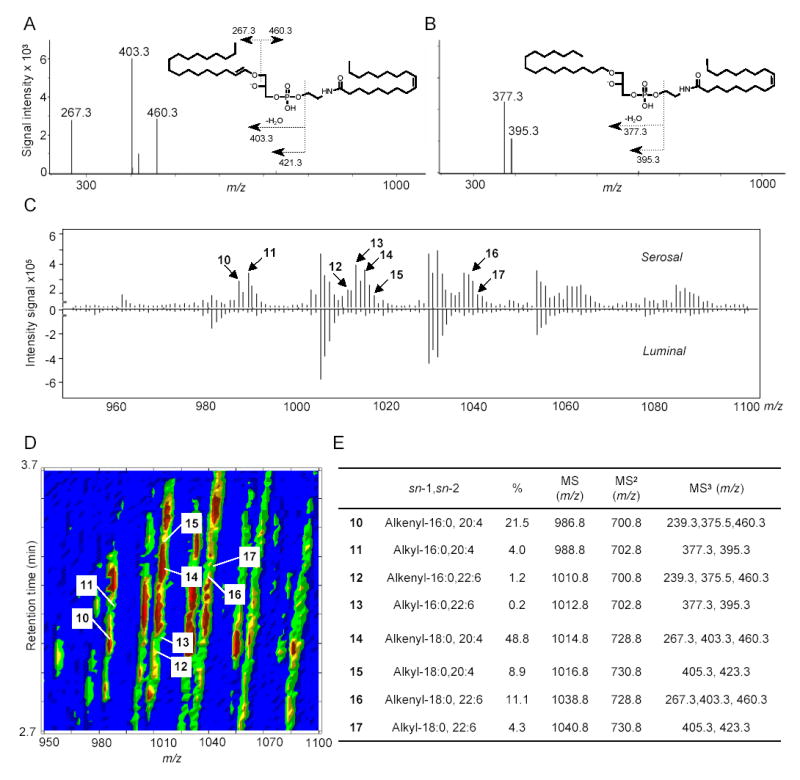
Molecular composition and relative quantification of OEA-generating NAPE species in the serosal layer of rat jejunum. MS3 fragmentation of representative sn-1 alkenyl NAPE (A) and sn-1 alkyl NAPE (B) identified in jejunal serosal layer. C, Mirrored display of averaged MS1 spectra at retention time from 2.7 to 3.7 min of serosal (top) and luminal (bottom) NAPEs. Arrows denote alkyl or alkenyl NAPE species. Numbers refer to the identification of those species, reported in panel E. D, Representative bidimensional LC/MS contour map of NAPEs from jejunal serosal fraction. The first dimension is elution time and the second is m/z. The colored density distribution represents relative intensity of the signal. Each number denotes an individual pseudo-molecular ion for 1-alkenyl (alkyl), sn-2-acyl NAPE species (10–17). E, ESI-MSn identification, sn-1 and sn-2 fatty acid composition and relative amounts (%) of the main OEA-generating ether-containing NAPEs in jejunal serosal fraction.
Effects of nutrient availability on intestinal NAPE biosynthesis
Next, we determined whether nutrient availability regulates intestinal NAPE levels in the luminal fraction of rat jejunum. To this end, we quantified by LC/MSn the most abundant intestinal NAPE precursors for OEA and PEA: respectively, 1-stearoyl-2-arachidonoyl-sn-glycero-3-phosphoethanolamine-N-oleoyl (Fig. 6, 5) and 1-stearoyl-2-arachidonoyl-sn-glycero-3-phosphoethanolamine-N-palmitoyl (Fig. 6, 9). The results show that fasting decreased jejunal levels of the OEA precursor 5, while refeeding produced an opposite effect (Fig. 8A). By contrast, levels of the PEA precursor 9 remained unchanged (Fig. 8B). This response mirrors the one previously observed with OEA and PEA (Fig. 2), further underscoring the selective nature of feeding-induced OEA mobilization.
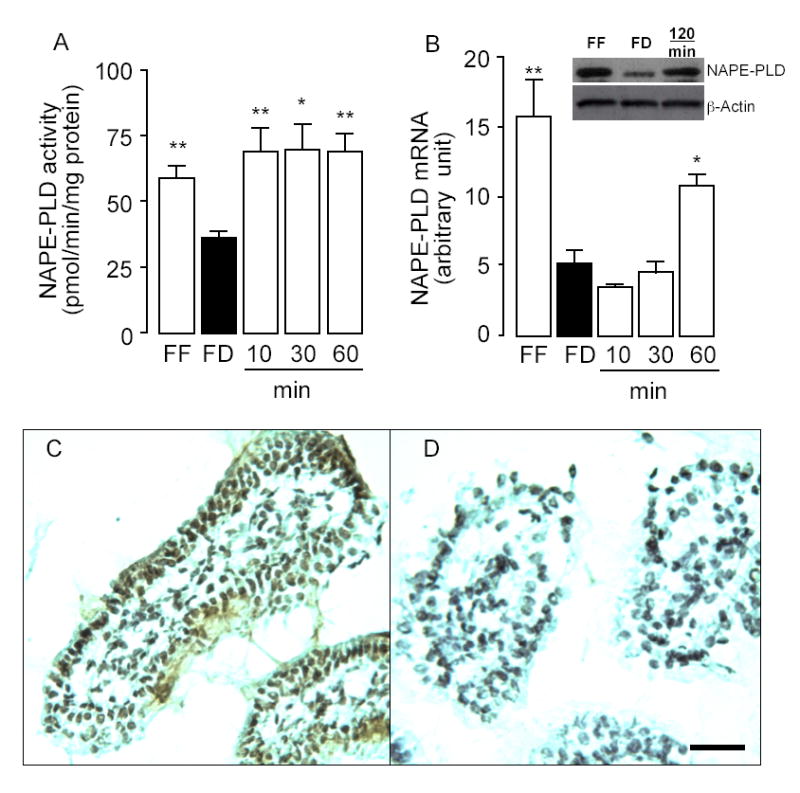
Fig. 9.
Feeding increases NAPE-PLD activity and expressions in rat jejunum. Effects of free feeding (FF), 24-h food deprivation (FD), and refeeding (10, 30, 60 and 120 min) on NAPE-PLD activity (A), NAPE-PLD mRNA expression (B) and NAPE-PLD protein levels (B inset). *p < 0.05, **p < 0.01 vs FD, n = 6. C, Representative immunostaining showing the localization of NAPE-PLD in the duodenal epithelium and lamina propria of wild-type C57/BL6 mice. D, Absence of immunoreactive NAPE-PLD in corresponding structures of NAPE-PLD−/− mice; Scale bar, 50 μm.
Fig. 8.
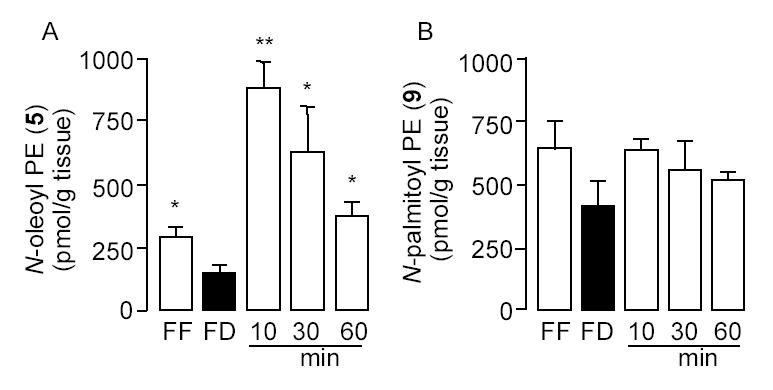
Feeding stimulates NAPE accumulation in the luminal layer of rat jejunum. Effects of free feeding (FF), 24-h food deprivation (FD), and refeeding (10, 30 and 60 min) on the levels of (A) 1-stearoyl,2-arachidonoyl-sn-glycero-3-phosphoethanolamine-N-oleyl (N-oleoyl PE, 5) and (B) 1-stearoyl,2-arachidonoyl-sn-glycero-3-phosphoethanolamine-N-pamitoyl (N-palmitoyl PE, 9), as assessed by LC/MSn. *p < 0.05, **p < 0.01 vs FD, n = 8–10.
Effects of nutrient availability on intestinal NAPE-PLD activity
NAPE-PLD catalyzes the conversion of NAPEs to OEA and other FAEs (Fig. 1). Using an LC/MS-based assay, we measured NAPE-PLD activity in homogenates of jejunal tissue obtained from free-feeding, food-deprived or food-deprived/refed rats. The results show that fasting decreases tissue NAPE-PLD activity, while refeeding rapidly reverses this effect (Fig. 9A). Quantitative RT-PCR and western blot analyses revealed a parallel, albeit slower change in jejunal NAPE-PLD mRNA (Fig. 9B) and protein levels (Fig. 9B inset). To confirm the presence of NAPE-PLD in the small intestine and determine its cellular localization, we immunostained sections of duodenal tissue from wild-type and NAPE-PLD-deficient (NAPE-PLD−/−) mice (24) using a selective polyclonal antibody raised against the N-terminal sequence of rat recombinant NAPE-PLD. The antibody specifically stained cellular elements in the duodenal epithelial layer and lamina propria from wild-type mice (Fig. 9C). Only background staining was observed in corresponding structures of NAPE-PLD−/− mice (Fig. 9D). The results indicate that (i) both NAPE-PLD activity and expression levels are regulated by nutrient availability, albeit with difference time-courses; and (ii) NAPE-PLD is expressed in intestinal enterocytes and lamina propria cells.
Effects of nutrient availability on intestinal FAAH activity
FAAH catalyzes the hydrolytic cleavage of OEA and other FAEs (Fig. 1). We determined the effects of nutrient availability on FAAH activity in membrane preparations of mucosal tissue from rat jejunum, using either [3H]-OEA or [3H]-anandamide as a substrate. Irrespective of the substrate used, fasting produced a remarkable increase in FAAH activity, which was completely reversed within 60 min of reexposure to food (Fig. 10A and data not shown). Quantitative RT-PCR and western blot analyses revealed parallel, but slower changes in jejunal FAAH mRNA (Fig. 10B) and protein levels (Fig. 10B inset). Beside FAAH, intestinal tissue contains other lipid hydrolases, including pancreatic lipase (31) and NAAA (22), which might contribute to the changes in OEA hydrolysis elicited by fasting and refeeding. Thus, to determine the role of FAAH in this response, we incubated jejunal membrane preparations from mucosal layer of food-deprived rats with the selective FAAH inhibitor URB597 (1 μM) (32), the pancreatic lipase inhibitor tetrahydrolipstatin (THL, 1 μM) (33), or the NAAA inhibitor N-cyclohexanecarbonylpentadecylamine (CPP, 100 μM) (34). URB597 inhibited [3H]-OEA hydrolysis by approximately 50%, whereas THL and CCP had little or no effect (Fig. 10C). To confirm the presence of FAAH in the small intestine and determine its cellular localization, we immunostained sections of duodenal tissue from wild-type and FAAH−/− mice with a commercial polyclonal antibody. The antibody specifically stained cellular elements in the epithelial layer and, to a minor extent, lamina propria of wild-type mouse duodenum (Fig. 10D). By contrast, only background staining was observed in corresponding structures from FAAH−/− mice (Fig. 10E). The findings outlined above suggest that (i) food deprivation markedly increases FAAH activity and expression; (ii) refeeding decreases FAAH activity, presumably through a post-translational mechanism; (iii) refeeding also reduces FAAH expression; (iv) like NAPE-PLD, FAAH is expressed in intestinal enterocytes and lamina propria cells; and (v) other hydrolase activities, beside FAAH, may contribute to feeding-regulated OEA hydrolysis.
Fig. 10.
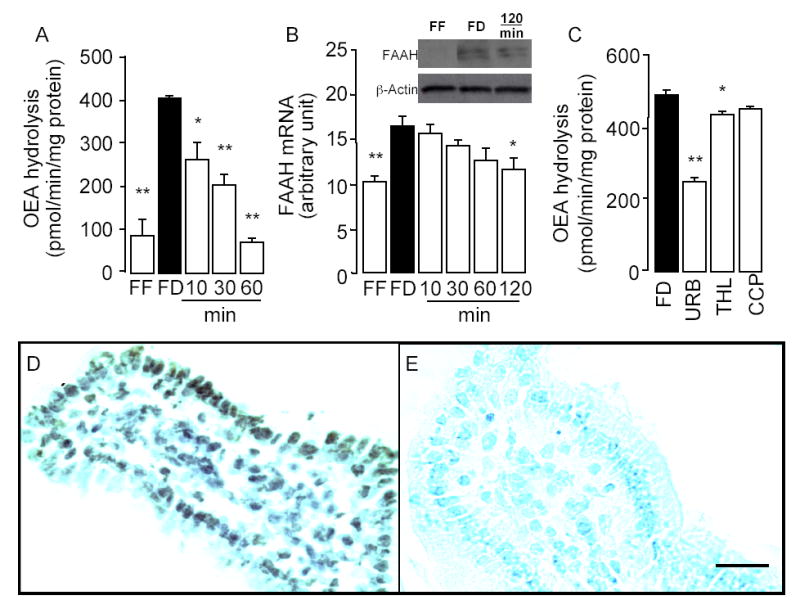
Feeding decreases FAAH activity and mRNA expression in rat jejunum. Effects of free feeding (FF), 24-h food deprivation (FD), and refeeding (10, 30, 60 and 120 min) on FAAH activity (A), FAAH mRNA expression (B) and FAAH protein levels (B inset). C, Effects of vehicle (FD, 0.1% DMSO), URB597 (URB, 0.1μM), THL (1μM) and CCP (5μM) on FAAH activity in intestinal mucosal layer of food-deprived rats. *p < 0.05; **p < 0.01 vs FD, n = 6. D, Representative immunostaining showing the localization of FAAH in the duodenal epithelium and lamina propria of wild-type C57/BL6 mice. E, Absence of immunoreactive FAAH in corresponding structures of FAAH−/− mice; Scale bar, 50 μm.
DISCUSSION
Intrinsic signals generated by the gut play critical roles in the regulation of feeding behavior and digestion. As ingested food transits through the small intestine, it stimulates nutrient-sensing endocrine cells to secrete biologically active peptides, which modulate feeding and aid in the digestion and absorption of nutrients (10). For example, fat and protein in the chyme interact with endocrine I cells in the duodenal and jejunal mucosa, causing the release of CCK-33 and CCK-8 into the bloodstream. These peptides engage type-1 CCK receptors located on vagal sensory fibers and visceral organs, initiating a coordinated physiological response that shortens the duration of an ongoing meal, modulates gastrointestinal motility, and induces gallbladder contraction and pancreatic secretion (9). In addition to its well-recognized ability to stimulate the release of regulatory peptides, food intake may also control the mobilization of lipid mediators such as OEA, the intestinal levels of which decrease during food deprivation and increase upon refeeding (3–5). However, despite the potential role of OEA as a lipid-derived satiety factor (3,13), the molecular mechanisms underlying OEA release in the gut remain largely undefined.
The present results demonstrate that feeding-dependent OEA mobilization is confined to the mucosal layer of the duodenal and jejunal wall, where the OEA-metabolizing enzymes NAPE-PLD and FAAH are localized. Our study further shows that food intake, in addition to mobilizing OEA, also enhances the formation of OEA-generating NAPEs, increases NAPE-PLD activity, and decreases FAAH activity. These changes in enzyme activity are likely to be caused by a combination of post-translational modifications – which appear to occur within minutes of food presentation – and more prolonged alterations in gene expression. Thus, nutrient availability may control OEA signaling in duodenal and jejunal mucosa by reciprocally regulating OEA biosynthesis – through activation of the NAT/NAPE-PLD pathway – and OEA hydrolysis – through downregulation of FAAH and, possibly, other as-yet-uncharacterized amidases. The physiological mechanism underlying these regulatory events remains to be determined, although its rapid time-course suggests the participation of neural or neurohumoral factors.
In a recent report, Petersen et al. (4) confirmed our earlier finding that food deprivation and refeeding regulate OEA and NAPE levels in the small intestine (3,13), but failed to observe any detectable change in NAPE-PLD and FAAH activities under those conditions. This discrepancy is likely due to methodological differences between studies. In particular, Petersen et al. conducted their analyses on membranes prepared from the entire small intestine, whereas we used either total homogenates, or luminal fractions from duodenum and jejunum, which are enriched in OEA-metabolizing enzymes. Nevertheless, future experiments using genetically modified mice and selective enzyme inhibitors will be necessary to establish the role of NAPE-PLD and FAAH in feeding-dependent OEA mobilization.
Beyond the plausible implication of the NAPE-PLD/FAAH pathway, suggested by our biochemical and immunostaining experiments, several aspects of feeding-dependent OEA mobilization remain to be elucidated. Three points appear to be particularly relevant. The first pertains to the selectivity with which food intake mobilizes OEA and various polyunsaturated FAEs, compared to their saturated counterparts PEA (16:0) and SEA (18:0). The finding of a parallel chemoselectivity in the biosynthesis of NAPEs suggests the existence of a regulatory step located upstream of NAPE-PLD; however, the identity of this hypothetical step remains unknown. The second point, related to the first, concerns the possible functions served by linoleoylethanolamide (18:2Δ9–12) and other polyunsaturated FAEs that are released together with OEA. Evidence indicates that these compounds may not affect food intake (4), raising the intriguing possibility that they might contribute to distinct aspects of intestinal OEA signaling, such as the regulation of fatty acid intake (35). The final point refers to the anatomical specificity of OEA signaling. The ability of food deprivation to inhibit OEA mobilization in the proximal intestine, and enhance it in liver and spleen, implies that OEA may be released in a tissue-restricted and stimulus-specific manner. Two additional results support this view. First, acute cold exposure stimulates OEA mobilization in rodent white adipose tissue, but has no such effect in small intestine, liver or skeletal muscle (36). This response is prevented in vivo by the β-antagonist propranolol and is reproduced in vitro by noradrenaline and the β-agonist isoproterenol, suggesting that it may be mediated by sympathetic activation of β-adrenoreceptors on adipose cells (36). Second, food deprivation and refeeding only modestly affect plasma OEA concentrations (Table 1), which at their highest level are 15–400 times lower than those expected to produce significant activation of PPAR-α (EC50 ≈ 120 nM) (13), GPR-119 (EC50 ≈ 3.2 μM) (8) or TRPV1 (EC50 ≈ 2 μM) (37). Together, these observations are consistent with the possibility that OEA may act as a paracrine signal rather than as a blood-borne hormone.
Previous work has shown that pharmacological administration of OEA delays meal initiation and prolongs the interval between successive meals, rather than reducing meal size (6,13). We report here that feeding-dependent OEA mobilization is confined to the innermost layers of the gut wall and is not accompanied by significant changes in circulating OEA levels. Thus, unlike classical satiety factors such as CCK – which are released into the bloodstream to terminate an ongoing meal – OEA may be produced and act within the gut to prolong the interval between successive meals. Such an action would be consistent with the pattern of OEA mobilization – which occurs after rather than during a meal – and is reminiscent of the physiological role proposed for PYY3–36, a member of the pancreatic family of polypeptides that is released postprandially and suppresses food intake for an extended time period (38).
Footnotes
The abbreviation used are: BSA, bovine serum albumin; EC50, half-maximal effective concentration; FAE, fatty-acid ethanolamide; FAAH, fatty-acid amide hydrolase; NAAA, N-acylethanolamide acid amidase; NAPE, N-acyl phosphatidylethanolamine; NAT, N-acyltransferase; NAPE-PLD, NAPE-specific phospholipase D; OEA, oleoylethanolamide; PEA, palmitoylethanolamide; SEA, stearoylethanolamide; PBS, phosphate buffered saline; PPAR-α; peroxisome proliferator-activated receptor-α.
We thank Mr. Kevin Eng for help with initial experiments, Dr. Faizy Ahmed for discussion on chromatographic separations, Dr. Gary Schwartz for critical discussion and Dr. Robert Edwards for expert advice on immunostaining. This research was supported by grants from the National Institute on Drug Abuse (to K.M and D.P.).
References
- 1.Broberger C. J Intern Med. 2005;258:301–327. doi: 10.1111/j.1365-2796.2005.01553.x. [DOI] [PubMed] [Google Scholar]
- 2.Lo Verme J, Gaetani S, Fu J, Oveisi F, Burton K, Piomelli D. Cell Mol Life Sci. 2005;62:708–716. doi: 10.1007/s00018-004-4494-0. [DOI] [PubMed] [Google Scholar]
- 3.Rodríguez de Fonseca F, Navarro M, Gómez R, Escuredo L, Nava F, Fu J, Murillo-Rodríguez E, Giuffrida A, LoVerme J, Gaetani S, Kathuria S, Gall C, Piomelli D. Nature. 2001;414:209–212. doi: 10.1038/35102582. [DOI] [PubMed] [Google Scholar]
- 4.Petersen G, Sorensen C, Schmid PC, Artmann A, Tang-Christensen M, Hansen SH, Larsen PJ, Schmid HH, Hansen HS. Biochim Biophys Acta. 2006;1761:143–150. doi: 10.1016/j.bbalip.2005.12.011. [DOI] [PubMed] [Google Scholar]
- 5.Astarita G, Rourke BC, Andersen JB, Fu J, Kim JH, Bennett AF, Hicks JW, Piomelli D. Am J Physiol Regul Integr Comp Physiol. 2006;290:R1407–1412. doi: 10.1152/ajpregu.00664.2005. [DOI] [PubMed] [Google Scholar]
- 6.Gaetani S, Oveisi F, Piomelli D. Neuropsychopharmacology. 2003;28:1311–1316. doi: 10.1038/sj.npp.1300166. [DOI] [PubMed] [Google Scholar]
- 7.Nielsen MJ, Petersen G, Astrup A, Hansen HS. J Lipid Res. 2004;45:1027–1029. doi: 10.1194/jlr.C300008-JLR200. [DOI] [PubMed] [Google Scholar]
- 8.Overton HA, Babbs AJ, Doel SM, Fyfe MC, Gardner LS, Griffin G, Jackson HC, Procter MJ, Rasamison CM, Tang-Christensen M, Widdowson PS, Williams GM, Reynet C. Cell Metab. 2006;3:167–175. doi: 10.1016/j.cmet.2006.02.004. [DOI] [PubMed] [Google Scholar]
- 9.Little TJ, Horowitz M, Feinle-Bisset C. Obes Rev. 2005;6:297–306. doi: 10.1111/j.1467-789X.2005.00212.x. [DOI] [PubMed] [Google Scholar]
- 10.Strader AD, Woods SC. Gastroenterology. 2005;128:175–191. doi: 10.1053/j.gastro.2004.10.043. [DOI] [PubMed] [Google Scholar]
- 11.Bale TL, Vale WW. Annu Rev Pharmacol Toxicol. 2004;44:525–557. doi: 10.1146/annurev.pharmtox.44.101802.121410. [DOI] [PubMed] [Google Scholar]
- 12.Proulx K, Cota D, Castaneda TR, Tschop MH, D’Alessio DA, Tso P, Woods SC, Seeley RJ. Am J Physiol Regul Integr Comp Physiol. 2005;289:R729–737. doi: 10.1152/ajpregu.00029.2005. [DOI] [PubMed] [Google Scholar]
- 13.Fu J, Gaetani S, Oveisi F, Lo Verme J, Serrano A, Rodriguez de Fonseca F, Rosengarth A, Luecke H, Di Giacomo B, Tarzia G, Piomelli D. Nature. 2003;425:90–93. doi: 10.1038/nature01921. [DOI] [PubMed] [Google Scholar]
- 14.Desvergne B, Wahli W. Endocr Rev. 1999;20:649–688. doi: 10.1210/edrv.20.5.0380. [DOI] [PubMed] [Google Scholar]
- 15.Kersten S, Wahli W. Experientia. 2000;89:141–151. doi: 10.1007/978-3-0348-8393-1_9. [DOI] [PubMed] [Google Scholar]
- 16.Berger J, Moller DE. Annu Rev Med. 2002;53:409–435. doi: 10.1146/annurev.med.53.082901.104018. [DOI] [PubMed] [Google Scholar]
- 17.Bocher V, Pineda-Torra I, Fruchart JC, Staels B. Ann N Y Acad Sci. 2002;967:7–18. doi: 10.1111/j.1749-6632.2002.tb04258.x. [DOI] [PubMed] [Google Scholar]
- 18.Wang X, Miyares RL, Ahern GP. J Physiol. 2005;564:541–547. doi: 10.1113/jphysiol.2004.081844. [DOI] [PMC free article] [PubMed] [Google Scholar]
- 19.Okamoto Y, Morishita J, Tsuboi K, Tonai T, Ueda N. J Biol Chem. 2004;279:5298–5305. doi: 10.1074/jbc.M306642200. [DOI] [PubMed] [Google Scholar]
- 20.Wang J, Okamoto Y, Morishita J, Tsuboi K, Miyatake A, Ueda N. J Biol Chem. 2006;281:12325–12335. doi: 10.1074/jbc.M512359200. [DOI] [PubMed] [Google Scholar]
- 21.McKinney MK, Cravatt BF. Annu Rev Biochem. 2005;74:411–432. doi: 10.1146/annurev.biochem.74.082803.133450. [DOI] [PubMed] [Google Scholar]
- 22.Tsuboi K, Sun YX, Okamoto Y, Araki N, Tonai T, Ueda N. J Biol Chem. 2005;280:11082–11092. doi: 10.1074/jbc.M413473200. [DOI] [PubMed] [Google Scholar]
- 23.Cravatt BF, Demarest K, Patricelli MP, Bracey MH, Giang DK, Martin BR, Lichtman AH. Proc Natl Acad Sci USA. 2001;98:9371–9376. doi: 10.1073/pnas.161191698. [DOI] [PMC free article] [PubMed] [Google Scholar]
- 24.Leung D, Saghatelian A, Simon GM, Cravatt BF. Biochemistry. 2006;45:4720–4726. doi: 10.1021/bi060163l. [DOI] [PMC free article] [PubMed] [Google Scholar]
- 25.Mor M, Rivara S, Lodola A, Plazzi PV, Tarzia G, Duranti A, Tontini A, Piersanti G, Kathuria S, Piomelli D. J Med Chem. 2004;47:4998–5008. doi: 10.1021/jm031140x. [DOI] [PubMed] [Google Scholar]
- 26.Giuffrida A, Rodriguez de Fonseca F, Piomelli D. Anal Biochem. 2000;280:87–93. doi: 10.1006/abio.2000.4509. [DOI] [PubMed] [Google Scholar]
- 27.Cadas H, di Tomaso E, Piomelli D. J Neurosci. 1997;17:1226–1242. doi: 10.1523/JNEUROSCI.17-04-01226.1997. [DOI] [PMC free article] [PubMed] [Google Scholar]
- 28.Schmittgen TD, Zakrajsek BA, Mills AG, Gorn V, Singer MJ, Reed MW. Anal Biochem. 2000;285:194–204. doi: 10.1006/abio.2000.4753. [DOI] [PubMed] [Google Scholar]
- 29.Twitchell W, Brown S, Mackie K. J Neurophysiol. 1997;78:43–50. doi: 10.1152/jn.1997.78.1.43. [DOI] [PubMed] [Google Scholar]
- 30.Gomez R, Navarro M, Ferrer B, Trigo JM, Bilbao A, Del Arco I, Cippitelli A, Nava F, Piomelli D, Rodriguez de Fonseca F. J Neurosci. 2002;22:9612–9617. doi: 10.1523/JNEUROSCI.22-21-09612.2002. [DOI] [PMC free article] [PubMed] [Google Scholar]
- 31.Lowe ME. Annu Rev Nutr. 1997;17:141–158. doi: 10.1146/annurev.nutr.17.1.141. [DOI] [PubMed] [Google Scholar]
- 32.Kathuria S, Gaetani S, Fegley D, Valino F, Duranti A, Tontini A, Mor M, Tarzia G, La Rana G, Calignano A, Giustino A, Tattoli M, Palmery M, Cuomo V, Piomelli D. Nat Med. 2003;9:76–81. doi: 10.1038/nm803. [DOI] [PubMed] [Google Scholar]
- 33.Shi Y, Burn P. Nat Rev Drug Discov. 2004;3:695–710. doi: 10.1038/nrd1469. [DOI] [PubMed] [Google Scholar]
- 34.Tsuboi K, Hilligsmann C, Vandevoorde S, Lambert DM, Ueda N. Biochem J. 2004;379:99–106. doi: 10.1042/BJ20031695. [DOI] [PMC free article] [PubMed] [Google Scholar]
- 35.Yang Y, Chen M, Georgeson KE, Harmon CM. Am J Physiol Regul Integr Comp Physiol. 2006 doi: 10.1152/ajpregu.00270.2006. doi: 10.1152/ajpregu.00270.2006. [DOI] [PubMed] [Google Scholar]
- 36.Loverme J, Guzman M, Gaetani S, Piomelli D. J Biol Chem. 2006;281:22815–22818. doi: 10.1074/jbc.M604751200. [DOI] [PubMed] [Google Scholar]
- 37.Ahern GP. J Biol Chem. 2003;278:30429–30434. doi: 10.1074/jbc.M305051200. [DOI] [PubMed] [Google Scholar]
- 38.Onaga T, Zabielski R, Kato S. Peptides. 2002;23:279–290. doi: 10.1016/s0196-9781(01)00609-x. [DOI] [PubMed] [Google Scholar]