

Abstract
We investigated the role of mouse adenovirus type 1 (MAV-1) early region 1A (E1A) protein in adenovirus respiratory infection. Intranasal (i.n.) inoculation of mice with wild type (wt) virus induced chemokine and cellular inflammatory responses in the lung. We observed similar responses in mice infected with an E1A-null mutant virus at the same dose, although the magnitude of these responses was lower. Levels of viral hexon gene expression were lower in the lung following infection with E1A-null virus than with wt virus. When input doses were adjusted so that equivalent viral loads were present following infection with varying doses of wt and E1A-null virus, we observed equivalent chemokine upregulation in the lung. Dissemination to the brain occurred following i.n. inoculation with equal doses of wt or E1A-null virus, but viral gene expression and viral loads were lower and the magnitude of chemokine responses was lower in brains of E1A-null virus-infected mice. CD4 and CD8 T cells and neutrophils were recruited to the brains of mice infected with either wt or E1A-null virus. Together, these data suggest that MAV-1 E1A makes important contributions to viral replication in the lung and the brain following i.n. inoculation. However, E1A is not essential for the induction of inflammatory responses in the lung or for viral dissemination out of the lung.
Introduction
Adenoviruses are common causes of respiratory infections, which can present with a wide range of clinical syndromes from mild upper respiratory tract infections to more severe manifestations such as necrotizing pneumonitis, bronchiolitis obliterans and hyperlucent lung syndrome (reviewed in Horwitz, 2001). In developing countries, adenoviruses are associated with severe acute pneumonia in children and are a major cause of morbidity and mortality (Kajon et al., 2003). Immunocompromised patients such as bone marrow transplant recipients are at risk for greatly increased morbidity and mortality from adenovirus infection (Hale et al., 1999; Walls et al., 2003). Evidence suggests that adenovirus infection plays a role in the pathogenesis of chronic lung disease such as asthma and chronic obstructive lung disease (COPD, reviewed in Hogg, 2001). Adenoviral DNA is found in respiratory epithelial cells in patients with COPD (Elliott et al., 1995; Matsuse et al., 1992), and adenovirus infection increases cigarette smoke-induced inflammation in the lungs of guinea pigs (Vitalis et al., 1998). There is growing interest in solidifying the links between adenovirus infection and chronic lung disease, both from the standpoint of understanding the pathogenesis of these disorders and developing novel therapies directed at either the virus or host responses induced or modulated by the virus.
Respiratory viral infection in humans and animal models has been associated with lung inflammation and the induction of chemokines critical to the inflammatory response (Bonville et al., 1999; Domachowske et al., 2000; Harrod et al., 1998; Miller et al., 2004; Miyazato et al., 2000; Tripp et al., 2000; Wareing et al., 2004; Weinberg et al., 2002). Relatively few studies have used in vivo animal models to examine chemokine responses to respiratory infection with human adenovirus (Harrod et al., 1998; Kajon et al., 2003). In vivo studies of human adenovirus pathogenesis are limited by the strict species-specificities of the adenoviruses.
Mouse adenovirus type 1 (MAV-1) is an excellent animal model system for studying adenovirus pathogenesis. The availability of numerous immunological reagents for mice, as well as a wide variety of immunocompetent, immunodeficient, transgenic and knockout mouse strains provides the means to define viral and host factors involved in both acute and persistent adenovirus infections. MAV-1 causes both acute and persistent infection in mice (Smith and Spindler, 1999). Intraperitoneal (i.p.) inoculation of C57BL/6 mice leads to a dose-dependent encephalomyelitis (Guida et al., 1995), with endothelial cell activation and vasculitis in the central nervous system (Charles et al., 1998; Guida et al., 1995; Kajon et al., 1998; Spindler et al., 2001). Persistent infection is established following i.p. inoculation of NIH Swiss outbred mice, with virus shed in the urine and viral DNA detected in the brain, spleen, lymph nodes and kidneys for up to 55 weeks post-infection (Smith et al., 1998). Following i.p. infection, virus can be detected in multiple organs, including lung, spleen, brain, kidney and lymph nodes, between 7 and 17 dpi (Kajon et al., 1998). MAV-1 organ tropism following intranasal (i.n.) inoculation is identical to that observed following i.p. inoculation, which is the more commonly used route of inoculation in MAV-1 studies (Kajon et al., 1998).
The immune response to acute MAV-1 infection is multifaceted. Neutralizing antibodies develop by 6 dpi (Moore et al., 2004). T cells are critical both for the acute immunopathology observed in MAV-1-induced encephalomyelitis and for long-term host survival following i.p. infection (Moore et al., 2003). Mice lacking B cells or Bruton’s tyrosine kinase (Btk) are highly susceptible to acute MAV-1 infection (Moore et al., 2004), indicating that B cells also play a critical role in MAV-1 pathogenesis. By 4 days post-infection (dpi), increased levels of cytokine and chemokine transcripts are present in the brains of C57BL/6 mice infected i.p. (Charles et al., 1999a; Charles et al., 1999b). Inflammatory responses to MAV-1 respiratory infection have not been described in as much detail. Following i.n. inoculation of newborn mice with 2 x 10⁶ plaque forming units (PFU) of MAV-1, Gottlieb et al. demonstrated peribronchiolar infiltrates comprised of macrophages and lymphocytes at 3 dpi (Gottlieb and Villarreal, 2000), whereas little inflammation was present in the lungs of adult NIH Swiss outbred mice following i.n. inoculation of 103 PFU (Kajon et al., 1998). Using i.n. inoculation of adult mice with 105 PFU, we demonstrated MAV-1 protein in respiratory epithelial cells, persistence of viral DNA in the lungs up to 21 dpi, and chemokine upregulation in the lung between 7 and 14 dpi (Weinberg et al., 2005).
Adenovirus early region 1A (E1A) proteins are transcriptional regulators of gene expression. E1A proteins exert their control on gene expression by interacting with cellular proteins through three conserved domains, conserved region (CR)1, CR2 and CR3. These interactions may influence cellular inflammatory responses via the activation of transcription factors such as NF-κB (Schmitz et al., 1996) and activating protein (AP)-1 (Kleinberger and Shenk, 1993; Muller et al., 1989). Clinical and experimental animal data have provided the basis for postulating that the human adenovirus E1A protein is responsible for immunomodulatory effects contributing to chronic lung diseases (reviewed in Hogg, 2001). MAV-1 early region 1 encodes three overlapping mRNAs, one of which corresponds to the E1A 289 aa protein and encodes a 200 aa protein (Ball et al., 1989). The MAV-1 E1A protein sequence has approximately 40% sequence similarity compared to the human adenovirus E1A 289 aa protein in CR1, CR2 and CR3 (Ball et al., 1989). MAV-1 E1A shares functional roles with human adenovirus E1A, for example, binding to the mouse cellular proteins retinoblastoma protein (pRb), pRb-related proteins p107 and p130, and Sur2 (Fang and Spindler, 2005; Fang et al., 2004; Smith et al., 1996) and transactivating the human adenovirus type 5 E3 promoter (Ball et al., 1988). The MAV-1 model is therefore well suited to use in the study of adenovirus E1A-mediated effects on pulmonary pathophysiology.
As regulators of both viral and cellular gene transcription, adenovirus E1A proteins likely make major contributions to viral pathogenesis. In this study, we used i.n. infection of C57BL/6 mice with an E1A-null mutant MAV-1 to assess the role of MAV-1 E1A in both the induction of inflammatory responses in the lung and brain and the dissemination of virus to the brain following acute respiratory infection. We demonstrate that E1A-null virus induces less inflammation in the lungs and brain than wt virus, most likely due to a replication defect rather than an absence of direct MAV-1 E1A effects on host inflammatory responses. Furthermore, although viral gene expression and viral loads were lower in brains of E1A-null virus-infected mice, we show that MAV-1 E1A is not essential for the spread of virus from lung to brain following i.n. inoculation. Thus, the effects of MAV-1 E1A on acute inflammatory responses and dissemination from the lung to the brain are most likely indirect, via contributions of E1A to MAV-1 replication.
Results
Lung chemokine responses to acute respiratory infection
To determine the contributions of MAV-1 E1A to lung inflammatory responses elicited by MAV-1, we used ribonuclease protection assay (RPA) to quantify chemokine responses in the lungs of mock-infected mice or mice infected i.n. with either wt MAV-1 or the E1A-null mutant, pmE109. As we have previously demonstrated (Weinberg et al., 2005), there was minimal upregulation of chemokine gene expression prior to 7 dpi in the lungs of any mice (Fig. 1B). Infection with 105 PFU wt MAV-1, but not mock infection, upregulated the expression of multiple chemokines in the lungs at 7 dpi (Fig. 1A). This was true for both the CXC chemokines (MIP-2 and IP-10) and the CC chemokines (RANTES, MIP-1α, MIP-1β, MCP-1, TCA-3, eotaxin) that were measured. By 15 dpi, levels of expression of chemokine genes had decreased in the lungs of mice infected with wt MAV-1, but were elevated compared to levels measured in mock-infected mice (Fig. 1B and data not shown).
Fig. 1.

Chemokine responses to respiratory infection. Chemokine gene expression and protein production were measured in the lungs of mice infected i.n. with 105 PFU of wt MAV-1 or pmE109. Animals mock infected with conditioned media were included as controls. (A) Representative assay demonstrating detection by RPA of chemokine gene expression in the lungs of infected mice at 7 dpi. Each lane represents data obtained from a separate mouse. (B) Kinetics of chemokine gene expression in the lung for representative chemokine genes over the course of acute lung infection. Quantified PhosphorImager data are presented as percentages of the expression of the L32 housekeeping gene. Mean values and standard deviations are presented for between 3 and 7 mice per group at each time point. Statistical significance between groups was determined using ANOVA with subsequent Newman-Keuls analysis between pairs where appropriate (* P < 0.05 and ** P < 0.01 compared to mock-infected mice; † P < 0.05 and †† P < 0.01 compared to pmE109-infected mice). (C) ELISA measurement of protein levels of representative chemokines in the lungs of infected mice. P values represent statistical significances between groups determined using ANOVA with subsequent Newman-Keuls analysis between pairs where appropriate.
Infection with the same dose (105 PFU) of pmE109 also upregulated chemokine gene expression in the lung. Similar to infection with wt MAV-1, chemokine responses to pmE109 infection were first detected at 7 dpi (Figs. 1A and 1B). Levels of chemokine gene expression had decreased by 15 dpi for the majority of chemokines measured, although levels of MCP-1 expression remained stable at 15 dpi following infection with pmE109 (Fig. 1B). The overall kinetics of chemokine upregulation were similar in the lungs of mice infected with wt virus or pmE109, though the magnitude of the response was significantly lower following infection with pmE109 at both 7 and 15 dpi.
We used ELISA to verify that changes in chemokine gene expression following i.n. infection with wt virus or pmE109 were reflected in corresponding changes in chemokine protein production. Levels of two representative chemokines, RANTES and MCP-1, were measured in lung homogenates at 7 dpi, the peak of chemokine upregulation as measured by RPA. In both cases, levels of chemokine protein were significantly greater in the lungs of mice infected with wt virus than in mice infected with pmE109. Levels of RANTES and MCP-1 protein were greater in the lungs of mice infected with pmE109 than in mock-infected mice, but these differences were not statistically significant (Fig. 1C).
Lung cellular inflammatory responses to acute respiratory infection
Chemokines mediate the recruitment of a variety of cell types involved in the host response to viruses and other pathogens (Luster, 1998). Because we saw greater chemokine upregulation following i.n. infection with wt virus compared to pmE109, we predicted that cellular inflammatory responses in the lung would also differ. We examined hematoxylin and eosin-stained sections of lungs harvested at various time points following infection of mice with wt virus or the E1A-null mutant (Fig. 2). No inflammatory response was present at any time point in the lungs of mock-infected mice or earlier than 7 dpi in the lungs of mice infected with either virus (data not shown). Consistent with data presented in our previous report (Weinberg et al., 2005), a patchy cellular infiltrate was present throughout the lungs of mice infected with wt MAV-1 at 7 and 15 dpi (Fig. 2). This cellular infiltrate was predominantly focused around larger airways in the lung, although scattered areas of hypercellularity were also present in alveolar walls at this these time points. In contrast, lungs of mice infected with pmE109 at 7 dpi more closely resembled the lungs of mock-infected mice, with a relative paucity of cellular inflammation. By 15 dpi, an increased but still comparatively mild infiltrate was present in the lungs of pmE109-infected mice. Again, this infiltrate tended to be focused around larger airways, although scattered areas of hypercellularity were also present in other areas of the lung (Fig. 2, inset). Thus, the intensity of cellular inflammatory responses in the lung correlated with chemokine upregulation induced by wt MAV-1 or pmE109 infection, but the responses were not qualitatively different in wt virus- and pmE109-infected mice.
Fig. 2.

Lung cellular inflammatory responses to respiratory infection. Hematoxylin and eosin-stained sections of lungs of mock-infected mice and mice infected with 105 PFU of wt MAV-1 or pmE109 at 7 and 15 dpi. Inset at lower right panel represents a separate field from the same lung of a pmE109-infected mouse at 15 dpi. Scale bar, 100 μm.
Detection of virus in the lung
To verify the presence of virus in infected mice, we harvested total RNA from lungs of mice at multiple time points and used RPA to detect expression of the MAV-1 hexon gene. We did not detect hexon gene expression at any time point in the lungs of mock-infected mice. Hexon expression was readily detected in the lungs of mice infected with 105 PFU of wt virus or pmE109 at 7 dpi (Fig. 3A) but not at 15 dpi (data not shown). At 7 dpi, quantified levels of lung hexon gene expression were greater in mice infected with wt virus than with the E1A-null mutant, pmE109, although this difference was not statistically different (Fig. 3B).
Fig. 3.

Detection of viral gene expression in the lung. Expression of the MAV-1 hexon gene was measured by RPA in the lungs of mice at 7 dpi. (A) Protected probe fragments for hexon and the L32 housekeeping gene are shown from RNA isolated from lungs of mock-infected mice and mice infected with 105 PFU of wt MAV-1 or pmE109. (B) Quantified PhosphorImager data from the mice in Figure 3A are presented as a percentage of L32 expression. Circles represent values for individual mice and horizontal bars represent mean values for each group.
Effects of differing inoculum doses on chemokine induction
Because the mean level of hexon gene expression was lower at 7 dpi in pmE109-infected mice than in wt virus-infected mice, it is possible that an in vivo replication defect caused by the absence of E1A rather than the absence of a direct effect of E1A on the induction of inflammatory responses was responsible for the observed differences in chemokine upregulation in the lung following i.n. infection with wt or mutant virus. To evaluate this possibility, we conducted an experiment in which mice were infected with 104 or105 PFU of wt MAV-1, or 105 PFU of pmE109. We used RPA to quantify chemokine gene expression in the lungs of these mice at 7 dpi, the time of peak chemokine responses in the lung. As in Fig. 1, the expression of representative chemokine genes was greater in the lungs of mice infected with 105 PFU of wt virus than in mice infected with 105 PFU of pmE109 (Fig. 4A). Levels of chemokine gene expression in the lungs of mice were correspondingly lower in the lungs of mice infected with 104 PFU than with 105 PFU of wt MAV-1, and were similar to those measured in the lungs of mice infected with 105 PFU of pmE109 (Fig. 4A).
Fig. 4.

Effects of inoculum doses on chemokine induction and viral load. Mice were infected i.n. with 104 or 105 PFU of wt MAV-1 or 105 PFU of pmE109 and evaluated at 7 dpi. (A) Quantified levels of representative chemokine gene expression in the lungs of infected mice are presented as percentages of L32 expression. Mean values and standard deviations are presented for 3 mice per group. (B) Quantitative real-time PCR was used to measure copy number of the MAV-1 hexon gene in DNA extracted from the lungs of the same infected mice. Circles represent copy numbers in individual mice and horizontal bars represent arithmetic mean values for each group. P values represent statistical significances between groups determined using ANOVA with subsequent Newman-Keuls analysis between pairs where appropriate.
To determine whether the absence of E1A resulted in lower levels of viral genome in the lungs of mice infected with pmE109 compared to wt virus when chemokine responses were similar (Fig. 4A), we used sensitive quantitative real-time PCR (qPCR) to compare viral genome levels in the lungs of these mice (Fig. 4B). Primers were designed to amplify a segment of the MAV-1 hexon gene, which is present in both wt MAV-1 and pmE109. Viral genomes were detected in the lungs of mice infected with both 104 and 105 PFU of wt MAV-1 and with 105 PFU of pmE109 (Fig. 4B). The viral load in the lungs following infection with 105 PFU of pmE109 was lower than that following 105 PFU of wt MAV-1. As expected, the viral load in the lung following infection with 104 PFU of MAV-1 was also lower than that following infection with 105 PFU of wt MAV-1, and although it was somewhat higher than that following infection with 105 PFU of pmE109, this difference was not statistically significant. Together, these data suggest that lower levels of chemokine upregulation in the lung following infection with pmE109 occur because less virus is present, likely due to an in vivo replication defect in the lungs in the absence of MAV-1 E1A.
In vitro replication of wild type and E1A-deficient MAV-1
To test the possibility that the E1A-null virus replicates less well than wt virus in mouse lung cells, we analyzed viral gene expression in two cell lines relevant to a model of pulmonary inflammation. The MH-S cell line is a mouse alveolar macrophage cell line (Mbawuike and Herscowitz, 1989), and the LA-4 cell line is a mouse alveolar epithelial cell-like cell line (Stoner et al., 1975). We infected monolayers of each cell type with wt MAV-1 or pmE109 at both low (0.1) and high (5) MOIs and harvested total RNA from the cells at 48 hours post infection (hpi). We used RPA to detect hexon gene expression. Quantified levels of hexon gene expression did not differ between wt virus- and pmE109-infected MH-S cells at either MOI (Fig. 5A). In LA-4 cells, levels of hexon gene expression were substantially greater than in MH-S cells following infection with both viruses (compare Y axis in Fig. 5A to 5B). Levels of hexon gene expression in pmE109-infected LA-4 cells were significantly lower than in wt virus-infected cells at the low MOI of 0.1 (Fig. 5B). Levels of hexon gene expression in pmE109-infected LA-4 cells were higher compared to wt virus-infected LA-4 cells at the high MOI of 5. This difference was small but statistically significant (Fig. 5B). This pattern in LA-4 cells was like that in NIH 3T6 cells, in which a replication defect was seen following pmE109 infection at low, but not high, MOIs (Fang and Spindler, 2005).
Fig. 5.

In vitro replication of wild type and E1A-null MAV-1. Using RPA, MAV-1 hexon gene expression was measured in (A) MH-S and (B) LA-4 cells 48 hours following infection with wt MAV-1 or pmE109 at the indicated MOI. Quantified PhosphorImager data are presented as a percentage of L32 expression. Means and standard deviations of three replicates per group are presented. Statistical significance between groups was determined using Student’s t test (* P < 0.05 and † P < 0.01).
Detection of virus in the brain following intranasal infection
The central nervous system (CNS) is one of the principal targets of MAV-1 infection (Guida et al., 1995; Kring et al., 1995). MAV-1 produces CNS symptoms (ataxia, hyperreflexia, hyperesthesia, paresis and flaccid paralysis) following i.p. inoculation in outbred mice (Kring et al., 1995). MAV-1 localizes to vascular endothelium in the brain following both i.p. and i.n. inoculation (Charles et al., 1998; Kajon et al., 1998), and i.p. MAV-1 infection of susceptible mouse strains produces a fatal hemorrhagic encephalomyelitis (Guida et al., 1995). Although the 50% lethal dose of pmE109 is higher than that of wt MAV-1 following i.p. infection of Swiss outbred mice (Smith et al., 1998), pmE109 was found in the same organs, including the brain, as wt MAV-1 following i.p. infection with 104 PFU (Smith et al., 1998). However, at a lower dose of 1 PFU, pmE109 did not reach the brain by 14 dpi, whereas wt MAV-1 did (Smith et al., 1998).
We assessed the role of MAV-1 E1A on spread of virus to the brain in inbred mice following i.n. inoculation with 105 PFU of wt MAV-1 or pmE109 using RPA to detect hexon gene expression. Hexon gene expression was not detected by RPA in RNA extracted from brains at any time point prior to 11 dpi (data not shown). At 11 dpi, hexon gene expression was detected in the brains of mice infected with both wt virus and pmE109 (Fig. 6A), and it was higher in the brains of wt virus-infected mice. Hexon expression in the brain at 15 dpi was lower and did not differ between groups (Fig. 6A). Hexon gene expression was not detectable by RPA in any mice at 22 dpi (data not shown).
Fig. 6.

Detection of virus in the brain following intranasal infection. Viral gene expression and viral load were measured in the brains of mice infected i.n. with 105 PFU or wt MAV-1 or pmE109. (A) Expression of the MAV-1 hexon gene was measured by RPA. Quantified PhosphorImager data are presented as a percentage of L32 expression. Mean values and standard deviations are presented for between 4 and 7 mice per group at each time point. (B) Quantitative real-time PCR was used to measure copy number of the MAV-1 hexon gene in DNA extracted from the brains of infected mice. Squares and triangles represent copy numbers in individual wt MAV-1-infected and pmE109-infected mice, respectively. Horizontal bars represent mean values for each group. P values represent statistical significances between groups determined using Student’s t test.
To verify the RPA data in the brain, we used qPCR to measure viral loads at the same time points. Viral load levels showed the same pattern as hexon gene expression levels. At 11 dpi, viral genomes were detected in both wt virus-infected and pmE109-infected mice (Fig. 6B). The viral loads were significantly higher in the brains of wt virus-infected mice than in pmE109-infected mice. Brain viral loads were equivalent between the two groups at 15 dpi. Even though viral gene expression was not detected by RPA in the brain at 22 dpi, viral genomes were detected by qPCR at this time point in the brains of both wt virus-infected and pmE109-infected mice (Fig. 6B). Viral loads at 22 dpi were greater in the brains of wt virus-infected mice than in pmE109-infected mice, although this was not a statistically significant difference.
Brain chemokine responses following intranasal infection
Chemokine responses induced in the brain by acute MAV-1 infection following i.p. inoculation have been described (Charles et al., 1999a). In that report, upregulated expression of multiple chemokines was noted over the first 96 hours post-infection in C57BL/6 mice (Charles et al., 1999a). IP-10, MCP-1 and TCA-3 were the most prominently expressed chemokines following i.p. inoculation (Charles et al., 1999b). We examined brain chemokine expression induced by i.n. infection with wt and E1A-null mutant virus to determine whether E1A influences brain chemokine responses. We used RPA to detect chemokine gene expression in total RNA isolated from brains at multiple time points following infection. Chemokine gene mRNA expression was not detected in the brains of mock-infected mice at any time point, and was not detected in the brains of mice infected with wt virus or pmE109 at 1, 4 or 7 dpi (data not shown). At 11 dpi, the expression of multiple chemokine gene mRNAs was upregulated in wt virus-infected and pmE109-infected mice, although the magnitude of upregulation was greater in wt virus-infected mice (Fig. 7A).
Fig. 7.
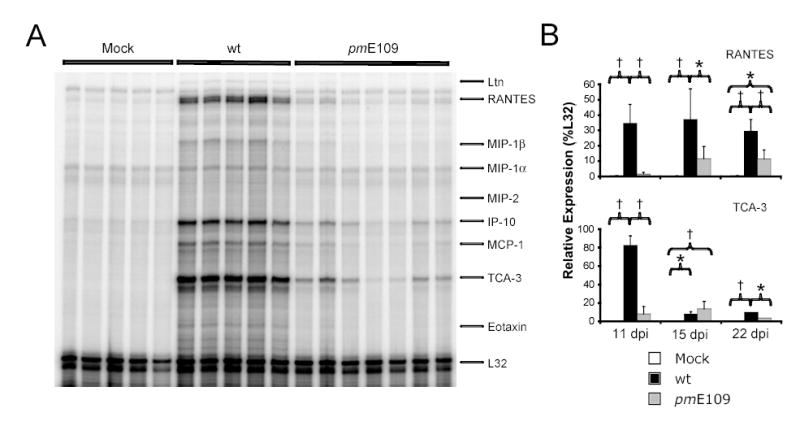
Brain chemokine responses following intranasal infection. Chemokine gene expression was measured in the brains of mice infected i.n. with 105 PFU of wt MAV-1 or pmE109. Animals mock infected with conditioned media were included as controls. Each lane represents data obtained from a separate mouse. (A) Representative assay demonstrating detection by RPA of chemokine gene expression in the brains of infected mice at 11 dpi. (B) Kinetics of chemokine gene expression in the brain for representative chemokine genes over the course of acute infection from three separate infection experiments analyzed as in A. Quantified PhosphorImager data are presented as percentages of the expression of the L32 housekeeping gene. Mean values and standard deviations are presented for between 4 and 7 mice per group at each time point. Statistical significance between groups was determined using ANOVA with subsequent Newman-Keuls analysis between pairs where appropriate (* P < 0.01 and † P < 0.001).
The kinetics of chemokine mRNA expression for RANTES and TCA-3, two of the most highly expressed chemokine genes in the MAV-1-infected brain, are presented in Figure 7B. Following the initial upregulation detected at 11 dpi, RANTES gene mRNA expression remained stably elevated in the brains of wt virus-infected mice at both 15 and 22 dpi. In the brains of pmE109-infected mice, levels of RANTES gene expression increased between 11 and 15 dpi and then remained stable between 15 and 22 dpi. Throughout this time course, levels of RANTES gene expression were lower in the brains of pmE109-infected mice than in wt virus-infected mice. TCA-3 gene expression was also upregulated at 11 dpi in the brains of mice infected with wt virus or pmE109 compared to mock-infected mice, though wt virus infection induced a greater TCA-3 response than did pmE109 (Fig. 7A and Fig. 7B). By 15 dpi, TCA-3 expression had decreased to similar levels in the brains of both wt virus-infected and pmE109-infected mice, although it remained above baseline levels measured in mock-infected mice. TCA-3 expression remained slightly elevated in the brains of mice from both groups at 22 dpi. At this time point, TCA-3 expression was significantly greater in brains of wt virus-infected mice than in pmE109-infected mice, although the difference was relatively small. Expression of other chemokines measured followed patterns similar to those described for TCA-3 (data not shown). Interestingly, RANTES was the only chemokine measured whose expression remained substantially upregulated up to 22 dpi.
Brain cellular inflammatory responses following intranasal infection
We have previously shown that T cells play a crucial role in MAV-1-induced CNS immunopathology following i.p. infection (Moore et al., 2003). The pattern of chemokine upregulation that we detected in the brains of mice following i.p. infection with either wt virus or pmE109 suggested that T cells were also recruited to the brain following i.n. infection. To verify this possibility, a group of mice were mock infected or infected i.n. with 105 PFU of wt virus or pmE109. We assessed cellular inflammation present in hematoxylin and eosin-stained sections of brains (Fig. 8). No infiltrate was present in the brains of mock-infected mice at 11 or 15 dpi. At 11 dpi, a mononuclear cell infiltrate was observed surrounding scattered small blood vessels in the brains of wt virus-infected mice. Similar perivascular cuffing was present in the brains of mice infected with pmE109, although involved blood vessels were less common in these animals. Mononuclear cell infiltrates surrounding blood vessels were also present at 15 dpi in the brains of mice infected with wt virus or pmE109, but again was again less common in the brains of pmE109-infected mice compared to wt virus-infected mice.
Fig. 8.

Brain cellular inflammatory responses following intranasal infection. Hematoxylin and eosin-stained sections of brains of mock-infected mice and mice infected with 105 PFU of wt MAV-1 or pmE109 at 11 and 15 dpi. Arrows indicate blood vessels within each image. Scale bar, 200 μm.
We indirectly phenotyped the cells infiltrating the brain using RPA to quantify the expression of genes encoding the leukocyte cell surface markers CD4 and CD8 (T cells), CD19 (B cells) and F4/80 (macrophages). Expression levels of genes encoding CD4, CD8α, CD19 and F4/80 were very low and did not change over time in the brains of mock-infected mice (Fig. 9A). There was little difference in expression levels of any of the genes measured in brains of wt virus- or pmE109-infected mice compared to mock-infected mice at 7 dpi. At 11 dpi, we detected increases in the expression of genes encoding CD4, CD8α, CD19 and F4/80 in the brains of mice infected with wt virus compared to mock-infected mice, but not in the brains of pmE109-infected mice (Fig. 9A). Expression of all four genes peaked at 15 dpi in the brains of wt virus-infected mice, and at 22 dpi they remained elevated over levels detected in mock-infected mice (Fig. 9A). Expression levels of these same genes were greater in the brains of pmE109-infected mice than in mock-infected mice at 15 and 22 dpi, but these levels remained below those measured in the brains of wt virus-infected mice (Fig. 9A).
Fig. 9.

Characterization of brain cellular inflammatory responses. Chemokine gene expression was measured in the brains of mice infected i.n. with 105 PFU of wt MAV-1 or pmE109. Animals mock infected with conditioned media were included as controls. (A) Expression of genes encoding leukocyte cell surface markers was measured by RPA. Quantified PhosphorImager data are presented as a percentage of L32 expression. Mean values and standard deviations are presented for between 4 and 7 mice per group at each time point and include analysis of one infection experiment per time point at 7, 11 and 22 dpi and two separate infection experiments at 15 dpi. Statistical significance between groups was determined using ANOVA with subsequent Newman-Keuls analysis between pairs where appropriate (* P < 0.05, ** P < 0.01 and *** P < 0.001 compared to mock infected mice; † P < 0.05, †† P < 0.01 and ††† P < 0.001 compared to pmE109-infected mice). (B) Flow cytometry was used to detect percentages of specific leukocyte subtypes in cell suspensions generated from mock-infected mice or mice infected i.n. with 105 PFU of wt MAV-1 or pmE109 at 15 dpi. Mean values and standard deviations are presented for 4 mice per group. Where not seen, error bars are too small to be distinguished. P values were determined using ANOVA with subsequent Newman-Keuls analysis between pairs where appropriate.
We used flow cytometry to verify the phenotype of the inflammatory cells present in the brains of infected mice at 15 dpi. Single-cell suspensions of brain homogenates were stained with monoclonal antibodies to detect CD4 and CD8, CD19, F4/80 and Ly6 (neutrophils). The percentage of CD8-positive cells was greater in brains of mice infected with wt virus or pmE109 than in brains mock-infected mice (Fig. 9B). Likewise, the percentage of CD4-positive cells was greater in brains of mice infected with wt virus or pmE109, although the difference between mock-infected and wt virus-infected mice was not statistically significant (Fig. 9B). The percentage of Ly6-positive cells was also greater in the brains of mice infected with wt virus or pmE109 (Fig. 9B). Interestingly, the percentage of CD19-positive cells was decreased in brains of mice infected with wt virus or pmE109 compared to mock-infected mice (Fig. 9B). F4/80-positive cells were not detected by flow cytometry in the brains of any mice at 15 dpi (data not shown).
Discussion
Acute adenovirus respiratory infection is associated with a wide range of clinical presentations and can be a cause of substantial morbidity and mortality (Horwitz, 2001). In addition, adenovirus infection may contribute to the pathogenesis of some chronic lung diseases (Hogg, 2001). MAV-1 provides a model to study the pathogenesis of respiratory infection by an adenovirus in its natural host. In this report, we examined the role of the MAV-1 E1A gene product in inflammatory responses to acute MAV-1 infection. We found that i.n. inoculation of C57BL/6 mice with an E1A-null mutant MAV-1 resulted in less chemokine induction and cellular inflammation in the lungs than did inoculation with wt MAV-1. CNS infection occurs following i.n. inoculation with wt virus (Kajon et al., 1998), and we showed for the first time that CNS infection also occurs following i.n. inoculation with an E1A-null mutant virus (Fig. 6). Chemokine gene expression was induced in the brains of mice infected with either wt or mutant virus, but the magnitude of this response was lower in brains of mice infected with the same dose of mutant virus.
Cellular immune responses are critical for the control of respiratory viral infections. Lung chemokine responses have been described following respiratory challenge with a variety of viruses including respiratory syncytial virus, influenza virus, murine gammaherpesvirus 68 (MHV-68) and MAV-1 (Bonville et al., 1999; Domachowske et al., 2000; Miller et al., 2004; Miyazato et al., 2000; Tripp et al., 2000; Wareing et al., 2004; Weinberg et al., 2002; Weinberg et al., 2005). Impaired chemokine function affects the pathogenesis of respiratory viral infection. CCR5 −/− mice infected with influenza A display higher mortality rates and more lung pathology than do wt controls, while influenza-infected CCR2 −/− mice are protected from early pathological effects of infection, potentially due to impaired macrophage accumulation in the lungs of CCR2 −/− mice (Dawson et al., 2000). CCR2 −/− mice infected with MHV-68 have decreased macrophage accumulation, increased necrosis and increased neutrophil accumulation compared to BALB/c control mice (Cadillac et al., 2005).
In this report, we demonstrate a cellular response in the lungs following infection with both wt and E1A-null MAV-1 (Fig. 2). As we previously reported for wt virus (Weinberg et al., 2005), this appears to be a predominantly mononuclear infiltrate for E1A-null virus. Chemokines serve as chemoattractants for a wide variety of cells involved in host inflammatory responses. The chemokines that were most highly upregulated in the lungs following infection with wt MAV-1 included the CC chemokines RANTES, MCP-1 and TCA-3 and the CXC chemokine IP-10 (Figs. 1A and 1B). This was similar to patterns of chemokine upregulation observed following i.n. infection with a number of other viruses including respiratory syncytial virus (Miller et al., 2004), influenza virus (Wareing et al., 2004) and murine gammaherpesvirus 68 (Weinberg et al., 2002). The combined effect of these chemokines would be to attract a population of cells to the lungs including T lymphocytes, NK cells, monocytes and dendritic cells (Luster, 1998), suggesting roles for these cell types in the control of MAV-1 respiratory infection.
RANTES, MCP-1, TCA-3 and IP-10 were also the chemokines that were most highly upregulated in the brain following infection with both wt and E1A-null virus (Figs. 7A and 7B). The kinetics of chemokine upregulation in the brain were delayed compared to chemokine upregulation in the lung, reflecting the fact that viral gene expression and viral genome were not detected until 11 dpi in the brain (Figs. 6A and 6B). T lymphocyte responses contribute to the immunopathology observed in the CNS following i.p. infection with wt MAV-1, but are also important for long-term survival of infected mice (Moore et al., 2003). The pattern of chemokine upregulation in the brain described in this report following i.n. inoculation suggests that T lymphocytes and potentially monocytes and macrophages contribute to host inflammatory responses to CNS infection following i.n. inoculation. Consistent with this, the histological data, flow cytometry data and RPA data indicated that CD8 T cells and to a lesser extent CD4 T cells were increased in the brains of mice infected with wt virus or pmE109 (Figs. 8 and 9). F4/80 gene expression was upregulated in the brains of infected mice, suggesting that there was also an influx of macrophages. F4/80-positive cells were not detected in the brains of mice using flow cytometry, potentially due to small numbers of these cells or technical issues involving the specific antibody used. The patterns of chemokine upregulation correlated with the qualitative amount of cellular inflammation seen in the brains of mice infected with wt virus or pmE109; there was less inflammation in brains of pmE109-infected mice but the types of cells present were similar to those with wt virus infection.
Mice deficient in B cells demonstrate increased susceptibility to MAV-1 infection (Moore et al., 2004). Consistent with a role of B cells in the control of acute MAV-1 infection, we demonstrated upregulation of CD19 gene expression in the brains of wt virus- and pmE109-infected mice by RPA analysis (Fig. 9A). However, the percentage of CD19-positive cells measured by flow cytometry was decreased in the brains of infected mice at 15 dpi (Fig. 9B). It is possible that this difference was due to technical reasons, as the brains of mice were not perfused to remove peripheral blood cells prior to RNA extraction, whereas brains were perfused prior to homogenization and staining for flow cytometry. Similar discrepancies were not observed for CD4 and CD8, arguing against this explanation. Alternatively, technical issues with the antibody used to detect CD19-positive cells may have reduced the sensitivity of flow cytometry in this particular experiment.
Interestingly, we also detected an increased percentage of neutrophils in the brains of infected mice (Fig. 9C). We have previously reported a neutrophilic response in bronchoalveolar lavage fluid obtained at 7 dpi from the lungs of mice infected with wt MAV-1 (Weinberg et al., 2005). In each case, it is possible that neutrophils may be recruited to sites of virus-induced inflammation by the increased levels of IP-10, and to a lesser extent MIP-1α and MIP-2, detected in lung (Fig. 1 and Weinberg et al., 2005) and brain (Fig. 7), or by other chemokines not included in the riboprobe template set we used. It is possible that neutrophils have direct antiviral activity, but it is more plausible that they make indirect contributions to the control of MAV-1 infection. This may be by promoting the loss of blood brain barrier integrity (Zhou et al., 2003) or by secreting proinflammatory cytokines (Scapini et al., 2000) in order to attract other cells responsible for controlling viral infection.
By 22 dpi, expression levels of most chemokines measured in the brains of mice infected with wt or E1A-null virus fell to levels close to those measured in mock-infected mice (Fig. 7B and data not shown). However, at 22 dpi expression of RANTES remained significantly elevated in brains of mice infected with both viruses (Fig. 7B). Similar observations were made in an experimental model of herpes simplex virus encephalitis, in which levels of expression of RANTES, but not other chemokines measured, remained elevated in brains of infected mice up to 2 months post-infection (Sellner et al., 2005). Persistent upregulation of RANTES was also observed at 45 dpi in the spinal cords of mice infected with Theiler’s murine encephalomyelitis virus (Ransohoff et al., 2002). In each case, the investigators postulated that persistent inflammation could be caused by persistence of virus in the CNS. In this report, we demonstrate persistence of MAV-1 genome in the brain at 22 dpi (Fig. 6B), suggesting that the presence of virus may serve as a continued inflammatory stimulus that aids in the control of viral infection, contributes to immunopathologic damage, or both. Future work using mice deficient in RANTES or in CCR1 or CCR5, receptors for RANTES, may yield further important information regarding the role of RANTES in MAV-1 pathogenesis.
Following i.n. inoculation with the E1A-null mutant virus pmE109, viral gene expression and viral load were lower in the lungs than following inoculation with an equal dose of wt MAV-1. Similar differences between the viruses in viral gene expression were seen in vitro following infection of LA-4 cells at an MOI of 0.1, but not at an MOI of 5. These data suggest the possibility that lung infection is a condition that resembles a low MOI infection in cell culture, and that the absence of MAV-1 E1A results in an in vivo replication defect in the lung. In vivo, infection with E1A-null mutant virus was associated with less pronounced cellular infiltrates in the lung and less pronounced chemokine responses in lungs and brain than infection with an equal dose of wt virus. These blunted responses correlated with reduced levels of viral replication in E1A-null mutant virus-infected mice. Decreased levels of virus in E1A-null mutant virus-infected mice likely provided less of an inflammatory stimulus. This explanation is supported by results in which equivalent viral loads in lung infection with wt and mutant virus were associated with equivalent levels of chemokine gene expression (Fig. 4).
Previous work from our laboratory demonstrated higher 50% lethal doses for E1A-null mutant MAV-1 following i.p. inoculation of Swiss outbred mice (Smith et al., 1998). Despite its decreased virulence, the E1A-null mutant virus was found in the same organs and in the same cell types as wt virus following i.p. inoculation with 105 PFU of virus. The present study suggests that the decreased virulence of an E1A-null mutant virus does not depend on the route of inoculation. In addition, our results show that dissemination of MAV-1 to the CNS following acute respiratory infection does not depend on the presence of E1A.
While lower levels of viral gene expression and lower viral loads following infection with the E1A-null mutant pmE109 were most likely due to a replication defect, it is also possible that the absence of MAV-1 E1A in mice infected with pmE109 allowed more effective clearance of the virus by host immune responses. Many viruses, including the adenoviruses, have evolved mechanisms to counteract host IFN responses to viral infection. Although human adenovirus infection has been shown to induce the transcription of a variety of interferon-stimulated genes (ISG), both human adenovirus E1A (Reich et al., 1988) and MAV-1 E1A (Kajon and Spindler, 2000) suppress ISG transcription. Human adenovirus E1A inhibits IFN-α/β and IFN-γ signaling by reducing levels of p48 and the signal transducer and activator of transcription 1 (STAT1), two members of the IFN-α/β-induced transcription complex interferon-stimulated gene (ISG) factor 3 (ISGF3) (Ackrill et al., 1991; Gutch and Reich, 1991; Kalvakolanu et al., 1991; Leonard and Sen, 1996), and by inhibiting binding of ISGF3 to IFN-stimulated response elements (Gutch and Reich, 1991). The E1A-null mutant pmE109 is sensitive to the inhibitory effects of IFN-α/β and IFN-γ in vitro, whereas wt MAV-1 is not (Kajon and Spindler, 2000). ISG expression is decreased in the presence of MAV-1 E1A following treatment with IFN-α/β, but less so following IFN-γ treatment (Kajon and Spindler, 2000). We did not detect differing levels of IFN-γ protein or mRNA in the lungs of mock-infected mice or mice infected with wt MAV-1 or pmE109 (data not shown). However, it is possible that in the absence of MAV-1 E1A, IFN-mediated responses resulted in more effective clearance of virus and therefore subsequent decreased chemokine responses in the lungs and brain due to decreased viral replication.
Adenovirus E1A may affect chemokine responses to acute infection in a variety of ways. Signaling pathways involving NF-κB and AP-1 contribute to transcriptional control of a variety of chemokine genes (Kaufmann et al., 2001; Roebuck et al., 1999; Shin et al., 1994; Wickremasinghe et al., 2004). Activation of NF-κB (Schmitz et al., 1996) and AP-1 (Kleinberger and Shenk, 1993; Muller et al., 1989) by E1A may thereby enhance transcription of chemokine genes in infected cells. IFN-α and IFN-γ enhance chemokine responses to influenza virus infection (Veckman et al., 2006) and rhinovirus infection (Konno et al., 2002), respectively. Through its inhibitory effects on IFN signaling, E1A may instead lead to diminished chemokine responses in infected cells. These possibilities are not mutually exclusive, and the ultimate effect on chemokine production likely depends on contributions of other host and viral factors.
Clinical and experimental animal data have provided the basis for postulating that the human adenovirus E1A protein in the setting of persistent rather than acute infection is responsible for immunomodulatory effects contributing to chronic lung diseases such as asthma and chronic obstructive pulmonary disease (reviewed in Hogg, 2001). The majority (94%) of children with asthma who showed an unfavorable response to corticosteroid therapy had detectable adenovirus protein in bronchoalveolar lavage fluid (BALF); 75% of a subset of these patients available for study up to one year later had persistent adenovirus antigen in BALF (Macek et al., 1994). Human adenovirus infection of guinea pigs decreased steroid responsiveness in a model of allergic airways disease utilizing ovalbumin (OVA) sensitization (Yamada et al., 2000). Adenoviral DNA is found in respiratory epithelial cells in patients with COPD (Elliott et al., 1995; Matsuse et al., 1992), and cigarette smoke-induced inflammation is amplified in the lungs of guinea pigs infected with adenovirus (Vitalis et al., 1998). In vitro studies support the hypothesis that human adenovirus E1A modulates inflammatory responses to subsequent stimuli. For instance, IL-8 is induced by lipopolysaccharide (LPS) exposure to a greater degree in pulmonary epithelial cells transfected with E1A than in E1A-negative cells (Higashimoto et al., 2002; Keicho et al., 1997). Low levels of expression of MAV-1 E1A can be detected by real-time PCR in the lungs of intranasally infected mice at least until 44 dpi (data not shown). It is possible that low-level persistence of MAV-1 E1A may amplify inflammatory responses to subsequent stimuli in a manner similar to that suggested for human adenovirus E1A.
Adenovirus vectors are involved in ongoing efforts to develop safe and effective means to deliver genes to target cells for both long-term genetic reconstitution in monogenic disorders and transient gene delivery as primary or adjunctive therapy for illnesses such as cancer. This work typically involves the use of a replication-deficient adenovirus vector, usually containing a deletion of the E1 coding region, or conditionally replicating adenovirus vectors characterized by tumor-selective replication (reviewed in Young et al., 2006). For example, replication-deficient adenovirus vector delivery of the p53 tumor suppressor gene has been approved in China as a treatment for head and neck cancers (Peng, 2005). Adenovirus vector development has run into difficulties resulting from widespread vector dissemination due to the broad tissue distribution of cellular receptors for human adenoviruses (Mizuguchi and Hayakawa, 2004). Inflammatory responses elicited by the viral vectors are also thought to limit the expression of delivered genes (Liu and Muruve, 2003). To overcome these limitations, animal adenoviruses are being developed for human gene therapy (reviewed in Bangari and Mittal, 2006). Adenovirus vectors used for gene delivery and gene therapy are most often deleted of the E1 coding region to render them replication deficient. Our findings suggest that a MAV-1-based E1A-deleted vector may remain capable of disseminating throughout the host, potentially producing unanticipated effects in the host. Thus even in the absence of E1A, tissue distribution and inflammatory responses will remain important considerations as adenoviruses are developed for gene delivery applications.
Materials and Methods
Viruses and cell lines
Wild type MAV-1 was grown and passaged in NIH 3T6 fibroblasts, and titers of viral stocks were determined by plaque assay on 3T6 cells as previously described (Cauthen and Spindler, 1999). In the MAV-1 strain pmE109, the E1A translation initiator codon is mutated to TTG, resulting in the absence of detectable E1A protein (Smith et al., 1996). pmE109 was grown and titrated on the E1A-complementing 37.1 cell line as previously described (Smith et al., 1996). MH-S cells (ATCC CRL-2019) were maintained in RPMI 1640 medium (Gibco-BRL) supplemented with 10% calf serum (Gibco-BRL), 2 mM L-glutamine, and penicillin-streptomycin (Gibco-BRL). LA-4 cells (ATCC CCL-196) were maintained in Dulbecco’s modified Eagle medium (DMEM, Gibco-BRL) supplemented with 10% fetal bovine serum (Gibco-BRL), 2 mM L-glutamine, and penicillin-streptomycin (Gibco-BRL).
In vitro infections
MH-S or LA-4 cells were seeded at 106 cells/well in 6-well plates and incubated overnight at 37°C. The following day, the media was removed and cell monolayers were incubated at 37°C for 60 minutes with wt MAV-1 or pmE109 at a multiplicity of infection (MOI) of 0.1 or 5 PFU/cell in a total volume of 1 ml/well. Conditioned media was added to virus dilutions so that the total amount of virus stock plus conditioned media was equal across all conditions. An equivalent volume of conditioned media in 1 ml fresh media was used for mock-infected controls. Media was added to wells to bring the total volume to 5 ml/well and the cells were incubated at 37°C. At the indicated time points, media was aspirated from the wells and RNA was isolated from cells using 1 ml/well TRIzol Reagent (Gibco-BRL) according to the manufacturer’s instructions.
Mouse infections
Four- to six-week old male C57BL/6 mice were purchased from Harlan and maintained in microisolator cages. Under light isoflurane anesthesia, mice were inoculated i.n. with 105 PFU in 20 μl sterile phosphate-buffered saline (PBS). Control mice were inoculated i.n. with conditioned media at an equivalent dilution in PBS. In a separate experiment, mice were inoculated with 104 PFU or 105 PFU MAV-1 or 105 PFU pmE109 brought to 40 μl total volume with conditioned media. Mice were euthanized at the indicated time points. Organs were harvested, snap frozen in a dry ice and ethanol bath and stored at −20°C until processed further. All animal work complied with all relevant federal and institutional policies.
Histology
In a subset of mice, lungs and brain were harvested and fixed in 10% formalin. Prior to fixation, lungs were gently inflated with PBS via the trachea to maintain lung architecture. After fixation, organs were embedded in paraffin, and 5 μm sections were cut for histopathology and immunohistochemistry. Sections were stained with hematoxylin and eosin to evaluate cellular infiltrates.
Isolation of RNA and DNA from organs
The left lung was homogenized with sterile glass beads and 1 ml TRIzol Reagent (Gibco-BRL) using a Mini Beadbeater (Biospec Products). The homogenates were incubated at room temperature for 10 minutes, and then 200 μl of chloroform were added to each sample. Following a 3-minute incubation at room temperature, the tubes were centrifuged at 12,000 x g for 15 minutes at 4°C. The aqueous phase was transferred to a new microcentrifuge tube, and total RNA was precipitated with isopropanol. DNA was extracted from approximately one-third of the right lung using the DNeasy® Tissue Kit (Quiagen Inc.) according to the manufacturer’s protocol.
Ribonuclease protection assays
Total RNA was analyzed by RPA to measure viral and chemokine gene expression as previously described (Rochford et al., 2001; Weinberg et al., 2005). Expression of murine chemokines were measured using the mCK-5c riboprobe template (PharMingen) and expression of cell surface markers was measured using the mCD-1 riboprobe template (PharMingen). A genomic MAV-1 hexon probe was prepared from plasmid pHEX as described (Fang et al., 2004). The full-length hexon template measured 395 nt, and the size of the protected fragment was 337 nt. The template for the internal L32 (Hobbs et al., 1993) control was previously described. Linearized MAV-1 hexon and L32 templates were combined in equimolar concentrations for use in riboprobe syntheses driven by T7 bacteriophage RNA polymerase. All syntheses used [α-32P]UTP (Amersham) as the labeling nucleotide. Probe bands were visualized by autoradiography and were quantified where indicated using a Storm or Typhoon PhosphorImager (GE Healthcare) and ImageQuant software (GE Healthcare). Probe bands remained within the linear range of detection of these PhosphorImager systems.
Measurement of chemokine protein
Protein levels of the murine chemokine RANTES were measured in supernatants from organ homogenates obtained as described above. Specific chemokines were quantified using a standard method of sandwich ELISA as previously described (Hogaboam et al., 1998; Walley et al., 1997). In brief, microtiter plates were coated with the appropriate chemokine capture antibody. Samples were added to wells for 1 h at 37°C. Recombinant murine chemokine standard curves were used to calculate the chemokine concentrations. Detection and processing were performed with the appropriate biotinylated polyclonal rabbit anti-cytokine antibody (3.5 μg/ml), streptavidin-peroxidase conjugate (Bio-Rad) and chromogen substrate (Bio-Rad). Plates were read on an ELISA plate scanner at 492 nm.
Measurement of viral load
Wild type MAV-1 and pmE109 viral loads were measured in lung and brain using quantitative real-time PCR (qPCR). Primers were designed to detect a 265-bp region of the MAV-1 hexon gene (GenBank NC_000942), found in both wt MAV-1 and pmE109, as follows: forward 5′-CACACCTTTCAGCGAGTTTCA-3′, reverse 5′-GCCGGGCCAGGGGTTCAA-3′. DNA (100 ng per sample) was added to reactions containing forward and reverse primers at 100 nM, iQTM SYBR Green Supermix (Bio-Rad), and water in a total volume of 25 μl per reaction. Each sample was run in triplicate. Real-time PCR analysis was performed using an iCycler iQTM Multi-Color Real-Time PCR Detection System (Bio-Rad), with an initial 5 minute denaturation at 95°C followed by 40 cycles of 10 seconds at 95°C and 30 seconds at 60°C. Melt curve analysis was performed after each analysis to confirm the specificity of each amplification. Standard curves generated using known amounts of plasmid containing the MAV-1 hexon gene were used to convert cycle threshold values for experimental samples to copy numbers of hexon DNA. The lower limit of detection of this assay was consistently below 1 copy per 100 ng DNA.
Flow cytometry
Brains were harvested from a subset of mice in order to phenotype inflammatory cells by flow cytometry. Mice were euthanized and perfused with PBS; some residual pink color indicative of red blood cells was observed in some brains until after the Percoll gradient (below). Brains were harvested and kept in 5 ml ice-cold PBS. Single cell suspensions were created from each brain using a dounce homogenizer. To separate leukocytes from cell debris, 2.5 ml Percoll (Sigma) were added to the 5 ml of brain homogenate to create a 33% Percoll solution. This solution was underlayed with 1 ml of 90% Percoll in DMEM. Leukocytes were isolated following a 30-minute centrifugation at 1200 x g, washed, and resuspended in PBS. Fc receptors were blocked with anti-CD16/32 (Fc block; BD Pharmingen). Cell suspensions from individual brains were aliquoted into three equivalent volumes, pelleted, and stained with monoclonal antibodies specific for CD8, CD4, and CD19 (all from BD Pharmingen) and Ly-6G/C and F4/80 (both from CALTAG Laboratories). After staining, cells were analyzed on a FACScan flow cytometer (BD Biosciences) using Cell-Quest software (BD Biosciences).
Statistical analysis
Results are reported as the mean ± standard deviation of each group at each time point. Results were analyzed for statistical significance using Microsoft Excel (Microsoft) and Prism 3 for Macintosh (GraphPad Software Incorporated). Differences between two groups were analyzed using an unpaired Student’s t test assuming unequal variance. Differences between more than two groups were analyzed using a one-way analysis of variance (ANOVA) with subsequent Newman-Keuls Multiple Comparison tests to analyze pairs of groups when indicated.
Acknowledgments
We thank Pamela Lincoln in the laboratory of Steven Kunkel for her expert assistance in performing chemokine ELISA assays and Michael Imperiale for critical review of the manuscript. We also thank Rosemary Rochford for the generous sharing of equipment and reagents. D.R.J. was supported by the University of Michigan Medical School Student Biomedical Research Program. J.B.W. was supported by the University of Michigan Child Health Research Center (NICHD grant HD28820). K.R.S. was supported by NIH R01 AI023762. L.E.G. was supported by NIH T32 AI007528.
References
- Ackrill AM, Foster GR, Laxton CD, Flavell DM, Stark GR, Kerr IM. Inhibition of the cellular response to interferons by products of the adenovirus type 5 E1A oncogene. Nucleic Acids Res. 1991;19:4387–93. doi: 10.1093/nar/19.16.4387. [DOI] [PMC free article] [PubMed] [Google Scholar]
- Ball AO, Beard CW, Redick SD, Spindler KR. Genome organization of mouse adenovirus type 1 early region 1: a novel transcription map. Virology. 1989;170:523–36. doi: 10.1016/0042-6822(89)90444-3. [DOI] [PubMed] [Google Scholar]
- Ball AO, Williams ME, Spindler KR. Identification of mouse adenovirus type 1 early region 1: DNA sequence and a conserved transactivating function. J Virol. 1988;62:3947–57. doi: 10.1128/jvi.62.11.3947-3957.1988. [DOI] [PMC free article] [PubMed] [Google Scholar]
- Bangari DS, Mittal SK. Development of nonhuman adenoviruses as vaccine vectors. Vaccine. 2006;24:849–62. doi: 10.1016/j.vaccine.2005.08.101. [DOI] [PMC free article] [PubMed] [Google Scholar]
- Bonville CA, Rosenberg HF, Domachowske JB. Macrophage inflammatory protein-1alpha and RANTES are present in nasal secretions during ongoing upper respiratory tract infection. Pediatr Allergy Immunol. 1999;10:39–44. doi: 10.1034/j.1399-3038.1999.101005.x. [DOI] [PubMed] [Google Scholar]
- Cadillac JM, Sigler RE, Weinberg JB, Lutzke ML, Rochford R. Gammaherpesvirus-induced lung pathology is altered in the absence of macrophages. Lung. 2005;183:239–51. doi: 10.1007/s00408-004-2535-y. [DOI] [PubMed] [Google Scholar]
- Cauthen AN, Spindler KR. Construction of mouse adenovirus type 1 mutants. In: Wold WSM, editor. Adenovirus methods and protocols. Humana Press; Totowa, N.J: 1999. –85.pp. 103 [Google Scholar]
- Charles PC, Chen X, Horwitz MS, Brosnan CF. Differential chemokine induction by the mouse adenovirus type-1 in the central nervous system of susceptible and resistant strains of mice. J Neurovirol. 1999a;5:55–64. doi: 10.3109/13550289909029746. [DOI] [PubMed] [Google Scholar]
- Charles PC, Guida JD, Brosnan CF, Horwitz MS. Mouse adenovirus type-1 replication is restricted to vascular endothelium in the CNS of susceptible strains of mice. Virology. 1998;245:216–28. doi: 10.1006/viro.1998.9180. [DOI] [PubMed] [Google Scholar]
- Charles PC, Weber KS, Cipriani B, Brosnan CF. Cytokine, chemokine and chemokine receptor mRNA expression in different strains of normal mice: implications for establishment of a Th1/Th2 bias. J Neuroimmunol. 1999b;100 doi: 10.1016/s0165-5728(99)00189-7. [DOI] [PubMed] [Google Scholar]
- Dawson TC, Beck MA, Kuziel WA, Henderson F, Maeda N. Contrasting effects of CCR5 and CCR2 deficiency in the pulmonary inflammatory response to influenza A virus. Am J Pathol. 2000;156:1951–9. doi: 10.1016/S0002-9440(10)65068-7. [DOI] [PMC free article] [PubMed] [Google Scholar]
- Domachowske JB, Bonville CA, Gao JL, Murphy PM, Easton AJ, Rosenberg HF. MIP-1 alpha is produced but it does not control pulmonary inflammation in response to respiratory syncytial virus infection in mice. Cell Immunol. 2000;206:1–6. doi: 10.1006/cimm.2000.1730. [DOI] [PubMed] [Google Scholar]
- Elliott WM, Hayashi S, Hogg JC. Immunodetection of adenoviral E1A proteins in human lung tissue. Am J Respir Cell Mol Biol. 1995;12:642–8. doi: 10.1165/ajrcmb.12.6.7766428. [DOI] [PubMed] [Google Scholar]
- Fang L, Spindler KR. E1A-CR3 interaction-dependent and -independent functions of mSur2 in viral replication of early region 1A mutants of mouse adenovirus type 1. J Virol. 2005;79:3267–76. doi: 10.1128/JVI.79.6.3267-3276.2005. [DOI] [PMC free article] [PubMed] [Google Scholar]
- Fang L, Stevens JL, Berk AJ, Spindler KR. Requirement of Sur2 for efficient replication of mouse adenovirus type 1. J Virol. 2004;78:12888–900. doi: 10.1128/JVI.78.23.12888-12900.2004. [DOI] [PMC free article] [PubMed] [Google Scholar]
- Gottlieb K, Villarreal LP. The distribution and kinetics of polyomavirus in lungs of intranasally infected newborn mice. Virology. 2000;266:52–65. doi: 10.1006/viro.1999.0030. [DOI] [PubMed] [Google Scholar]
- Guida JD, Fejer G, Pirofski LA, Brosnan CF, Horwitz MS. Mouse adenovirus type 1 causes a fatal hemorrhagic encephalomyelitis in adult C57BL/6 but not BALB/c mice. J Virol. 1995;69:7674–81. doi: 10.1128/jvi.69.12.7674-7681.1995. [DOI] [PMC free article] [PubMed] [Google Scholar]
- Gutch MJ, Reich NC. Repression of the interferon signal transduction pathway by the adenovirus E1A oncogene. Proc Natl Acad Sci U S A. 1991;88:7913–7. doi: 10.1073/pnas.88.18.7913. [DOI] [PMC free article] [PubMed] [Google Scholar]
- Hale GA, Heslop HE, Krance RA, Brenner MA, Jayawardene D, Srivastava DK, Patrick CC. Adenovirus infection after pediatric bone marrow transplantation. Bone Marrow Transplant. 1999;23:277–82. doi: 10.1038/sj.bmt.1701563. [DOI] [PubMed] [Google Scholar]
- Harrod KS, Mounday AD, Stripp BR, Whitsett JA. Clara cell secretory protein decreases lung inflammation after acute virus infection. Am J Physiol. 1998;275:L924–30. doi: 10.1152/ajplung.1998.275.5.L924. [DOI] [PubMed] [Google Scholar]
- Higashimoto Y, Elliott WM, Behzad AR, Sedgwick EG, Takei T, Hogg JC, Hayashi S. Inflammatory mediator mRNA expression by adenovirus E1A-transfected bronchial epithelial cells. Am J Respir Crit Care Med. 2002;166:200–7. doi: 10.1164/rccm.2111032. [DOI] [PubMed] [Google Scholar]
- Hobbs MV, Weigle WO, Noonan DJ, Torbett BE, McEvilly RJ, Koch RJ, Cardenas GJ, Ernst DN. Patterns of cytokine gene expression by CD4+ T cells from young and old mice. J Immunol. 1993;150:3602–2614. [PubMed] [Google Scholar]
- Hogaboam CM, Steinhauser ML, Schock H, Lukacs N, Strieter RM, Standiford T, Kunkel SL. Therapeutic effects of nitric oxide inhibition during experimental fecal peritonitis: role of interleukin-10 and monocyte chemoattractant protein 1. Infect Immun. 1998;66:650–5. doi: 10.1128/iai.66.2.650-655.1998. [DOI] [PMC free article] [PubMed] [Google Scholar]
- Hogg JC. Role of latent viral infections in chronic obstructive pulmonary disease and asthma. Am J Respir Crit Care Med. 2001;164:S71–5. doi: 10.1164/ajrccm.164.supplement_2.2106063. [DOI] [PubMed] [Google Scholar]
- Horwitz MS. Adenoviruses. In: Knipe DM, Howley PM, editors. Fields Virology. Vol. 2. Lippincott Williams & Wilkins; Philadelphia: 2001. pp. 2301–2327. 2 vols. [Google Scholar]
- Kajon AE, Brown CC, Spindler KR. Distribution of mouse adenovirus type 1 in intraperitoneally and intranasally infected adult outbred mice. J Virol. 1998;72:1219–23. doi: 10.1128/jvi.72.2.1219-1223.1998. [DOI] [PMC free article] [PubMed] [Google Scholar]
- Kajon AE, Gigliotti AP, Harrod KS. Acute inflammatory response and remodeling of airway epithelium after subspecies B1 human adenovirus infection of the mouse lower respiratory tract. J Med Virol. 2003;71:233–44. doi: 10.1002/jmv.10475. [DOI] [PubMed] [Google Scholar]
- Kajon AE, Spindler KR. Mouse adenovirus type 1 replication in vitro is resistant to interferon. Virology. 2000;274:213–9. doi: 10.1006/viro.2000.0459. [DOI] [PubMed] [Google Scholar]
- Kalvakolanu DV, Bandyopadhyay SK, Harter ML, Sen GC. Inhibition of interferon-inducible gene expression by adenovirus E1A proteins: block in transcriptional complex formation. Proc Natl Acad Sci U S A. 1991;88:7459–63. doi: 10.1073/pnas.88.17.7459. [DOI] [PMC free article] [PubMed] [Google Scholar]
- Kaufmann A, Salentin R, Meyer RG, Bussfeld D, Pauligk C, Fesq H, Hofmann P, Nain M, Gemsa D, Sprenger H. Defense against influenza A virus infection: essential role of the chemokine system. Immunobiology. 2001;204:603–13. doi: 10.1078/0171-2985-00099. [DOI] [PubMed] [Google Scholar]
- Keicho N, Elliott WM, Hogg JC, Hayashi S. Adenovirus E1A upregulates interleukin-8 expression induced by endotoxin in pulmonary epithelial cells. Am J Physiol. 1997;272:L1046–52. doi: 10.1152/ajplung.1997.272.6.L1046. [DOI] [PubMed] [Google Scholar]
- Kleinberger T, Shenk T. Adenovirus E4orf4 protein binds to protein phosphatase 2A, and the complex down regulates E1A-enhanced junB transcription. J Virol. 1993;67:7556–60. doi: 10.1128/jvi.67.12.7556-7560.1993. [DOI] [PMC free article] [PubMed] [Google Scholar]
- Konno S, Grindle KA, Lee WM, Schroth MK, Mosser AG, Brockman-Schneider RA, Busse WW, Gern JE. Interferon-gamma enhances rhinovirus-induced RANTES secretion by airway epithelial cells. Am J Respir Cell Mol Biol. 2002;26:594–601. doi: 10.1165/ajrcmb.26.5.4438. [DOI] [PubMed] [Google Scholar]
- Kring SC, King CS, Spindler KR. Susceptibility and signs associated with mouse adenovirus type 1 infection of adult outbred Swiss mice. J Virol. 1995;69:8084–8. doi: 10.1128/jvi.69.12.8084-8088.1995. [DOI] [PMC free article] [PubMed] [Google Scholar]
- Leonard GT, Sen GC. Effects of adenovirus E1A protein on interferon-signaling. Virology. 1996;224:25–33. doi: 10.1006/viro.1996.0503. [DOI] [PubMed] [Google Scholar]
- Liu Q, Muruve DA. Molecular basis of the inflammatory response to adenovirus vectors. Gene Ther. 2003;10:935–40. doi: 10.1038/sj.gt.3302036. [DOI] [PubMed] [Google Scholar]
- Luster AD. Chemokines-chemotactic cytokines that mediate inflammation. N Engl J Med. 1998;338:436–445. doi: 10.1056/NEJM199802123380706. [DOI] [PubMed] [Google Scholar]
- Macek V, Sorli J, Kopriva S, Marin J. Persistent adenoviral infection and chronic airway obstruction in children. Am J Respir Crit Care Med. 1994;150:7–10. doi: 10.1164/ajrccm.150.1.8025775. [DOI] [PubMed] [Google Scholar]
- Matsuse T, Hayashi S, Kuwano K, Keunecke H, Jefferies WA, Hogg JC. Latent adenoviral infection in the pathogenesis of chronic airways obstruction. Am Rev Respir Dis. 1992;146:177–84. doi: 10.1164/ajrccm/146.1.177. [DOI] [PubMed] [Google Scholar]
- Mbawuike IN, Herscowitz HB. MH-S, a murine alveolar macrophage cell line: morphological, cytochemical, and functional characteristics. J Leukoc Biol. 1989;46:119–27. doi: 10.1002/jlb.46.2.119. [DOI] [PubMed] [Google Scholar]
- Miller AL, Bowlin TL, Lukacs NW. Respiratory syncytial virus-induced chemokine production: linking viral replication to chemokine production in vitro and in vivo. J Infect Dis. 2004;189:1419–30. doi: 10.1086/382958. [DOI] [PubMed] [Google Scholar]
- Miyazato A, Kawakami K, Iwakura Y, Saito A. Chemokine synthesis and cellular inflammatory changes in lungs of mice bearing p40tax of human T-lymphotropic virus type 1. Clin Exp Immunol. 2000;120:113–24. doi: 10.1046/j.1365-2249.2000.01197.x. [DOI] [PMC free article] [PubMed] [Google Scholar]
- Mizuguchi H, Hayakawa T. Targeted adenovirus vectors. Hum Gene Ther. 2004;15:1034–44. doi: 10.1089/hum.2004.15.1034. [DOI] [PubMed] [Google Scholar]
- Moore ML, Brown CC, Spindler KR. T cells cause acute immunopathology and are required for long-term survival in mouse adenovirus type 1-induced encephalomyelitis. J Virol. 2003;77:10060–10070. doi: 10.1128/JVI.77.18.10060-10070.2003. [DOI] [PMC free article] [PubMed] [Google Scholar]
- Moore ML, McKissic EL, Brown CC, Wilkinson JE, Spindler KR. Fatal disseminated mouse adenovirus type 1 infection in mice lacking B cells or Bruton’s tyrosine kinase. J Virol. 2004;78:5584–90. doi: 10.1128/JVI.78.11.5584-5590.2004. [DOI] [PMC free article] [PubMed] [Google Scholar]
- Muller U, Roberts MP, Engel DA, Doerfler W, Shenk T. Induction of transcription factor AP-1 by adenovirus E1A protein and cAMP. Genes Dev. 1989;3:1991–2002. doi: 10.1101/gad.3.12a.1991. [DOI] [PubMed] [Google Scholar]
- Peng Z. Current status of gendicine in China: recombinant human Ad-p53 agent for treatment of cancers. Hum Gene Ther. 2005;16:1016–27. doi: 10.1089/hum.2005.16.1016. [DOI] [PubMed] [Google Scholar]
- Ransohoff RM, Wei T, Pavelko KD, Lee JC, Murray PD, Rodriguez M. Chemokine expression in the central nervous system of mice with a viral disease resembling multiple sclerosis: roles of CD4+ and CD8+ T cells and viral persistence. J Virol. 2002;76:2217–24. doi: 10.1128/jvi.76.5.2217-2224.2002. [DOI] [PMC free article] [PubMed] [Google Scholar]
- Reich N, Pine R, Levy D, Darnell JE., Jr Transcription of interferon-stimulated genes is induced by adenovirus particles but is suppressed by E1A gene products. J Virol. 1988;62:114–9. doi: 10.1128/jvi.62.1.114-119.1988. [DOI] [PMC free article] [PubMed] [Google Scholar]
- Rochford R, Lutzke ML, Alfinito RS, Clavo A, Cardin RD. Kinetics of murine gammaherpesvirus 68 gene expression following infection of murine cells in culture and in mice. J Virol. 2001;75:4955–63. doi: 10.1128/JVI.75.11.4955-4963.2001. [DOI] [PMC free article] [PubMed] [Google Scholar]
- Roebuck KA, Carpenter LR, Lakshminarayanan V, Page SM, Moy JN, Thomas LL. Stimulus-specific regulation of chemokine expression involves differential activation of the redox-responsive transcription factors AP-1 and NF-kappaB. J Leukoc Biol. 1999;65:291–8. doi: 10.1002/jlb.65.3.291. [DOI] [PubMed] [Google Scholar]
- Scapini P, Lapinet-Vera JA, Gasperini S, Calzetti F, Bazzoni F, Cassatella MA. The neutrophil as a cellular source of chemokines. Immunol Rev. 2000;177:195–203. doi: 10.1034/j.1600-065x.2000.17706.x. [DOI] [PubMed] [Google Scholar]
- Schmitz ML, Indorf A, Limbourg FP, Stadtler H, Traenckner EB, Baeuerle PA. The dual effect of adenovirus type 5 E1A 13S protein on NF-kappaB activation is antagonized by E1B 19K. Mol Cell Biol. 1996;16:4052–63. doi: 10.1128/mcb.16.8.4052. [DOI] [PMC free article] [PubMed] [Google Scholar]
- Sellner J, Dvorak F, Zhou Y, Haas J, Kehm R, Wildemann B, Meyding-Lamade U. Acute and long-term alteration of chemokine mRNA expression after anti-viral and anti-inflammatory treatment in herpes simplex virus encephalitis. Neurosci Lett. 2005;374:197–202. doi: 10.1016/j.neulet.2004.10.054. [DOI] [PubMed] [Google Scholar]
- Shin HS, Drysdale BE, Shin ML, Noble PW, Fisher SN, Paznekas WA. Definition of a lipopolysaccharide-responsive element in the 5′-flanking regions of MuRantes and crg-2. Mol Cell Biol. 1994;14:2914–25. doi: 10.1128/mcb.14.5.2914. [DOI] [PMC free article] [PubMed] [Google Scholar]
- Smith K, Brown CC, Spindler KR. The role of mouse adenovirus type 1 early region 1A in acute and persistent infections in mice. J Virol. 1998;72:5699–706. doi: 10.1128/jvi.72.7.5699-5706.1998. [DOI] [PMC free article] [PubMed] [Google Scholar]
- Smith K, Spindler KR. Murine adenovirus. In: Ahmed R, Chen I, editors. Persistent Viral Infections. John Wiley & Sons, Ltd; 1999. –477.pp. 484 [Google Scholar]
- Smith K, Ying B, Ball AO, Beard CW, Spindler KR. Interaction of mouse adenovirus type 1 early region 1A protein with cellular proteins pRb and p107. Virology. 1996;224:184–97. doi: 10.1006/viro.1996.0520. [DOI] [PubMed] [Google Scholar]
- Spindler KR, Fang L, Moore ML, Hirsch GN, Brown CC, Kajon A. SJL/J mice are highly susceptible to infection by mouse adenovirus type 1. J Virol. 2001;75:12039–46. doi: 10.1128/JVI.75.24.12039-12046.2001. [DOI] [PMC free article] [PubMed] [Google Scholar]
- Stoner GD, Kikkawa Y, Kniazeff AJ, Miyai K, Wagner RM. Clonal isolation of epithelial cells from mouse lung adenoma. Cancer Res. 1975;35:2177–85. [PubMed] [Google Scholar]
- Tripp RA, Jones L, Anderson LJ. Respiratory syncytial virus G and/or SH glycoproteins modify CC and CXC chemokine mRNA expression in the BALB/c mouse. J Virol. 2000;74:6227–9. doi: 10.1128/jvi.74.13.6227-6229.2000. [DOI] [PMC free article] [PubMed] [Google Scholar]
- Veckman V, Osterlund P, Fagerlund R, Melen K, Matikainen S, Julkunen I. TNF-alpha and IFN-alpha enhance influenza-A-virus-induced chemokine gene expression in human A549 lung epithelial cells. Virology. 2006;345:96–104. doi: 10.1016/j.virol.2005.09.043. [DOI] [PubMed] [Google Scholar]
- Vitalis TZ, Kern I, Croome A, Behzad H, Hayashi S, Hogg JC. The effect of latent adenovirus 5 infection on cigarette smoke-induced lung inflammation. Eur Respir J. 1998;11:664–9. [PubMed] [Google Scholar]
- Walley KR, Lukacs NW, Standiford TJ, Strieter RM, Kunkel SL. Elevated levels of macrophage inflammatory protein 2 in severe murine peritonitis increase neutrophil recruitment and mortality. Infect Immun. 1997;65:3847–3851. doi: 10.1128/iai.65.9.3847-3851.1997. [DOI] [PMC free article] [PubMed] [Google Scholar]
- Walls T, Shankar AG, Shingadia D. Adenovirus: an increasingly important pathogen in paediatric bone marrow transplant patients. Lancet Infect Dis. 2003;3:79–86. doi: 10.1016/s1473-3099(03)00515-2. [DOI] [PubMed] [Google Scholar]
- Wareing MD, Lyon AB, Lu B, Gerard C, Sarawar SR. Chemokine expression during the development and resolution of a pulmonary leukocyte response to influenza A virus infection in mice. J Leukoc Biol. 2004;76:886–95. doi: 10.1189/jlb.1203644. [DOI] [PubMed] [Google Scholar]
- Weinberg JB, Lutzke ML, Efstathiou S, Kunkel S, Rochford R. Elevated chemokine responses are maintained in lungs after clearance of viral infection. J Virol. 2002;76:10518–10523. doi: 10.1128/JVI.76.20.10518-10523.2002. [DOI] [PMC free article] [PubMed] [Google Scholar]
- Weinberg JB, Stempfle GS, Wilkinson JE, Younger JG, Spindler KR. Acute respiratory infection with mouse adenovirus type 1. Virology. 2005;340:245–54. doi: 10.1016/j.virol.2005.06.021. [DOI] [PMC free article] [PubMed] [Google Scholar]
- Wickremasinghe MI, Thomas LH, O’Kane CM, Uddin J, Friedland JS. Transcriptional mechanisms regulating alveolar epithelial cell-specific CCL5 secretion in pulmonary tuberculosis. J Biol Chem. 2004;279:27199–210. doi: 10.1074/jbc.M403107200. [DOI] [PubMed] [Google Scholar]
- Yamada K, Elliott WM, Hayashi S, Brattsand R, Roberts C, Vitalis TZ, Hogg JC. Latent adenoviral infection modifies the steroid response in allergic lung inflammation. J Allergy Clin Immunol. 2000;106:844–51. doi: 10.1067/mai.2000.110473. [DOI] [PubMed] [Google Scholar]
- Young LS, Searle PF, Onion D, Mautner V. Viral gene therapy strategies: from basic science to clinical application. J Pathol. 2006;208:299–318. doi: 10.1002/path.1896. [DOI] [PubMed] [Google Scholar]
- Zhou J, Stohlman SA, Hinton DR, Marten NW. Neutrophils promote mononuclear cell infiltration during viral-induced encephalitis. J Immunol. 2003;170:3331–6. doi: 10.4049/jimmunol.170.6.3331. [DOI] [PubMed] [Google Scholar]