

Abstract
Activation of A1 and A2A subtype adenosine receptors (AR) likely exert opposing effects on outflow of aqueous humor, and thereby, on intraocular pressure. Selective agonists of adenosine receptor (AR) subtypes have previously been applied to trabecular meshwork (TM) and Schlemm’s canal (SC) cells to identify the site(s) of differential purinergic modulation. However, the apparent changes in volume monitored by previously measuring projected cell area might have partially reflected cell contraction and relaxation. In addition, whole-cell current responses of the TM cells previously described were highly variable following application of selective A1, A2A and A3 agonists. The complexity of the electrophysiologic responses may have reflected cell heterogeneity of the populations harvested from collagenase digestion of TM explants. We now report measurements of TM-cell volume using calcein fluorescence quenching, an approach independent of contractile state. Furthermore, we have applied selective AR agonists to a uniform population of human TM cells, the hTM5 cell line. A1, but not A2A or A3, AR agonists triggered TM-cell shrinkage. Both A1 and A2A AR agonists produced reproducible increases in TM-cell whole-cell currents of similar magnitude.
The results suggest that previous measurements of explant-derived TM cells may have reflected a range of responses from phenotypically different cell populations, and that the opposing effects of A1 and A2A agonists on outflow resistance are not likely to be mediated by actions on a single population of TM cells. These opposing effects might reflect AR responses by two or more subpopulations of TM cells, by TM and SC cells or by inner-wall SC cells, alone.
1. Introduction
The intraocular pressure directly depends on the product of the inflow rate of aqueous humor and the resistance to outflow from the eye. The major mechanisms underlying aqueous humor inflow across the ciliary epithelium are largely identified (Civan & Macknight, 2004; Crook et al., 2000; Do & Civan, 2004; To et al., 2001), but a comprehensive, integrated understanding of outflow remains elusive (Johnson, 2006; Johnson & Erickson, 2000). In the primate eye, aqueous humor has been thought to exit the anterior chamber largely through the conventional pathway comprising the trabecular meshwork (TM) in series with Schlemm’s canal (SC) (Johnson & Erickson, 2000). The heterogeneous cell populations, complex microscopic anatomy and species variance have retarded progress in understanding the cell physiology of outflow.
The site and potential regulation of the rate-limiting step in determining outflow resistance are poorly understood (Ethier, 2002; Johnson & Erickson, 2000). The very low magnitude of that resistance has led to the thought that outflow proceeds between the cells, not through them (Johnson & Erickson, 2000). On the other hand, as previously noted (Karl et al., 2005), cells in the outflow pathway likely play a role in regulating outflow resistance. Swelling the cells in this pathway increases resistance, and shrinking the cells reduces outflow resistance in human, non-human primate and calf eyes (Al-Aswad et al., 1999; Gual et al., 1997; Rohen, 1963). Which cells participate in this regulation is unknown, but the TM and the inner-wall SC cells are likely candidates. Changes in the volume of the TM cells might modify resistance by restricting the adjacent space through which outflow could proceed (O’Donnell et al., 1995). Consistent with this reasoning, the Na+/H+-antiport inhibitor dimethylamiloride reduces both the volume of cultured human TM cells (Mitchell et al., 2002) and the IOP of living mice (Avila et al., 2002a). Alternatively, the aqueous humor outflow might be limited by passage through pores within and between the inner-wall cells of Schlemm’s canal (Ethier, 2002; Johnson, 2006) and through the very leaky tight junctions between these cells (Raviola & Raviola, 1978).
If a single cellular site regulates outflow resistance, that site is oppositely affected by hypo- and hyperosmolality, as noted above. Different adenosine receptors (ARs) also seem to exert opposite effects on outflow resistance. These receptors are likely important in modulating intraocular pressure under physiological (Avila et al., 2002b) and pathological (Schlötzer-Schrehardt et al., 2005) conditions. Stimulation of A1 ARs reduces IOP and activation of A2A AR agonists elevates IOP in rabbits (Crosson, 1995; Crosson, 2001), mice (Avila et al., 2001a; Avila et al., 2001b) and monkeys. The reduction in monkey IOP is thought entirely due to changes in outflow (Tian et al., 1997). The A2A AR-stimulated effect also probably arises from changed outflow resistance, since the increased IOP triggered is not ascribable to either an increase in inflow (Tian et al., 1997) or disruption of the blood-aqueous barrier at low doses of agonist (Crosson & Gray, 1996; Tian et al., 1997).
In an initial work (Fleischhauer et al., 2003) and in the present report, we have tested whether selective A1 and A2A AR agonists exert opposite actions on human TM cells. In the earlier work, we observed variable responses to selective A1, A2A and A3 agonists by heterogeneous populations of cells, which might reflect the recognized structural and functional heterogeneity of TM cells (de Kater et al., 1990; Stumpff et al., 1997). In the present work, we have tested whether homogeneous populations of human TM cells might respond more uniformly to selective A1 and A2A AR agonists, and whether those responses correspond to the opposing effects observed on IOP in vivo. For this purpose, we studied a cloned human trabecular meshwork cell line (hTM5) (Pang et al., 1994). We also measured the responses of TM cells to selective stimulation of A3 ARs, which likely regulate aqueous humor inflow.
2. Materials and methods
2.1. Trabecular meshwork cells
Cells from the hTM5 human cell line were generously provided by Alcon Research Ltd. (Fort Worth, TX). Cells were cultured in T25 culture flasks (Falcon™, BD Bioscience, Bedford, MA) maintained in F99 medium (a 1:1 mixture of medium 199 with Earle’s salts and L-glutamine) and Ham’s F12 (with L-glutamine), supplemented with 10% certified fetal bovine serum, 2.5 μg ml−1 amphotericin B and 50 μg ml−1 gentamycin, all from Invitrogen Corp., at 37°C with 5% CO2 and passaged at 1:4 split ratio (Engelmann & Friedl, 1989). Cells were studied at passage (p) 15 for patch clamping and p16 and p18 for calcium studies.
2.2. Cell-volume measurements
We monitored cell volume by measuring total calcein fluorescence, as described elsewhere (Do et al., 2006). TM cells were grown on coverslips for 24 hours, loaded with 0.4 μM calcein-AM together with 0.02% Pluronic F-127 at room temperature for 30-40 min, and subsequently perfused for another 30 min with isotonic Tyrode’s solution (Table 1) containing the calcein-AM and Pluronic F-127 before initiating the measurements. Coverslips were placed in a chamber mounted on a Nikon Diaphot microscope with a x40 oil immersion objective for visualization. Areas were chosen to study 1–4 cells of similar size and dye concentration.
Table 1.
Solutions for patch-clamp, volume and calcium experiments.
| Patch-clamp | Volume & Calcium | ||
|---|---|---|---|
| Component | Micropipette | External Bath | Bath |
| Na+ | 12.2 | 112.0 | 140.0 |
| Cl− | 25.0 | 122.0 | 122.1 |
| K+ | 122.5 | 4.0 | 5.9 |
| Mg2+ | 1.0 | 1.2 | 1.2 |
| Ca2+ | 0.38 | 1.8 | 2.5 |
| HCO3− | - | - | 30.0 |
| H2PO4− | - | - | 1.2 |
| HEPES | 12.0 | 12.0 | 15.0 |
| Glucose | – | 5.0 | 10.0 |
| Mannitol | – | ±60.0 | - |
| EGTA | 1.0 | – | - |
| Aspartate | 110.5 | – | - |
| ATP | 1.0 | – | - |
Concentrations are given in mM. The osmolalities of the micropipette solutions, isotonic and hypotonic bath solutions were 265–287, 299–311 and 240–245 mosmol/kg water, respectively. The pH was adjusted to 7.2 and 7.4 for the micropipette and bath solutions, respectively. The free [Ca2+] in the micropipette was 100 nM.
In studying small numbers of ocular cells, we (Do et al., 2004; Mitchell et al., 2002) and others (Walker et al., 1999) previously monitored cell area as an index of cell volume, relying on indirect methods in distinguishing shrinkage from contraction (Do et al., 2004; Mitchell et al., 2002). Measurement of total calcein fluorescence provides a more rigorous approach to this problem. Dye quenching at intracellular sites is enhanced by cell shrinkage, reduced by cell swelling and unaltered by changes in cell shape. Initially proposed by Hamann et al. (2002), the calcein-fluorescence quenching approach was later validated for cultured astrocytes (Solenov et al., 2004) and has recently been used to measure volume of native bovine nonpigmented ciliary epithelial cells (Do et al., 2006). The precise bases for the calcein-fluorescence quenching are unclear, but likely arise partly from interaction with intracellular macromolecules (Solenov et al., 2004) and intracellular iron (Epsztejn et al., 1997).
As discussed elsewhere (Hamann, 2002; Mitchell et al., 2002), calcein is an unusually favorable dye in being easily loaded in the acetoxymethyl ester (AM) form, being well retained within trabecular meshwork cells, and displaying a fluorescence relatively independent of shifts in pH and Ca2+. Since its fluorescence is 2–3 times greater than that of other commonly used fluorophores, satisfactory signals can be generated at relatively low excitation intensity.
We further minimized the possibility of bleaching by limiting the excitation at 488 nm to 3 min−1. The light emitted at 520 nm was detected with an IC-200 charge-coupled device (CCD) camera (Photon Technology International, Princeton, NJ). Analysis was performed using Imagemaster software (Photon Technology International). Figures 1–3 illustrates that the fluorescence signal from control cells was stable within 2–3% over periods as long as 70 min, so that no correction for bleaching was necessary.
Fig. 1.
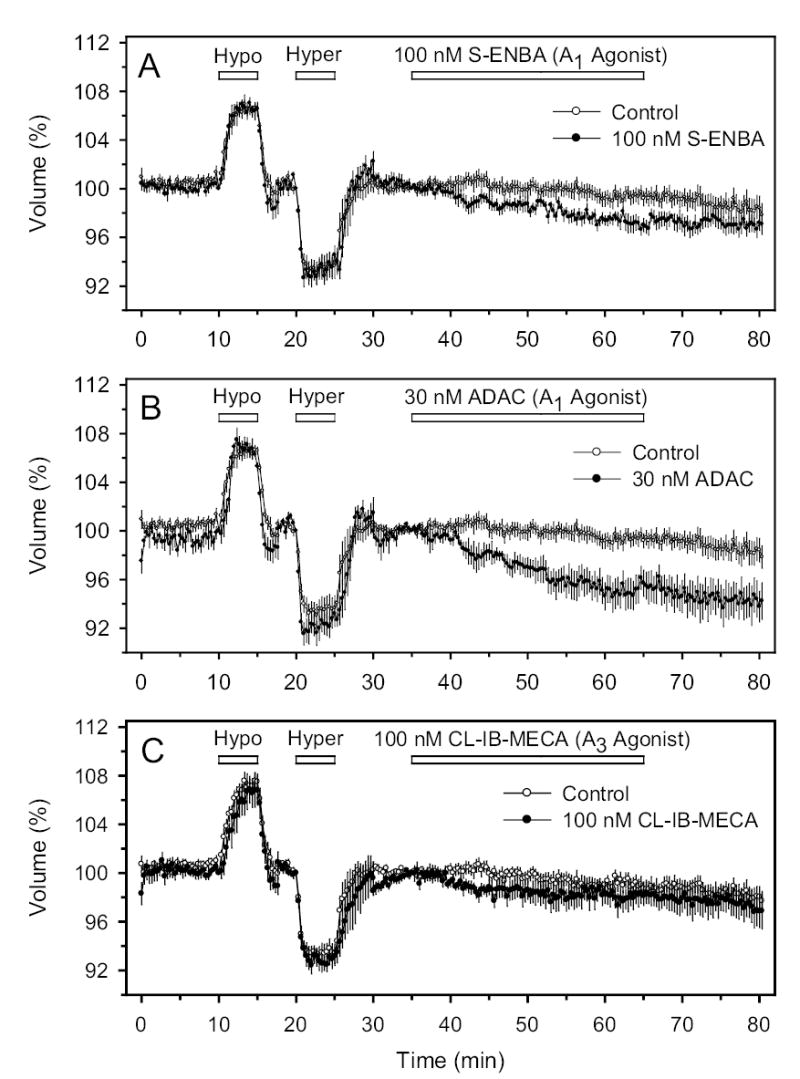
Cell volume (in %) normalized to value just prior to perfusion with the AR agonist. For purposes of comparison, the same set of control data are presented (open circles) in each panel. To verify the integrity and stability of the preparation, each experimental period was preceded by a 35-minute period of perfusion with iso-, hypo- and hyperosmotic solution. A, B and C: Perfusion with S-ENBA (A1 agonist), ADAC (A1 agonist) and Cl-IB-MECA (A3 agonist), respectively. In this and all successive figures, uncertainties represent ±1 SE. The full names of the drugs used in the experiments of all figures are entered in Table 2.
Fig. 3.
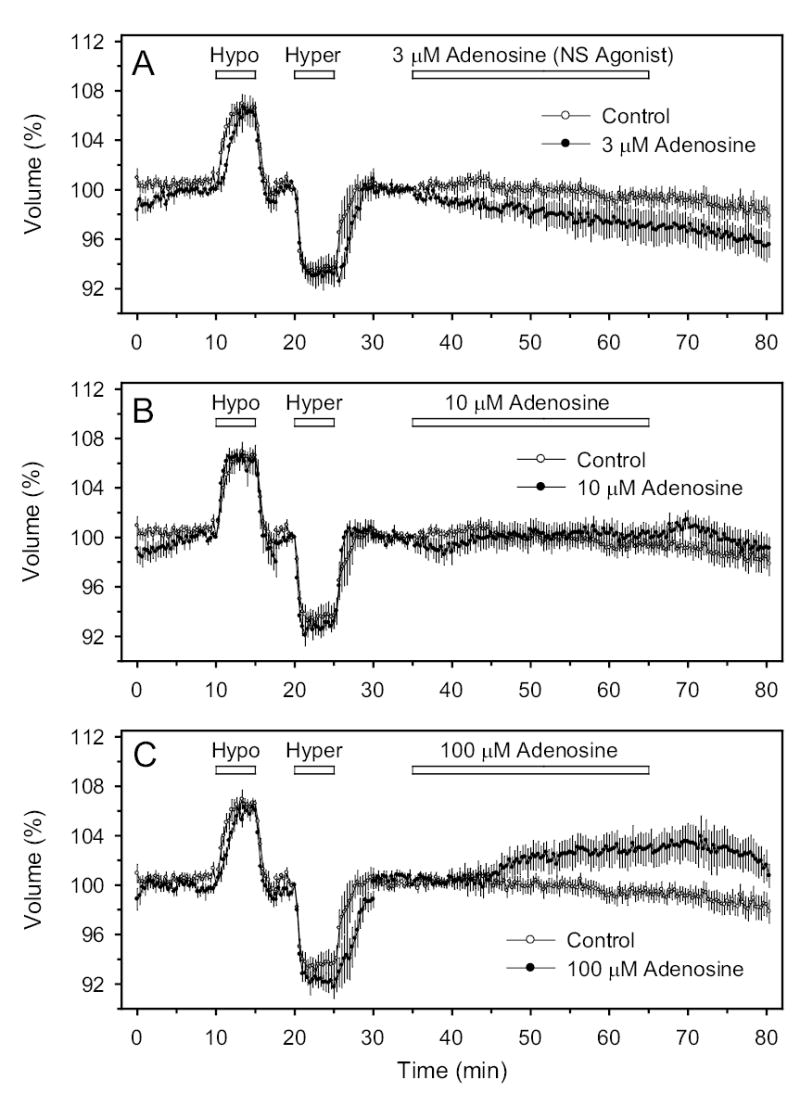
Effects of the physiologic nonselective (NS) AR agonist adenosine on cell volume. A, B and C: Perfusion with 3, 10 and 100 μM, respectively.
In order to estimate the approximate percentage change in cell volume from the percentage change in fluorescence, cells were briefly exposed to 25% hypotonic (ΔHypo) and 25% hypertonic solutions (ΔHyper). These osmotic changes should produce a 33% increase and a 20% decrease in volume of perfect osmometers. The magnitude of the agonist-triggered shrinkage was calculated from the decrease in percentage fluorescence (ΔAgonist) as {(20)(ΔAgonist)/(ΔHyper)}%.
2.3. Intracellular Ca2+ concentrations
Intracellular Ca2+ concentration was measured in confluent monolayers as previously described (Mitchell et al., 2002). Cells were seeded onto coverslips (Fisher Scientific, Pittsburgh, PA) and grown for 1–11 days to prepare confluent monolayers. The monolayers were loaded in the dark with 5 μM fura-2 acetoxymethyl ester (AM) and 0.01% Pluronic F-127 (Molecular Probes, Eugene, OR) for 30–60 min at 25°C.
The monolayered coverslips were mounted in an inverted Nikon Diaphot microscope, visualized with an x40 oil-immersion fluorescence objective and perfused with fura-free solution for 21–38 min (Table 1). Measurements were acquired at 1 Hz with a photomultiplier tube, at an emitted fluorescence of 520 nm following excitation at 340 nm and 380 nm. Data were sent to the computer, and saved. Felix software (Photon Technology International) was used to determine the ratio and calculate the Ca2+ concentration (Mitchell et al., 2002) using the method of Grynkiewicz et al. (1985).
2.4. Patch clamping
As previously described (Karl et al., 2005), cells were trypsinized, resuspended and permitted to settle on glass coverslips. Whole-cell patch-clamp currents were recorded in the ruptured-patch mode using an Axopatch 1B or 1D patch-clamp amplifier (Axon Instruments, Foster City, CA) connected to an external 8-pole Bessel filter (Frequency Devices, Model 990C, Haverhill, MA). Micropipettes were prepared from Corning no. 7052 glass [World Precision Instruments (WPI), Sarasota, FL] with a Flaming/Brown micropipette puller (P-97, Sutter Instruments Co., Novato, CA), coated with Sylgard (WPI) and fire-polished with a microforge (MF-830, Narishige, Japan). The micropipette resistances were 2–4 M when filled with the solution of Table 1 and reached several gigohms after seal formation. Voltages were measured in a perfusion chamber connected to a Ag/AgCl pellet in 3 M KCl solution via a 3 M KCl agar bridge.
Step changes in potential to values from −100 to +80 mV were applied in 20-mV increments for 30 ms from a holding potential (Vh) of −80 mV to test values at 2-s intervals. The small junction potential [~−2.8 mV (Carré et al., 2000)] was not corrected. Measurements were recorded at 2–5 kHz and filtered at 500 Hz using an Axon Digidata interface coupled with pClamp 8.2 software. Analysis was conducted with Clampfit 8.2 software (Axon Instruments). Stimulations of current were measured at the maximum responses and inhibitions were quantified at the lowest values following drug application.
2.5. Drugs and experimental solutions
Chemicals were obtained from Sigma Chemical (St.Louis, MO). The compositions of solutions used for volume, calcium and patch-clamp measurements are provided in Table 1.
2.6. Data analysis
Means ±SE were calculated from analysis of N experiments. Uncertainties are entered as ±1 SE. The probability P of the null hypothesis was estimated with 2-way ANOVA followed by the Tukey multiple comparison test when comparing drugs in different cells. When evaluating a drug effect on a single-cell type, Student’s paired t-test was applied to results satisfying normality. Where normality was not met, results were exponentially transformed. If the transformed data satisfied normality, analysis was conducted with the paired t-test.
3. Results
3.1. Cell volume
Following calcein loading, cells were perfused with calcein-free solution and exposed to sequential brief periods of 25% hypo- and hyperosmolality, with intervening return to isosmolality. As we have observed with nonpigmented ciliary epithelial cells, the total fluorescence was inversely dependent on bath osmolality (Fig. 1). Cells were included in the analysis if the fluorescence returned to the baseline value following the brief osmotic perturbations. The 25%-increase in osmolality, ideally producing a 20%-decrease in cell volume, triggered a fall in fluorescence of 5.9 ±0.7%.
Application of the selective A1 AR agonists S-ENBA and ADAC separately produced cell shrinkage. At 100 nM, S-ENBA triggered a time-dependent reduction in fluorescence, which was lowered by 2.4 ±0.4% after 25 min superfusion (Fig. 1A, t=60 min, N=7, P<0.001). Another A1 AR agonist, ADAC (30 nM) also reduced intracellular calcein fluorescence, by 5.4 ±1.1% after 25 min (Fig. 1B, t=60 min, N=5, P<0.01). At these concentrations, both S-ENBA and ADAC are expected to act only on A1 receptors (Table 2). Estimated from the response to the initial brief hyperosmotic shrinkage, the changes in fluorescence triggered by the A1 AR agonists likely corresponded to cell shrinkage of approximately 8–18%. In contrast, the change in fluorescence (ΔF) in control cells not exposed to the purines was unchanged after the same period of perfusion (Fig. 1A, ΔF=0.8 ±0.6%, N=7, P>0.2). To facilitate comparisons, the same control time courses are presented together with the time courses measured with the drug-treated cells. The control and drug-treated cells were drawn from cells at similar passage number and exposed to the same concentrations of DMSO drug vehicle.
Table 2.
Adenosine-receptor agonists used in present study.
| Potency (nM) | ||||||
|---|---|---|---|---|---|---|
| Action | Drug* | A1 | A2A | A2B | A3 | Source |
| Non-selective | Adenosine | 300–3000*** | 700*** | 24,000*** | 290*** | Human (Fredholm et al., 2001b) |
| A1 | (S)-ENBA | 0.3 | 1400 | unknown | 915 | Rat (Fredholm et al., 2001a) |
| A1 | ADAC | 0.85 | 210 | unknown | 281 | Rat (Jacobson & Knutsen, 2001) |
| A2A | CGS-21680 | 290 (230–360) | 27 (12–59) | 361000 ± 21000 | 67 (50–90) | Human (Fredholm et al., 2001a; Klotz, 2000) |
| A2A | DPMA | 142 | 4 | unknown | 3,600 | Rat (Fredholm et al., 2001a; Jacobson & Knutsen, 2001) |
| A3 | Cl-IB-MECA | 115 (114–116) | 2100 (1700–2500) | unknown | 11 (9.4–13) | Human (Fredholm et al., 2001a; Klotz, 2000) |
| A3 | Cl-IB-MECA | >100000nM*** | Human (de Zwart et al., 1998) | |||
=potency (adenylate cyclase assay)
Definitions of symbols: S-ENBA [(2S)-N6-[2-endo-Norbornyl]adenosine], ADAC [adenosine amine congener], DPMA [N6-[2-(3,5-dimethoxyphenyl)-2-(2 methylphenyl)ethyl adenosine], CGS-21680 [2-p-(2-carboxyethyl)-phenethylamino-5′-N-ethylcarbox-amidoadenosine], Cl-IB-MECA [2-chloro-N6-(3-iodobenzyl)-adenosine-5′-N-methyluronamide].
In contradistinction to the results obtained with the A1-selective AR agonists, agents commonly used to stimulate A2A AR (30 μM and 100 μM CGS-21680, and 50 μM DPMA, Fig. 2) or A3 receptors (100 nM Cl-IB-MECA) did not significantly alter cell volume (Fig. 1C). The non-selective AR agonist adenosine also did not significantly alter cell volume (Fig. 3), although there was a tendency for adenosine to shrink cells at 3 μM (P<0.1) and to swell cells at very high concentration (100 μM, P<0.1).
Fig. 2.
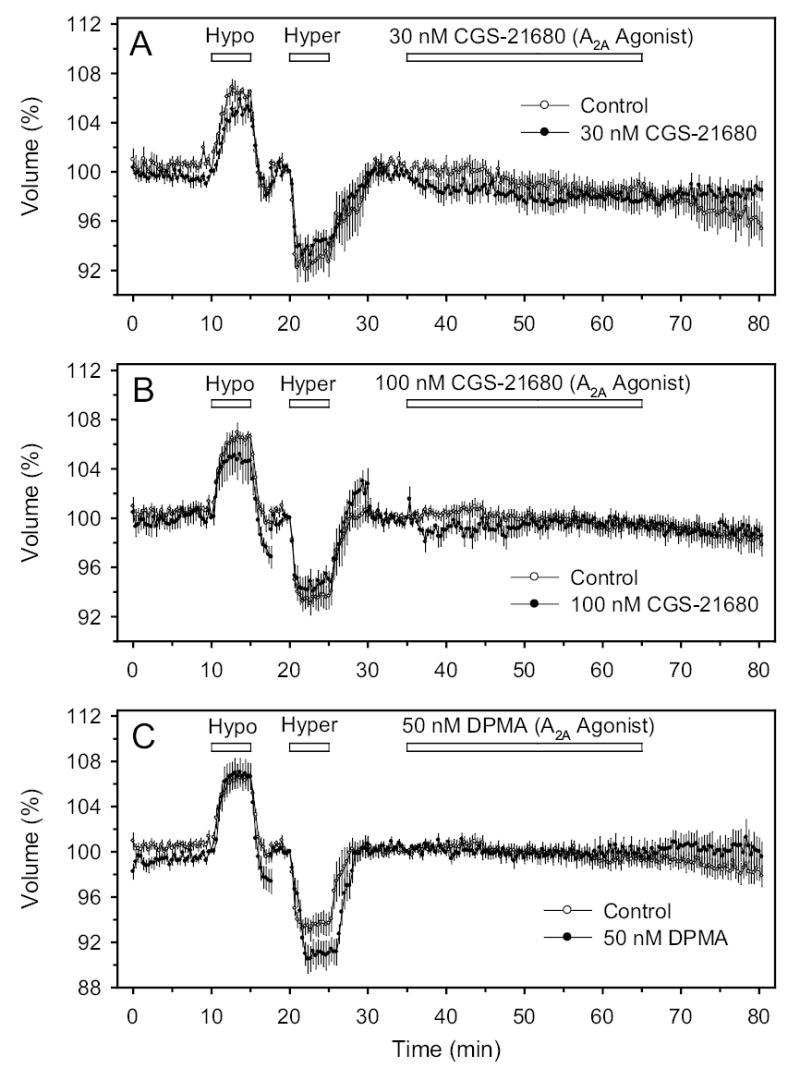
Effects of A2A agonists on cell volume. A, B and C: Perfusion with 30 nM CGS-21680, 100 nM CGS-21680 and 50 nM DPMA, respectively.
In summary, the volumetric measurements detected a significant shrinkage in response to perfusion of A1-selective AR agonists, alone.
3.2. Intracellular Ca2+
The mean baseline free Ca2+ concentrations for the experiments summarized in Fig. 4 ranged from 71 to 138 nM, comparable to previous measurements in human TM cells of 136 ±15 nM (Fleischhauer et al., 2003) and 106 ±0.5 nM (Howard et al., 1996). Figure 4 presents the responses to perfusion of selective AR agonists (Jacobson & Knutsen, 2001). The results have been normalized (in %) to the calcium concentration recorded just before addition of the agonists. Repeat applications of the A1 AR agonist ADAC, separated by a washout period, produced increases in Ca2+ concentration of 50 ±15% (N=11, P<0.01, Fig. 4A) and 33 ±9% (N=11, P<0.01). The A2A AR agonist CGS-21680 increased Ca2+ by 26 ±13% (N=6, P>0.1, Fig. 4B) at 30 nM, and later by 402 ±80% (N=6, P<0.05) at 100 nM. The A3 AR agonist Cl-IB-MECA also increased Ca2+ by 13 ±4% (N=6, P<0.02, Fig. 4C) at 30 nM, and by 205 ±65% (N=6, P<0.05) at 100 nM.
Fig. 4.
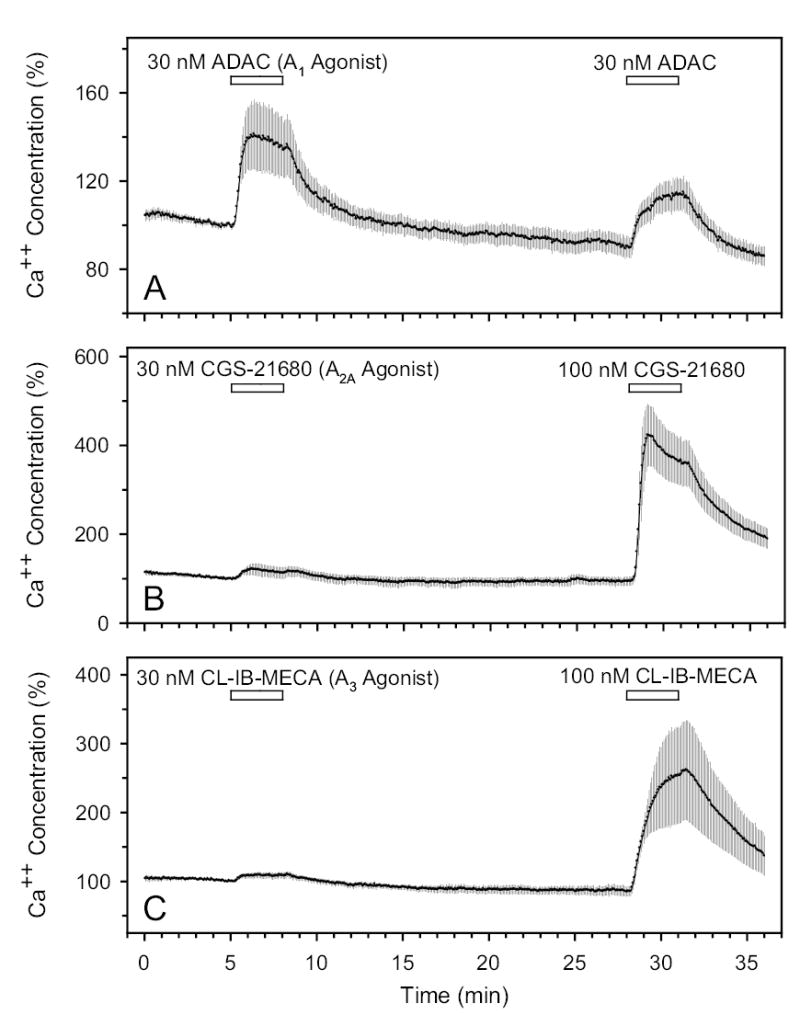
Effects of A1, A2A and A3 agonists on free intracellular Ca2+ concentration in A (N=11), B (N=6) and C (N=6), respectively. N is the number of coverslips studied.
In summary, stimulation of A1 and A2A, as well as A3, ARs increased the intracellular Ca2+ concentrations of the TM cells.
3.3. Whole-cell currents
The cells patched (N=33) were 22 ±1 μm in diameter. The K+-channel blocker TEA, applied at 7.5 mM during the course of 28 experiments, reduced whole cell currents at +80 mV by 59 ±3% (P<0.001). The response to TEA was consistent with previous observations that K+ channels provide a large fraction of the total TM-cell membrane conductance (Fleischhauer et al., 2003; Gasull et al., 2003; Stumpff et al., 1997).
All AR agonists tested increased the baseline currents. Of particular interest was the observation that selective A1 and A2A AR agonists produced similar, and not opposite effects. In the experiment of Fig. 5, the A1-selective AR agonist S-ENBA (100 nM) initially increased the whole-cell currents by ~200% at an applied potential of +80 mV. Following drug washout, a second S-ENBA application again increased the currents, by ~100% at the same applied potential. At the end of the recording, the K+-channel blocker TEA reduced the current at +80 mV by >60%. The results of Fig. 6, obtained with the A2-selective AR agonist CGS-32680 (30 nM), were very similar. Again, successive applications, with an intervening washout, increased the baseline currents by 100–200%, and TEA blocked ~60% of the current measured at the conclusion of the trace, measured at +80 mV.
Fig. 5.
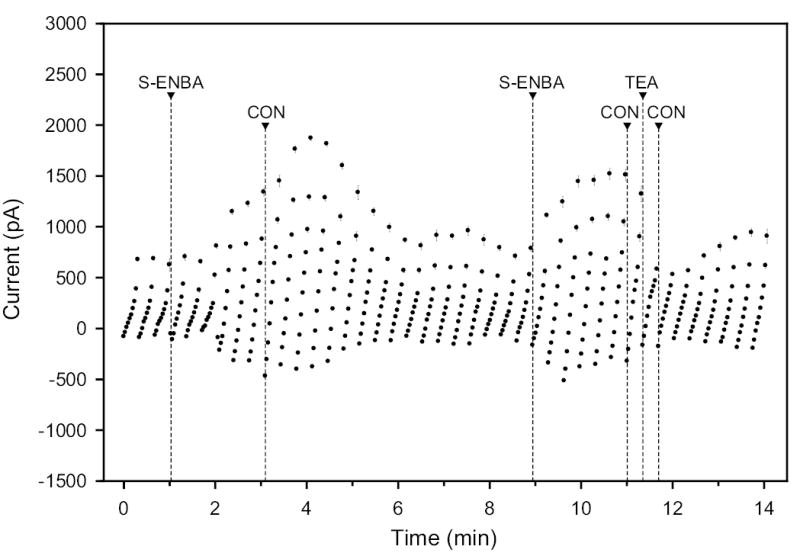
Effect of 100 nM S-ENBA (A1 agonist) and 7.5 mM TEA (K+-channel blocker) on whole-cell currents and subsequent washout with isotonic control solution (CON). The holding potential was −40 mV, and the step pulses were to values ranging from −100 to +80 mV in 20-mV steps.
Fig. 6.
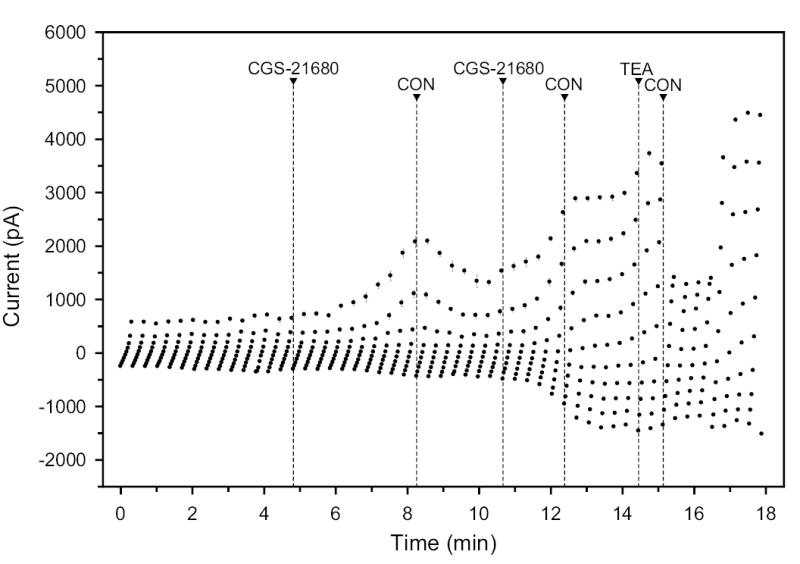
Effect of 30 nM CGS-21680 (A2A agonist) and 7.5 mM TEA (K+-channel blocker) after intermitting washout with isotonic control (CON) on whole-cell currents.
Overall, S-ENBA stimulated whole-cell currents in 11 of 13 applications to 7 cells, producing a mean increase of 52 ±16% (P<0.001); no response was noted in 2/13 drug perfusions. The A2A-selective AR agonist CGS-21680 (30 nM) increased whole-cell currents in 18 of 22 and had no effect in 4 of 22 applications to 11 cells, with a mean increase of 54 ±14%, P<0.001. The A3-selective AR agonist Cl-IB-MECA (30 nM) increased whole-cell currents in 10 and had no effect in 2 of 12 applications to 7 cells, leading to a mean increase of 36 ±16%, P<0.001). The consistently stimulatory effects of A1, A2A and A3 AR agonists led to an almost uniformly stimulatory effect of the non-specific agonist adenosine (10 μM). Adenosine activated currents in 14 of 15 and inhibited currents in only 1 of 15 applications to 9 cells, with a mean increase of 52 ±13% (P<0.001). Means ±SE were calculated by averaging all responses, including the non-responding cells (Fig. 7).
Fig. 7.
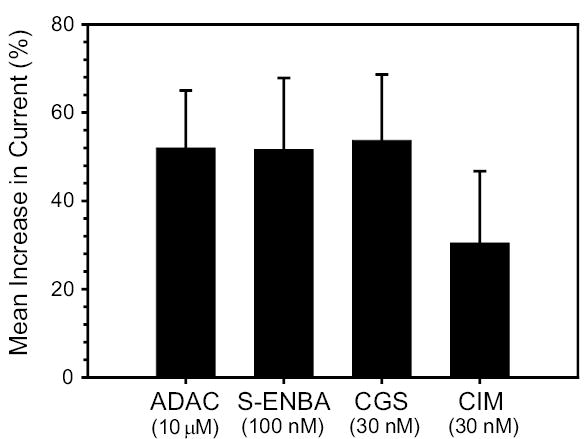
Summary of effects (means ±SE) of AR agonists on whole-cell currents.
4. Discussion
The salient findings of the current work are that: (1) A1, A2A and A3 agonists all increased the free intracellular Ca2+ concentration of these cells; (2) selective agonists to the A1, A2A and A3 ARs all reproducibly increased whole-cell currents of the hTM5 cells; and (3) selective A1, but not A2A or A3, AR agonists triggered shrinkage of hTM5 cells, measured by calcein-fluorescence quenching. Figure 8 summarizes and compares these results with those of previous studies of heterogeneous populations of human TM cells, inner-wall cells from human Sclemm’s canal, and explant-derived cells from human Schlemm’s canal.
Fig. 8.
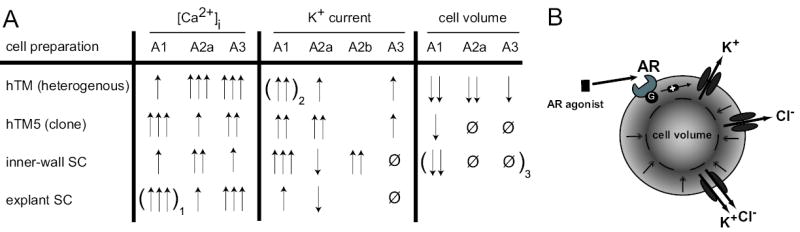
Summary of AR effect on different cells of the eye aqueous humor outflow pathway. 100nM CGS (A2A agonist) and 100nM Cl-IB-MECA (A3 agonist) were used for modulation of [Ca2+]I, K+ current and cell volume. For A1 stimulation 30nM ADAC or 100nM CPA were used for [Ca2+]I or K+ current and cell volume, respectively. In parenthesis: 1) 100nM CPA and 2) 100nM S-ENBA were used instead; 3) unpublished data. [Ca2+]I was rated by changes in nM and K+ currents and cell volume by Δ % as follows: ↑ <100nM / <50%; ↑↑ =100–200nM / =50–100%; ↑↑↑ >200nM / >100%; Ø = no effect; blanks = not done.
The responses of intracellular Ca2+ to all three subtype-selective AR agonists are consistent with previous reports that TM cells express A1 (Fleischhauer et al., 2003; Shearer & Crosson, 2002), A2A and A3 adenosine receptors (Fleischhauer et al., 2003). G-protein-coupled AR receptors are well known to change adenylyl cyclase activity and intracellular cAMP concentration, but it is now well established that other pathways, such as phospholipase C (PLC), Ca2+ and mitogen-activated protein kinases, are relevant as well (Haas & Selbach, 2000; Jacobson & Gao, 2006). Studying the Ca2+ transients is of particular interest because of calcium’s role in modulating contractility (Stumpff et al., 1997) and the actin cytoskeleton (Grosheva et al., 2006) of TM cells. Changes in intracellular calcium due to AR activation may stem from activation of PLC with subsequent formation of inositol triphosphate and/ or modulation of membrane calcium-channel activity (Lorentzen & Schwabe, 2001).
The responses of whole-cell currents to all three subtype-selective AR agonists are also consistent with previous indications of functional expression of A1, A2A and A3 ARs in TM cells (Fleischhauer et al., 2003; Shearer & Crosson, 2002). Current stimulation by AR agonists was more reproducible with the present hTM5 cells than with previous heterogeneous populations of TM cells (Fleischhauer et al., 2003), consistent with reports of functional TM-cell heterogeneity (de Kater et al., 1990; Stumpff et al., 1997). The currents observed conformed to previous reports of the prominence of TEA-inhibitable K+ currents in TM cells under isotonic conditions (Fleischhauer et al., 2003; Stumpff et al., 1997).
As noted in the Introduction, changes in TM-cell volume might possibly alter outflow resistance by altering the available adjacent space through which fluid could leave the anterior chamber (O’Donnell et al., 1995). In the present study, we found that only A1 agonists shrank hTM5 cells. Thus, volume changes of at least one subpopulation of TM cells might potentially mediate selective purinergic modulation of outflow. Further, the earlier observed shrinkage produced by A1, A2A and A3 (Fleischhauer et al., 2003) may have reflected responses of different subpopulations of TM cells to each of the selective agonists.
The absence of any observed opposing effects of A1 and A2A agonists on Ca2+, whole-cell currents or volume suggests that opposing purinergic effects on outflow resistance are not mediated by a single population of TM cells. The opposing outflow effects could be accounted for by either (1) two or more TM-cell subpopulations mediating the effects, or (2) inner-wall SC cells being the primary site of regulation, alone, or acting together with a TM-cell subpopulation. We have previously observed opposing effects of selective A1 and A2A on whole-cell currents in inner-wall Schlemm’s canal cells (Karl et al., 2005).
The mechanism by which cell-volume regulation of TM cells might modulate outflow resistance is unknown. As noted above, reduced cell volume has been hypothesized to reduce obstruction to fluid flow around cells (O’Donnell et al., 1995). Alternatively, a change in cell volume might trigger another downstream event, such as the reported A1-stimulated secretion of matrix metalloproteinase (Shearer & Crosson, 2002). Consequent remodelling of juxtacanalicular matrix might then modulate outflow resistance (Johnson, 2006).
In summary, We have been seeking a functional signature characteristic of outflow pathway cells to help interpret results obtained with more complex experimental preparations. For example, we expect that the pharmacologic profile of the isolated TM cells studied here will help us interpret electron-probe X-ray microanalyses of intact tissue exposed to purinergic agents. We have recently reported the feasibility of applying the electron probe to study human outflow tissue (Civan et al., 2006). The present results confirm that TM cells express functional A1, A2A and A3 receptors, but indicate that only A1 agonists shrink hTM5 cells. This is consistent with the possibility that reductions of outflow resistance triggered by A1 receptors might be mediated in part at the level of one or more subpopulations of TM cells.
Acknowledgments
Supported in part by research grant EY013624 (MMC) and core grant EY01583 from the National Institutes of Health, and a Fellowship from the Herbert Funke Foundation, Germany (MOK). We are grateful to to Dr. Abbot F. Clark and Alcon Laboratories, Inc for generously providing the hTM5 cells.
References
- Al-Aswad LA, Gong H, Lee D, O’Donnell ME, Brandt JD, Ryan WJ, Schroeder A, Erickson KA. Effects of Na-K-2Cl cotransport regulators on outflow facility in calf and human eyes in vitro. Invest Ophthalmol Vis Sci. 1999;40:1695–1701. [PubMed] [Google Scholar]
- Avila MY, Carré DA, Stone RA, Civan MM. Reliable measurement of mouse intraocular pressure by a servo-null micropipette system. Invest Ophthalmol Vis Sci. 2001a;42:1841–1846. [PubMed] [Google Scholar]
- Avila MY, Seidler RW, Stone RA, Civan MM. Inhibitors of NHE-1 Na+/H+ exchange reduce mouse intraocular pressure. Invest Ophthalmol Vis Sci. 2002a;43:1897–1902. [PubMed] [Google Scholar]
- Avila MY, Stone RA, Civan MM. A(1)-, A(2A)- and A(3)-subtype adenosine receptors modulate intraocular pressure in the mouse. Br J Pharmacol. 2001b;134:241–245. doi: 10.1038/sj.bjp.0704267. [DOI] [PMC free article] [PubMed] [Google Scholar]
- Avila MY, Stone RA, Civan MM. Knockout of A(3) adenosine receptors reduces mouse intraocular pressure. Invest Ophthalmol Vis Sci. 2002b;43:3021–3026. [PubMed] [Google Scholar]
- Carré DA, Mitchell CH, Peterson-Yantorno K, Coca-Prados M, Civan MM. Similarity of A(3)-adenosine and swelling-activated Cl(−) channels in nonpigmented ciliary epithelial cells. Am J Physiol Cell Physiol. 2000;279:C440–451. doi: 10.1152/ajpcell.2000.279.2.C440. [DOI] [PubMed] [Google Scholar]
- Civan MM, Macknight AD. The ins and outs of aqueous humour secretion. Exp Eye Res. 2004;78:625–631. doi: 10.1016/j.exer.2003.09.021. [DOI] [PubMed] [Google Scholar]
- Civan MM, McLaughlin CW, Zellhuber-Macmillan S, Karl M, Wang Z, Macknight ADC. Electron Probe X-Ray Microanalyses of Cells in Schlemm’S Canal, Juxtacanalicular Tissue and Trabecular Meshwork of Intact Human Tissue. Invest Ophthalmol Vis Sci. 2006;47:408. [Google Scholar]
- Crook RB, Takahashi K, Mead A, Dunn JJ, Sears ML. The role of NaKCl cotransport in blood-to-aqueous chloride fluxes across rabbit ciliary epithelium. Invest Ophthalmol Vis Sci. 2000;41:2574–2583. [PubMed] [Google Scholar]
- Crosson CE. Adenosine receptor activation modulates intraocular pressure in rabbits. J Pharmacol Exp Ther. 1995;273:320–326. [PubMed] [Google Scholar]
- Crosson CE. Intraocular pressure responses to the adenosine agonist cyclohexyladenosine: evidence for a dual mechanism of action. Invest Ophthalmol Vis Sci. 2001;42:1837–1840. [PubMed] [Google Scholar]
- Crosson CE, Gray T. Characterization of ocular hypertension induced by adenosine agonists. Invest Ophthalmol Vis Sci. 1996;37:1833–1839. [PubMed] [Google Scholar]
- de Kater AW, Spurr-Michaud SJ, Gipson IK. Localization of smooth muscle myosin-containing cells in the aqueous outflow pathway. Invest Ophthalmol Vis Sci. 1990;31:347–353. [PubMed] [Google Scholar]
- de Zwart M, Link R, von Frijtag Drabbe Kunzel JK, Cristalli G, Jacobson KA, Townsend-Nicholson A, AP IJ. A functional screening of adenosine analogues at the adenosine A2B receptor: a search for potent agonists. Nucleosides Nucleotides. 1998;17:969–985. doi: 10.1080/07328319808004215. [DOI] [PMC free article] [PubMed] [Google Scholar]
- Do CW, Civan MM. Basis of chloride transport in ciliary epithelium. J Membr Biol. 2004;200:1–13. doi: 10.1007/s00232-004-0688-5. [DOI] [PubMed] [Google Scholar]
- Do CW, Peterson-Yantorno K, Civan MM. Swelling-activated Cl− channels support Cl− secretion by bovine ciliary epithelium. Invest Ophthalmol Vis Sci. 2006;47:2576–2582. doi: 10.1167/iovs.05-0851. [DOI] [PubMed] [Google Scholar]
- Do CW, Peterson-Yantorno K, Mitchell CH, Civan MM. cAMP-activated maxi-Cl(−) channels in native bovine pigmented ciliary epithelial cells. Am J Physiol Cell Physiol. 2004;287:C1003–1011. doi: 10.1152/ajpcell.00175.2004. [DOI] [PubMed] [Google Scholar]
- Engelmann K, Friedl P. Optimization of culture conditions for human corneal endothelial cells. In Vitro Cell Dev Biol. 1989;25:1065–1072. doi: 10.1007/BF02624143. [DOI] [PubMed] [Google Scholar]
- Epsztejn S, Kakhlon O, Glickstein H, Breuer W, Cabantchik I. Fluorescence analysis of the labile iron pool of mammalian cells. Anal Biochem. 1997;248:31–40. doi: 10.1006/abio.1997.2126. [DOI] [PubMed] [Google Scholar]
- Ethier CR. The inner wall of Schlemm’s canal. Exp Eye Res. 2002;74:161–172. doi: 10.1006/exer.2002.1144. [DOI] [PubMed] [Google Scholar]
- Fleischhauer JC, Mitchell CH, Stamer WD, Karl MO, Peterson-Yantorno K, Civan MM. Common actions of adenosine receptor agonists in modulating human trabecular meshwork cell transport. J Membr Biol. 2003;193:121–136. doi: 10.1007/s00232-002-2013-5. [DOI] [PubMed] [Google Scholar]
- Fredholm BB, AP IJ, Jacobson KA, Klotz KN, Linden J. International Union of Pharmacology. XXV. Nomenclature and classification of adenosine receptors. Pharmacol Rev. 2001a;53:527–552. [PMC free article] [PubMed] [Google Scholar]
- Fredholm BB, Irenius E, Kull B, Schulte G. Comparison of the potency of adenosine as an agonist at human adenosine receptors expressed in Chinese hamster ovary cells. Biochem Pharmacol. 2001b;61:443–448. doi: 10.1016/s0006-2952(00)00570-0. [DOI] [PubMed] [Google Scholar]
- Gasull X, Ferrer E, Llobet A, Castellano A, Nicolas JM, Pales J, Gual A. Cell membrane stretch modulates the high-conductance Ca2+-activated K+ channel in bovine trabecular meshwork cells. Invest Ophthalmol Vis Sci. 2003;44:706–714. doi: 10.1167/iovs.02-0384. [DOI] [PubMed] [Google Scholar]
- Grosheva I, Vittitow JL, Goichberg P, Gabelt BT, Kaufman PL, Borras T, Geiger B, Bershadsky AD. Caldesmon effects on the actin cytoskeleton and cell adhesion in cultured HTM cells. Exp Eye Res. 2006;82:945–958. doi: 10.1016/j.exer.2006.01.006. [DOI] [PubMed] [Google Scholar]
- Grynkiewicz G, Poenie M, Tsien RY. A new generation of Ca2+ indicators with greatly improved fluorescence properties. J Biol Chem. 1985;260:3440–3450. [PubMed] [Google Scholar]
- Gual A, Llobet A, Gilabert R, Borras M, Pales J, Bergamini MV, Belmonte C. Effects of time of storage, albumin, and osmolality changes on outflow facility (C) of bovine anterior segment in vitro. Invest Ophthalmol Vis Sci. 1997;38:2165–2171. [PubMed] [Google Scholar]
- Haas HL, Selbach O. Functions of neuronal adenosine receptors. Naunyn Schmiedebergs Arch Pharmacol. 2000;362:375–381. doi: 10.1007/s002100000314. [DOI] [PubMed] [Google Scholar]
- Hamann S, Kiilgaard JF, Litman T, Alvarez-Leefmans FJ, Winther BR, Zeuthen T. Measurement of cell volume changes by fluorescence self-quenching. J Fluoresc. 2002;12:139–145. [Google Scholar]
- Howard GC, Roberts BC, Epstein DL, Pizzo SV. Characterization of alpha 2-macroglobulin binding to human trabecular meshwork cells: presence of the alpha 2-macroglobulin signaling receptor. Arch Biochem Biophys. 1996;333:19–26. doi: 10.1006/abbi.1996.0359. [DOI] [PubMed] [Google Scholar]
- Jacobson KA, Gao ZG. Adenosine receptors as therapeutic targets. Nat Rev Drug Discov. 2006;5:247–264. doi: 10.1038/nrd1983. [DOI] [PMC free article] [PubMed] [Google Scholar]
- Jacobson KA, Knutsen LJS. P1 and P2 Purine and Pyrimidine receptor ligands. In: Abbracchio MP, Williams M, editors. Purinergic and Pyrimidinergic signalling. Springer; New York: 2001. pp. 129–175. [Google Scholar]
- Johnson M. ‘What controls aqueous humour outflow resistance? ’ Exp Eye Res. 2006;82:545–557. doi: 10.1016/j.exer.2005.10.011. [DOI] [PMC free article] [PubMed] [Google Scholar]
- Johnson M, Erickson K. Mechanism and Routes of Aqueous Humor Drainage. In: Albert DM, Jakobiec FA, editors. Principles and Practice of Ophthalmology. WB Saunders Co.; Philadelphia: 2000. pp. 2577–2595. [Google Scholar]
- Karl MO, Fleischhauer JC, Stamer WD, Peterson-Yantorno K, Mitchell CH, Stone RA, Civan MM. Differential P1-purinergic modulation of human Schlemm’s canal inner-wall cells. Am J Physiol Cell Physiol. 2005;288:C784–794. doi: 10.1152/ajpcell.00333.2004. [DOI] [PubMed] [Google Scholar]
- Klotz KN. Adenosine receptors and their ligands. Naunyn Schmiedebergs Arch Pharmacol. 2000;362:382–391. doi: 10.1007/s002100000315. [DOI] [PubMed] [Google Scholar]
- Lorentzen A, Schwabe U. P1 receptors. In: Abbrachio MP, Williams M, editors. Purinergic and Pyrimidinergic Signaling I: Molecular, Nervous and Urogenitary System Function, chapter 2. Springer; Berlin, Heidelberg and New York: 2001. pp. 19–45. [Google Scholar]
- Mitchell CH, Fleischhauer JC, Stamer WD, Peterson-Yantorno K, Civan MM. Human trabecular meshwork cell volume regulation. Am J Physiol. 2002;283:C315–C326. doi: 10.1152/ajpcell.00544.2001. [DOI] [PubMed] [Google Scholar]
- O’Donnell ME, Brandt JD, Curry FR. Na-K-Cl cotransport regulates intracellular volume and monolayer permeability of trabecular meshwork cells. Am J Physiol. 1995;268:C1067–1074. doi: 10.1152/ajpcell.1995.268.4.C1067. [DOI] [PubMed] [Google Scholar]
- Pang IH, Shade DL, Clark AF, Steely HT, DeSantis L. Preliminary characterization of a transformed cell strain derived from human trabecular meshwork. Curr Eye Res. 1994;13:51–63. doi: 10.3109/02713689409042398. [DOI] [PubMed] [Google Scholar]
- Raviola G, Raviola E. Intercellular junctions in the ciliary epithelium. Invest Ophthalmol Vis Sci. 1978;17:958–981. [PubMed] [Google Scholar]
- Rohen JW. Experimental studies on the trabecular meshwork in primates. Arch Ophthalmol. 1963;69:91–105. doi: 10.1001/archopht.1963.00960040341016. [DOI] [PubMed] [Google Scholar]
- Schlötzer-Schrehardt U, Zenkel M, Decking U, Haubs D, Kruse FE, Junemann A, Coca-Prados M, Naumann GO. Selective upregulation of the A3 adenosine receptor in eyes with pseudoexfoliation syndrome and glaucoma. Invest Ophthalmol Vis Sci. 2005;46:2023–2034. doi: 10.1167/iovs.04-0915. [DOI] [PubMed] [Google Scholar]
- Shearer TW, Crosson CE. Adenosine A1 receptor modulation of MMP-2 secretion by trabecular meshwork cells. Invest Ophthalmol Vis Sci. 2002;43:3016–3020. [PubMed] [Google Scholar]
- Solenov E, Watanabe H, Manley GT, Verkman AS. Sevenfold-reduced osmotic water permeability in primary astrocyte cultures from AQP-4-deficient mice, measured by a fluorescence quenching method. Am J Physiol Cell Physiol. 2004;286:C426–432. doi: 10.1152/ajpcell.00298.2003. [DOI] [PubMed] [Google Scholar]
- Stumpff F, Strauss O, Boxberger M, Wiederholt M. Characterization of maxi-K-channels in bovine trabecular meshwork and their activation by cyclic guanosine monophosphate. Invest Ophthalmol Vis Sci. 1997;38:1883–1892. [PubMed] [Google Scholar]
- Tian B, Gabelt BT, Crosson CE, Kaufman PL. Effects of adenosine agonists on intraocular pressure and aqueous humor dynamics in cynomolgus monkeys. Exp Eye Res. 1997;64:979–989. doi: 10.1006/exer.1997.0296. [DOI] [PubMed] [Google Scholar]
- To CH, Do CW, Zamudio AC, Candia OA. Model of ionic transport for bovine ciliary epithelium: effects of acetazolamide and HCO. Am J Physiol Cell Physiol. 2001;280:C1521–1530. doi: 10.1152/ajpcell.2001.280.6.C1521. [DOI] [PubMed] [Google Scholar]
- Walker VE, Stelling JW, Miley HE, Jacob TJ. Effect of coupling on volume-regulatory response of ciliary epithelial cells suggests mechanism for secretion. Am J Physiol. 1999;276:C1432–1438. doi: 10.1152/ajpcell.1999.276.6.C1432. [DOI] [PubMed] [Google Scholar]