

Abstract
Type 2 diabetes (T2DM) is characterized by impaired glucose tolerance (IGT) and insulin resistance with respect to glucose metabolism, but not amino acid metabolism. We examined whether whole body leucine and protein metabolism are dysregulated in HIV-infected people with IGT. Glucose and leucine kinetics were measured under fasting insulin conditions and during euglycemic-hyperinsulinemia using primed constant infusions of 2H2-glucose and 13C-leucine in 10 HIV-seronegative control subjects, 16 HIV+ with normal glucose tolerance, and 21 HIV+IGT. Glucose disposal rate during hyperinsulinemia was lower in HIV+IGT than the other two groups. Absolute plasma leucine levels and rate of appearance (whole body proteolysis) were higher in HIV+IGT at all insulin levels, but declined in response to hyperinsulinemia in parallel to those in the other two groups. HIV+IGT had greater visceral adiposity, fasting serum IL-8 and FFA levels, and higher lipid oxidation rates during the clamp than the other two groups. The findings implicate several factors in the insulin-signaling pathway that may be further dysregulated in HIV+IGT, and support the notion that insulin-signaling pathways for glucose and leucine metabolism may be disrupted by increased proinflammatory adipocytokines (IL-8) and increased lipid oxidation. Increased proteolysis may provide amino acids for gluconeogenesis; exacerbating hyperglycemia in HIV.
Keywords: muscle amino acid metabolism, insulin signaling, adipocytokine, lipotoxicity, substrate partitioning, mass spectrometry, stable isotope tracer methods
Abbreviations: HIV=human immunodeficiency virus, AIDS=acquired immunodeficiency syndrome, HAART=highly active antiretroviral therapy, FFM=fat-free mass, T2DM=type 2 diabetes mellitus, BCAA=branched chain amino acids, Rd=rate of disposal, Ra=rate of appearance, IGT=impaired glucose tolerance, FFA=serum free fatty acids, VAT=visceral adipose tissue content, SAT=subcutaneous adipose tissue content, TAT=total adipose tissue content, HOMA=homeostasis model assessment of insulin resistance, RIA=radioimmunoassay, NRTI= nucleoside analog reverse transcriptase inhibitors, NNRTI= non-nucleoside analog reverse transcriptase inhibitor, PI= protease inhibitor
Type 2 diabetes (T2DM) is characterized by impaired insulin-stimulated glucose disposal (Rd) in skeletal muscle and adipose tissues. Specific impairments in intracellular glucose metabolism have been described, including diminished glucose transport, glycogen synthesis, glycolysis, and glucose oxidation (1; 2). T2DM is also characterized by blunted insulin-mediated suppression of lipolysis and endogenous glucose production, and impaired fatty acid utilization (1).
Conversely, impairments in whole body amino acid and protein metabolism have rarely been found in T2DM (3–6). Fasting plasma amino acid concentrations in T2DM are similar to those in healthy control subjects (4). While insulin-stimulated glucose Rd is lower in T2DM, whole body phenylalanine, tyrosine, and leucine kinetic rates, when expressed per kg fat-free mass (FFM), are not different from those in healthy control subjects (3–5). T2DM has not been associated with an elevated rate of leucine oxidation or a greater rate of whole body proteolysis, except in lean subjects with T2DM (7) and in non-obese, insulin-resistant offspring of T2DM patients (2). Mixed muscle, mitochondrial and sarcoplasmic protein synthesis rates were similar in untreated and treated T2DM, and healthy control subjects (4). Leucine nitrogen flux and transamination rates were elevated when insulin was withdrawn (for 2wks) from T2DM, but these rates normalized when insulin therapy was restored (4). During hyperinsulinemic-euglycemic clamp studies, the insulin-stimulated reduction in whole body proteolysis rate (plasma leucine rate of appearance; Ra) was not different between T2DM and control subjects, despite a lower insulin-stimulated glucose Rd in T2DM. The rate of gluconeogenesis was elevated in T2DM when circulating glucose levels were high, but whole body proteolysis rate was normal under these conditions (8). Overall, defects in insulin action on lipolysis, glucose disposal and production, do not appear to extend to amino acid metabolism in T2DM.
Infection with the human immunodeficiency virus (HIV) and treatment with highly active antiretroviral therapy (HAART) have been associated with an increased incidence of hyperglycemia and insulin resistance. The mechanism is multifactorial, and likely comprises the effects of chronic viral infection, host response, anti-HIV medications, genetics, lifestyle/behavioral factors on intracellular signaling pathways, substrate partitioning and sensing (9; 10). Several groups have reported that HIV-associated insulin resistance is characterized by perturbations in glucose and lipid metabolism that are common to T2DM (11–19). Whether HIV-associated insulin resistance is associated with defects in amino acid and protein metabolism has not been addressed. Based on T2DM, we hypothesized that HIV-infected people with IGT would have normal basal whole body leucine and protein kinetic rates that would suppress normally during a hyperinsulinemic-euglycemic clamp. We found basal leucine Ra and protein breakdown rate were markedly elevated in HIV+IGT, but they suppressed normally during hyperinsulinemic-euglycemia. These findings point to several potential insulin-signaling and metabolic pathways that may be integrated and involved in the pathogenesis of HIV-metabolic syndromes.
Research Design and Methods
Subjects
HIV-infected and HIV-seronegative men and women were recruited from the AIDS Clinical Trials Unit, the Infectious Disease Clinics, and the Volunteers for Health Program at Washington University School of Medicine (Table 1). None of the subjects had an AIDS diagnosis. Subjects were assigned to one of three groups; HIV-seronegative with normal glucose tolerance (Ctrl; n=10); HIV-infected with normal glucose tolerance (HIV+NGT; n=16), or HIV-infected with impaired glucose tolerance (HIV+IGT; n=21). IGT was defined as fasting glucose 100–126 mg/dL or glucose value 140–200mg/dL 2-hrs after ingesting a 75-gram glucose beverage (ADA criteria). Glucose and fatty acid kinetics for 30 of these 47 subjects were reported previously in a study of men with HIV-dyslipidemia (11).
Table 1.
Descriptive characteristics and body composition.
| Parameter | CTRL | HIV+ NGT | HIV+ IGT | P-value |
|---|---|---|---|---|
| N (wo/men) | 4/6 | 2/14 | 4/17 | 0.24 |
| Age (yr) | 36 ± 9 | 37 ± 9 | 43 ± 9 | 0.15 |
| HIV RNA (copies/mL) | -- | 7 ± 17 x103 | 2 ± 4 x10³ | 0.12 |
| CD4 (cells/μl) | 746 ± 414 | 485 ± 146 | 579 ± 261 | 0.48 |
| Yrs known HIV+ | -- | 5.1 ± 5.1 | 8.6 ± 4.5 | 0.01 |
| Weight (kg) | 80 ± 18 | 79 ± 10 | 77 ± 13 | 0.80 |
| BMI (kg/m2) | 27 ± 4 | 26 ± 3 | 27 ± 4 | 0.51 |
| % Body Fat | 26 ± 9 | 21 ± 6 | 24 ± 9 | 0.28 |
| FFM (kg) | 58 ± 12 | 62 ± 9 | 58 ± 2 | 0.40 |
| Abdominal adipose area (cm2) | ||||
| Subcutaneous | 181 ± 102 | 155 ± 57 | 184 ± 98 | 0.65 |
| Visceral | 119 ± 96 | 117 ± 53 | 206 ± 103 | 0.05 HIV+IGT> HIV+NGT & CTRL |
| Liver Lipid Content (%) | 1.6 ± 1.1 | 1.5 ± 1.3 | 8.4 ± 9.6 | 0.02 HIV+IGT> HIV+NGT & CTRL |
Mean ± SD; CTRL= seronegative control, HIV+ NGT= HIV-infected with normal glucose tolerance, HIV+ IGT= HIV-infected with impaired glucose tolerance. P-values calculated using Kruskal-Wallis non-parametric test.
Before enrollment, volunteers received a physical examination, including a medical history, fasting blood chemistry, lipid/lipoprotein and serum endocrine profile, a 2hr oral glucose tolerance test, and plasma HIV RNA quantitation (Roche Amplicor HIV-1 Monitor®; Roche Diagnostics Corporation, Indianapolis, IN). Current anti-HIV medication regimens were compiled for the HIV-infected participants. Volunteers were excluded if they were taking medications or dietary supplements that affect amino acid metabolism (β-blocker, β-agonist, Ca2+ channel blocker, corticosteroid), had a neuromuscular (severe peripheral neuropathy) or other disorder that might affect amino acid metabolism. All subjects consumed <3 alcohol-containing beverages per week, were not infected with hepatitis C or B, reported not using recreational drugs for 6 months prior to enrollment, and were weight stable (less than 2% weight change in the 3 months prior to the study). None of the subjects took anabolic agents or appetite stimulants for at least 6 months prior to study. None of the subjects participated regularly in exercise activities that would constitute exercise training. The Human Studies Committee at Washington University School of Medicine approved the study and all subjects provided informed consent before participating.
Dietary control
Subjects were admitted to the General Clinical Research Center (GCRC) for a 48-hr period. For 3 days prior to admission and on day 1 of admission, they consumed a standard weight maintaining diet that contained defined, adequate amounts of energy and macronutrients; at least 250 g of carbohydrate/day and ~12% protein, ~55% carbohydrate, and ~33% fat calories. Compliance with these guidelines was assessed using 3-day food recall records that were reviewed by a GCRC dietician. This was done to reduce the effects of prior diet on substrate metabolism quantified during the glucose clamp (day 2 of the GCRC admission). During the GCRC admission, participants abstained from exercise, caffeine or alcohol ingestion.
Body composition assessment
Whole body fat and FFM were quantified using a Hologic QDR-2000 enhanced-array dual energy x-ray absorptiometer (Waltham, MA). Images were processed by a certified technologist using Hologic software (v5.64A)(20). Abdominal (subcutaneous and visceral) fat content was quantified using proton magnetic resonance imaging (Siemens, Iselin, NJ). Each was identified in serial axial images obtained at the level of the L2-L3 interspace, and their areas (cm2) measured using Analyze Direct software (21). Areas from 8 serial images of the abdomen were averaged. Intrahepatic lipid content was quantified using proton magnetic resonance spectroscopy (1.5T whole-body system; Magnetom Sonata; Siemens, Erlangen, Germany) (22). Intrahepatic lipid content (% of water signal) was measured in 9/10 Ctrl subjects, 13/16 HIV+NGT, and 16/21 HIV+IGT.
Hyperinsulinemic-euglycemic clamp
After an overnight fast (from 2000h), a catheter was inserted into an antecubital vein (0530h) and used to administer stable isotope labeled tracers. A second catheter was inserted into a hand vein on the contralateral arm; the hand was heated (55°C) using a thermostatically controlled box to obtain arterialized venous blood samples. At 0700h, primed (22.5 μmol/kg), constant (0.25 μmol/kg/min) intravenous infusions of [6,6-2H2]-glucose (22.5 μmol/kg; 0.25 μmol/kg/min) and [1-13C]-leucine (7.6 μmol/kg; 0.13 μmol/kg/min) were started. All tracers were from Cambridge Isotope Laboratories (Andover, MA). After a baseline period (0–210 min), a two-stage hyperinsulinemic-euglycemic clamp was started. During stage 1 of the clamp, a primed (80 mU/m2/min x 5 minutes, 40 mU/m2/min x 5 minutes) constant (20 mU/m2/min) infusion of regular human insulin was administered intravenously and continued for 2hr. During stage 2, a primed (160 mU/m2/min, 80 mU/m2/min), constant (40 mU/m2/min), infusion of human insulin was started and continued for 4hr. The 2H2-glucose infusion rate was reduced by 50% of the basal infusion rate during stage 1, and by 75% during stage 2 to allow for the anticipated decline in glucose Ra during insulin infusion. Plasma glucose concentration was maintained at 5.5 mM (100 mg/dL) by a variable rate infusion of 20% dextrose containing 2.5% [6,6-2H2]-glucose.
Blood samples were obtained before starting the tracer infusions to quantify background 2H- and 13C-enrichments, and every 10 min during the last 30 min of the basal period and during each stage of the clamp to quantify hormone levels, substrate levels and kinetics. Blood samples were obtained every 10 min during the clamp to quantify plasma glucose concentrations, and used to adjust the variable 20% dextrose infusion rate.
Substrate utilization
An automated indirect calorimeter with a ventilated hood system (Sensormedics Deltatrac, Yorba Linda, CA) was used to quantify O2 consumption and CO2 production rates, and calculate respiratory exchange ratio (RER) during the last 15 min of the basal, stage 1 and 2 periods of the clamp. During the GCRC admission, urine nitrogen excretion was quantified and used to correct RER and substrate utilization rates for the contribution of protein utilization.
Sample analyses
Plasma glucose concentration was quantified using an automated glucose analyzer (Yellow Spring Instruments Co, Yellow Springs, OH). Plasma insulin concentration was quantified using RIA (23). Fasting serum non-esterified fatty acid levels (FFA) were quantified using a commercial assay (Wako Chemicals USA, Inc., Richmond, VA). Fasting serum lipid/lipoprotein levels were quantified as described previously (21). Fasting serum IL-8 concentrations were quantified using a commercially available antibody-bead based 96-well microplate assay (Bio-Rad Laboratories, Inc., Hercules, CA) following the manufacturer’s protocol. Serum samples were diluted 1:4 in human serum diluent and analyzed in duplicate. Eight calibration standards (0.2–3200 pg/mL) were analyzed in duplicate on each microplate. The coefficient of variation for replicate analyses was <7% for samples and standards in the concentration range 3–3200 pg/mL, and <16% for those with <3 pg/mL.
The tracer to tracee ratios (TTR) for plasma 2H2-glucose, 13C-leucine, and 13C-ketoisocaproic acid (KIC) were quantified using capillary gas chromatography-mass spectrometry (GC-MS; Agilent 6890N gas chromatograph and Agilent 5973N mass selective detector, Palo Alto, CA) (20; 24; 25). For 2H2-glucose enrichment quantitation, plasma proteins were precipitated with cold acetone, lipids were extracted into hexane, and the aqueous phase was dried (Speed-Vac; Savant Instruments, Farmingdale, NY). The heptafluorobutyric derivative of glucose was formed and 2H2-glucose enrichment was quantified using GC-electron ionization-MS and selective ion monitoring (m/z 519 and 521). For quantitation of plasma leucine concentration, an internal standard ([U-13C6]-leucine) was added to the plasma before isolation. Plasma leucine was converted to the heptafluorobutyric propyl ester derivative; 13C-leucine enrichment was quantified using GC-MS in negative-chemical ionization mode (m/z 349 and 350), and leucine concentration was quantified by monitoring ions at m/z 349 and 355. In the same blood samples, plasma KIC was isolated, the trimethylsilyl derivative was formed, and 13C enrichment was measured using GC-electron ionization-MS and selected ion monitoring (m/z 232 and 233)(20). The GC-MS instrument response was calibrated using gravimetric standards of known isotope enrichment.
Calculations
Plasma glucose and leucine Ra were calculated by dividing each tracer infusion rate by the average TTR obtained during the last 30min of each stage of the clamp. Glucose Rd was calculated as the sum of endogenous glucose Ra plus infused dextrose. Non-oxidative glucose Rd was determined by subtracting carbohydrate oxidation rate from whole body glucose Rd. The average plasma 13C-KIC enrichment value obtained during the last 30min of each stage of the clamp was used to calculate the rate of whole body proteolysis (20; 26). Kinetic rates were expressed per kg FFM. HOMA was calculated as described (27).
Statistical analyses
Descriptive characteristics, fasting lipid/lipoprotein levels, liver enzymes, and endocrine profiles were compared using Kruskal-Wallis non-parametric tests. Several of these variables had non-homogeneous variance, so a non-parametric test was used, and reported values represent mean±SD. One-way analysis of variance (ANOVA) was used to compare hormone and substrate levels and substrate kinetics during the clamp among the 3 groups. In general, clamp-related metabolic parameters varied less, had more homogeneous variance than the descriptive parameters, and reported values represent mean±SEM. When significant differences were noted (P<0.05) among the 3 groups, a Tukey HSD post-hoc test was used to identify which groups differed. Pearson correlation coefficients were calculated and used to assess bivariate associations between continuous variables.
Results
Subject characteristics
The 3 groups were similar (P=ns) with respect to gender distribution, age, BMI, and FFM. HIV+NGT and HIV+IGT had similar plasma HIV RNA levels and CD4 counts, but HIV+IGT had a longer duration of known HIV infection and treatment with ART than HIV+NGT (Table 1). The median plasma HIV RNA levels for HIV+NGT and HIV+IGT was 0; 63% HIV+NGT and 81% HIV+IGT had plasma HIV RNA <400 copies/mL. Median CD4 counts were not different (HIV+NGT=496 vs HIV+IGT= 501 cells/μL; P=ns).
ART Medications
Seven of sixteen HIV+NGT subjects were naïve to HAART. Of the remaining 9 HIV+NGT subjects, all were receiving NRTIs (6 on zidovudine, 2 on stavudine, 1 on lamivudine + didanosine); 6 of these were also receiving a NNRTI (5 on efavirenz, 1 on nevirapine); and 3 were receiving PIs (1 on nelfinavir, 2 on ritonavir-boosted lopinavir). In HIV+IGT, 2 of 21 subjects were naïve to HAART. Of the remaining 19 subjects, all were receiving NRTIs (7 on zidovudine, 7 on stavudine, 2 on lamivudine + didanosine, 1 on lamivudine + abacavir, 2 on abacavir + didanosine), 11 of these also received a NNRTI (7 on efavirenz, 4 on nevirapine), and 12 received PIs (5 on nelfinavir, 2 on ritonavir-boosted lopinavir, 1 on ritonavir-boosted amprenavir, 1 on ritonavir-boosted saquinavir, 3 on indinavir).
Regional body composition
Visceral adipose tissue area and liver lipid content were higher in HIV+IGT than the other two groups (Table 1). Liver lipid content and visceral adipose area were correlated (P<0.001, r=0.66). Liver lipid content was also directly correlated with fasting insulin levels (P=0.006, r=0.44), and HOMA (P=0.004, r=0.46), and inversely correlated with glucose Rd (P=0.03, r= −0.36) during clamp stage 2.
Hormone and Substrate Levels (Table 2)
Table 2.
Fasting blood chemistry profile.
| Parameter | CTRL | HIV+ NGT | HIV+ IGT | P-value |
|---|---|---|---|---|
| Glucose (mM) | 4.8 ± 0.1 | 5.0 ± 0.1 | 5.4 ± 0.1 | 0.002 HIV+IGT>CTRL |
| Insulin (pM) | 30 ± 18 | 36 ± 18 | 84 ± 48 | 0.001 HIV+IGT> HIV+NGT & CTRL |
| Glucagon (pg/mL) | 118 ± 40 | 96 ± 22 | 89 ± 34 | 0.09 |
| HOMA index | 1.1 ± 0.8 | 1.4 ± 0.6 | 3.4 ± 2.1 | 0.003 HIV+IGT > HIV+NGT & CTRL |
| Leptin (ng/mL) | 13.2 ± 8.0 | 5.7 ± 4.5 | 7.5 ± 7.6 | 0.06 |
| Epinephrine (pM) | 30 ± 17 | 26 ± 13 | 29 ± 21 | 0.51 |
| Norepinephrine (nM) | 178 ± 46 | 213 ± 76 | 235 ± 93 | 0.15 |
| Total Testosterone (ng/dL) | 598 ± 164 | 507 ± 127 | 446 ± 225 | 0.16 |
| Cortisol (μg/dL) | 10 ± 4 | 11 ± 3 | 11 ± 5 | 0.93 |
| IL-8 (pg/mL) | 4.1 ± 2.6 | 6.7 ± 2.6 | 9.4 ± 4.2 | 0.008 HIV+IGT > CTRL |
| Triglycerides (mg/dL) | 103 ± 53 | 207 ± 298 | 371 ± 262 | 0.001 HIV+IGT> HIV+NGT & CTRL |
| FFA (μM) | 345 ± 104 | 297 ± 129 | 434 ± 136 | 0.004 HIV+IGT> HIV+NGT |
Mean ± SD; CTRL= seronegative control, HIV+ NGT= HIV-infected with normal glucose tolerance, HIV+ IGT= HIV-infected with impaired glucose tolerance. P-values calculated using Kruskal-Wallis non-parametric test.
As anticipated, fasting insulin levels and HOMA were higher in HIV+IGT than the other two groups. Fasting blood glucose levels were in the normal range, but greater in HIV+IGT than Ctrl. Blood lactate and serum IL-8 levels were higher in HIV+IGT than the other two groups. Serum IL-8 levels were directly correlated with visceral adiposity (P=0.01, r=0.39) and insulin resistance (HOMA; P=0.01, r=0.38), and inversely correlated with glucose Rd during stage 2 of the clamp (P=0.03, r=−0.34). Plasma triglyceride concentrations were greater in HIV+IGT than the other groups. Fasting serum FFA levels were higher in HIV+IGT than HIV+NGT. Serum FFA concentrations were inversely correlated with whole body glucose Rd measured during low (P=0.005, r=−0.41) and high (P=0.05, r=−0.29) insulin doses, and directly correlated with basal insulin levels (P=0.02, r=0.31), HOMA index (P=0.003, r=0.42), and liver lipid content (P=0.05, r=0.31). Fasting glucagon, leptin, cortisol, testosterone, epinephrine and norepinephrine levels were not different among the groups.
Plasma leucine and insulin concentrations (Fig 1)
Figure 1.
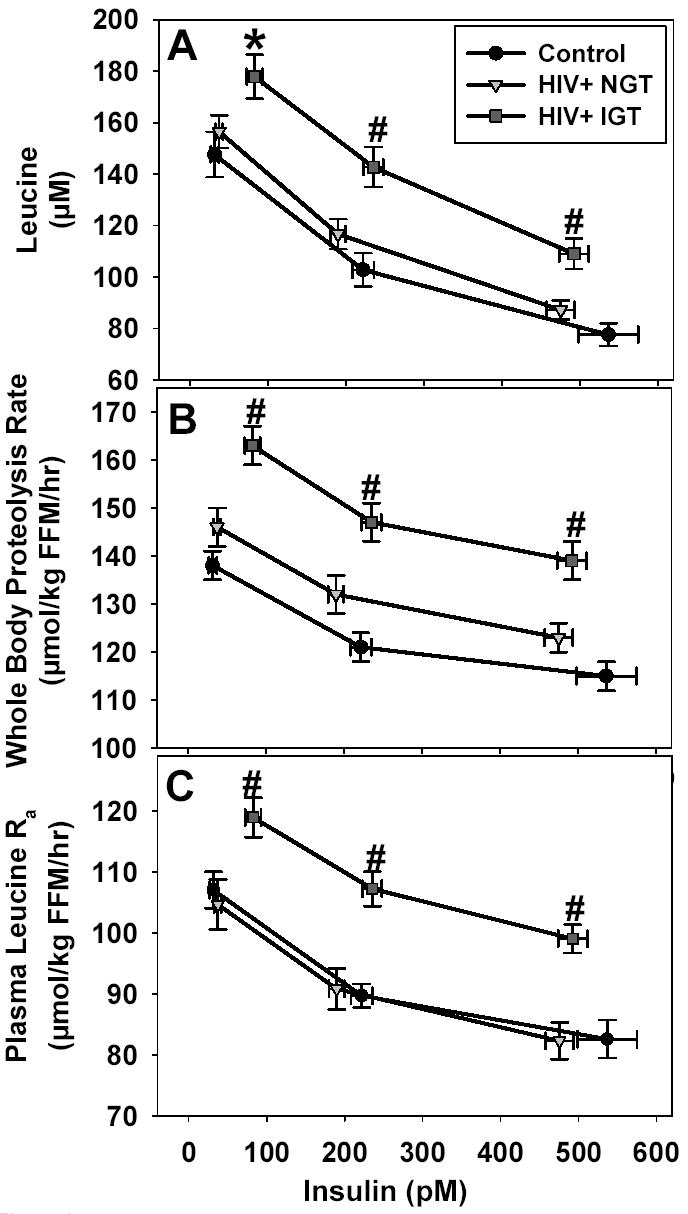
(A)Plasma leucine concentrations in HIV+IGT were higher than Ctrl at basal insulin and all insulin levels attained during the insulin-glucose clamp, and higher than HIV+NGT during clamp stages 1 and 2 (*P=0.05 HIV+IGT > Ctrl; #P<0.03 HIV+IGT > HIV+NGT and Ctrl). Basal insulin concentrations in HIV+IGT were higher than HIV+NGT and Ctrl (P<0.001). During clamp stage 2, insulin concentrations in HIV+IGT were higher than HIV+NGT (P=0.02). (B)Whole-body proteolysis rate, and (C)Plasma leucine Ra were higher in HIV+IGT than HIV+NGT and Ctrl at all insulin concentrations during the clamp (#P<0.005 HIV+IGT > HIV+NGT and Ctrl), and indicate that despite higher insulin levels in HIV+IGT, whole body leucine and protein metabolism in HIV+IGT were dysregulated in comparison to HIV+NGT and Ctrl. Mean ± SEM for concentrations, kinetic rates, and corresponding insulin levels are plotted.
Mean basal leucine concentration in HIV+IGT was higher than Ctrl, and higher than Ctrl and HIV+NGT during clamp stages 1–2. Mean basal plasma insulin concentration in HIV+IGT was higher than Ctrl and HIV+NGT, and higher than HIV+NGT during clamp stage 1. Insulin levels during clamp stage 2 were not different among the groups. The primary difference in the HIV+IGT group was higher absolute leucine levels, despite elevated basal insulin levels, that persisted across all insulin levels. The insulin-induced reduction in leucine concentration per unit increase in insulin concentration (Fig 1: slope from basal to stage 1, and from stage 1 to stage 2) was not different among the groups. This indicates basal leucine levels were resistant to the leucine-lowering actions of basal insulin.
Glucose and leucine kinetics
Glucose kinetics, plasma leucine Ra, and whole body proteolysis rate (calculated using 13C-KIC; the immediate intracellular deamination product of leucine) were measured at basal, low, and high plasma insulin levels while plasma glucose levels were constant (5.5mM). Basal glucose Rd (μmol/kg FFM/min) was similar among the groups, but was lower in HIV+IGT than HIV+NGT and Ctrl during clamp stages 1 and 2 (Table 3). When normalized to the circulating insulin concentration (M), glucose Rd (μmol/kg FFM/min/μU insulin/mL) was lower in HIV+IGT than HIV+NGT and Ctrl during basal, stage 1 and 2. During clamp stage 1, endogenous glucose Ra was higher in HIV+IGT than the other groups.
Table 3.
Glucose kinetics and lipid oxidation rates during the clamp.
| Parameter | CTRL | HIV+NGT | HIV+IGT | P-value |
|---|---|---|---|---|
| Glucose Rd (μmol/kg FFM/min) | ||||
| Basal | 12.2 ±0.7 | 12.2 ± 0.5 | 12.6 ± 0.4 | 0.79 |
| Stage 1 | 28.1 ± 3.8 | 29.4 ± 2.4 | 19.1 ± 1.5 | <0.04 HIV+IGT < HIV+NGT & CTRL |
| Stage 2 | 68.5 ± 6.1 | 60.7 ± 4.4 | 39.9 ± 2.9 | <0.001 HIV+IGT < HIV+NGT & CTRL |
| Endogenous Glucose Ra (μmol/kg FFM/min) | ||||
| Basal | 12.2 ± 0.7 | 12.2 ± 0.5 | 12.6 ± 0.4 | 0.80 |
| Stage 1 | 2.6 ± 0.3 | 2.7 ± 0.3 | 5.1 ± 0.5 | <0.004 HIV+IGT> HIV+NGT & CTRL |
| Stage 2 | 2.1 ± 0.6 | 0.2 ± 0.6 | 0.5 ± 0.6 | 0.14 |
| Whole-Body Lipid Oxidation (mg lipid/kg FFM/min) | ||||
| Basal | 1.2 ± 0.1 | 1.1 ± 0.1 | 1.3 ± 0.1 | 0.28 |
| Stage 1 | 0.77 ± 0.11 | 0.72 ± 0.08 | 1.00 ± 0.08 | <0.05 HIV+IGT> HIV+NGT |
| Stage 2 | 0.35 ± 0.11 | 0.39 ± 0.06 | 0.66 ± 0.08 | <0.05 HIV+IGT> HIV+NGT & CTRL |
Mean±SEM; CTRL= seronegative control, HIV+ NGT= HIV-infected with normal glucose tolerance, HIV+ IGT= HIV-infected with impaired glucose tolerance. P-values calculated using ANOVA and Tukey HSD post-hoc testing.
The absolute values for leucine Ra and whole body proteolysis rate were greater (P≤0.005) in HIV+IGT than in HIV+NGT and Ctrl during all stages of the clamp (Fig 1). Leucine Ra and whole-body proteolysis rates were not different between Ctrl and HIV+NGT during basal or clamp conditions. Despite higher basal insulin concentrations in HIV+IGT, the absolute leucine Ra and whole body proteolysis rate were ~15% higher than in HIV+NGT and Ctrl. Similarly, despite higher insulin concentrations during clamp stage 1, the absolute leucine Ra and whole body proteolysis rate in HIV+IGT remained ~15% higher than that in HIV+NGT. During the clamp, the insulin-induced suppression of leucine Ra and whole body proteolysis rate was not different among the three groups. This implies that basal leucine and protein turnover rates were dysregulated in HIV+IGT, and this elevated rate of leucine release persisted throughout the clamp. But, the absolute magnitude of the suppression in leucine Ra and whole body proteolysis rate per unit increase in insulin during the clamp was similar among the groups. Plasma 13C-KIC/13C-leucine ratio tended to decrease with increasing insulin levels (P=ns), but the ratios were not different among the groups at any insulin level (data not shown). Whole body proteolysis rates were directly correlated with glucose Ra at all insulin concentrations (P<0.01, r= 0.36–0.47), fasting FFA levels (P=0.03, r=0.32), and inversely correlated with glucose Rd during clamp stage 1 (P=0.04; r=−0.31).
Whole body substrate oxidation rates (Table 3)
Lipid oxidation rate was similar in all groups during basal conditions, but was greater in HIV+IGT than the other groups during clamp stage 2, and greater than in HIV+NGT during clamp stage 1. Whole body carbohydrate oxidation rate tended to be lower in HIV+IGT than the other two groups during clamp stage 2, but this did not achieve statistical significance (P=0.08) (data not shown).
Discussion
In HIV-infected people with IGT, we found greater absolute plasma leucine concentrations, greater rates of leucine appearance in the plasma, and greater rates of whole body proteolysis under fasting insulin and hyperinsulinemic conditions than in HIV+NGT and healthy control subjects. These markers of fasting BCAA metabolism were elevated in HIV+IGT despite fasting insulin levels that were 2.0–2.5x greater than in HIV+NGT and Ctrl. This indicates that HIV+IGT were resistant to the anti-proteolytic actions of basal (postabsorptive) insulin levels. However, it appears that HIV+IGT were sensitive to the leucine-lowering, anti-proteolytic actions of hyperinsulinemia achieved during the clamp. During hyperinsulinemia, absolute levels of leucine, leucine Ra, and whole body proteolysis rate remained significantly higher in HIV+IGT, but the magnitude of the insulin-induced suppression for each of these parameters was identical among the groups. This is contrasted with glucose regulation in HIV+IGT, where absolute basal glucose Ra and Rd (μmol/kg FFM/hr) were similar among the groups, but insulin action on glucose Ra and Rd was blunted in HIV+IGT during insulin infusion. Taken together, these findings indicate that dysregulated fasting leucine and protein metabolism, along with impairments in glucose and fatty acid metabolism (9; 11; 13–16; 18), may be integrated and represent metabolic syndromes associated with HIV-infection and HAART.
Fasting leucine Ra and whole body proteolysis rate were not adequately suppressed by fasting insulin levels in HIV+IGT. This is contrary to what is typically observed in T2DM, where fasting insulin levels adequately maintain (suppress) leucine Ra and whole body proteolysis rate in the normal range, while glucose Ra is increased. Since the slope of the insulin ‘dose-response curve’ was similar among the groups (Fig 1), a factor other than insulin resistance may have been responsible for the elevated basal leucine levels and kinetics. Despite similar absolute suppression of leucine Ra during insulin infusion, leucine Ra and whole body proteolysis were not suppressed to normal levels in HIV+IGT; suggesting that maximal responsiveness of leucine metabolism to insulin may have been impaired. We did not achieve a clear plateau in suppression of leucine Ra at the highest insulin level, so we cannot definitely claim that maximal responsiveness was blunted.
Advanced HIV disease is characterized by elevated plasma glutamine Ra and elevated whole body proteolysis (20; 25; 28–30). All subjects were weight stable for at least 6 months and had well-controlled, asymptomatic HIV infection, making it less likely that HIV-wasting or progressive viral replication was responsible for the elevated proteolysis rate. It is unlikely that increased sympathetic nervous system activity played a role because plasma epinephrine and norepinephrine concentrations were not different among groups. HIV+IGT subjects had several features of hypercortisolism including higher visceral adipose area, hepatic steatosis, and glucose intolerance, however plasma cortisol levels were not different among groups. Viral protein R (Vpr) acts as a coactivator of the human glucocorticoid receptor and it is possible that this might link the features of hypercortisolism with HIV+IGT (31). However, this would not explain the differences in leucine metabolism between the two HIV infected groups. It is possible, but unlikely that HAART contributed to the elevated proteolytic rate in HIV+IGT. Use of HAART is associated with maintenance of skeletal muscle mass, and we have previously found that HAART improves, but does not completely normalize, muscle protein synthetic or proteolytic rates in HIV-infected people (20). Individual components of HAART cannot be excluded as contributing factors to dysregulated leucine/protein metabolism (32), however this cross-sectional study was not designed, nor powered, to identify specific components of HAART that might disrupt amino acid metabolism.
A key finding is that proteolytic rates were elevated during fasting conditions, and were related to impaired insulin action on glucose metabolism. Blunted insulin-mediated suppression of glucose Ra is likely due to increased proteolysis and amino acid availability, rather than HIV infection or its treatment. This notion is supported by a recent report that elevated whole body proteolytic rates are related to elevated rates of gluconeogenesis in obese, HIV-negative subjects (33). The relationship between whole body proteolysis and glucose production may be explained by increased hepatic and renal conversion of alanine and glutamine to glucose (34) in HIV+IGT. This may increase reliance on gluconeogenic pathways, rather than glycogenolysis, for glucose production in HIV+IGT.
In agreement with others, we found that fasting FFAs and liver lipid content were elevated and positively correlated in HIV+IGT (11; 13; 35). The correlations between FFA levels, glucose and leucine kinetics in HIV+IGT raise the possibility that elevated FFA flux, and their byproducts, can accumulate in insulin sensitive tissues and disrupt normal insulin signaling pathways. The pathways that regulate insulin-mediated glucose disposal in skeletal muscle are disrupted in HIV+IGT (17; 18; 36). Impairments along the insulin-signaling pathway were not evaluated in the current study, so we cannot identify a primary cellular defect. Our findings suggest that there may be a defect in the insulin-signaling pathway that is common to the regulation of both glucose and BCAA metabolism. Possibilities might include: insulin-induced intramyocellular kinase activation cascades that regulate protein synthesis (eg., Akt, glycogen synthase kinase 3β, mTOR, p70s6kinase, elongation-initiation factors-2B and -4E, and 4E-binding protein-1) and protein breakdown (Forkhead (FOXO) transcription factors (31), NFκB, ubiquitin-proteasome pathway, atrogin, myostatin). A role for these factors in the pathogenesis of HIV+IGT needs to be examined further.
We observed higher serum IL-8 levels in HIV+IGT, and this is consistent with findings in T2DM (37), obesity (38) and non-alcoholic steatohepatitis (39). It is possible that the chronic inflammatory state associated with HIV-infection, and reflected as elevated fasting serum IL-8 levels, may have contributed to dysregulated glucose, leucine and protein metabolism in HIV+IGT. IL-8 enhances vascular smooth muscle cell proliferation, monocyte adhesion to endothelial cells, and is believed to have proatherogenic properties (40). IL-8 is produced and released from human subcutaneous and visceral adipose tissue (41), and subcutaneous adipose tissue obtained from HIV-infected people with fat redistribution and insulin resistance. Higher serum IL-8 may: reflect increased production and release from the larger visceral adipose depot in HIV+IGT; represent a biomarker for inflammation in visceral adipose tissue; or, be an indicator/signal for increased cardiovascular disease risk in HIV+IGT.
In summary, we found that patients with HIV infection and impaired glucose tolerance have markedly higher rates of fasting proteolysis. Insulin-signaling pathways that are common to the regulation of glucose and BCAA metabolism are potential sites for the pathogenesis of HIV-related metabolic syndromes. Lean tissue proteolysis may further worsen HIV-hyperglycemia by providing amino acids for gluconeogenesis, or in the case of leucine, directly impair insulin-mediated glucose disposal in muscle. These pathways and the role of specific antiretroviral agents in the pathogenesis of this phenomenon are unclear, but deserve further study.
Acknowledgments
We thank the participants for their altruism and patience. Sherry Lassa-Claxton MS, RD, Mary Hoffman RN, Erin Laciny, and Amanda DeMoss were research coordinators. Jennifer Chen, Sam Smith, Amanda Becker, Freida Custodio and Junyoung Kwon provided analytical expertise. This work was supported by NIH grants RR00036 (GCRC), RR00954 (Biomedical Mass Spectrometry Resource), DK020579 (Diabetes Research and Training Center), DK56341 (Clinical Nutrition Research Unit), AI25903 (ACTU), DK49393 (to K.E.Y.), DK54163 (to K.E.Y.), DK59531 (to K.E.Y.), DK59532 (to W.G.P.), DK59534 (to S.K.), DK066977 (to W.T.C), RR19508 (to D.N.R.), AG00078 (to D.N.R.), and DK63683 (to D.N.R.).
References
- 1.DeFronzo RA. Lilly Lecture 1987: The triumvirate: beta-cell, muscle, liver: a collusion responsible for NIDDM. Diabetes. 1988;37:667–687. doi: 10.2337/diab.37.6.667. [DOI] [PubMed] [Google Scholar]
- 2.Lattuada G, Sereni LP, Ruggieri D, Scollo A, Benedini S, Ragogna F, Costantino F, Battezzati A, Luzi L, Perseghin G. Postabsorptive and insulin-stimulated energy homeostasis and leucine turnover in offspring of type 2 diabetic patients. Diabetes Care. 2004;27:2716–2722. doi: 10.2337/diacare.27.11.2716. [DOI] [PubMed] [Google Scholar]
- 3.Luzi L, Petrides A, De Fronzo R. Different sensitivity of glucose and amino acid metabolism to insulin in NIDDM. Diabetes. 1993;42:1868–1877. doi: 10.2337/diab.42.12.1868. [DOI] [PubMed] [Google Scholar]
- 4.Halvatsiotis P, Short KR, Bigelow M, Nair KS. Synthesis rate of muscle proteins, muscle functions, and amino acid kinetics in type 2 diabetes. Diabetes. 2002;51:2395–2404. doi: 10.2337/diabetes.51.8.2395. [DOI] [PubMed] [Google Scholar]
- 5.Staten M, Matthews D, Bier D. Leucine metabolism in type II diabetes mellitus. Diabetes. 1986;35:1249–1253. doi: 10.2337/diab.35.11.1249. [DOI] [PubMed] [Google Scholar]
- 6.Halvatsiotis PG, Turk D, Alzaid A, Dinneen S, Rizza RA, Nair KS. Insulin effect on leucine kinetics in type 2 diabetes mellitus. Diabetes Nutr Metab. 2002;15:136–142. [PubMed] [Google Scholar]
- 7.Umpleby AM, Scobie IN, Boroujerdi MA, Carson ER, Sonksen PH. Diurnal variation in glucose and leucine metabolism in non-insulin-dependent diabetes. Diabetes Res Clin Pract. 1990;9:89–96. doi: 10.1016/0168-8227(90)90014-k. [DOI] [PubMed] [Google Scholar]
- 8.Turk D, Alzaid A, Dinneen S, Nair KS, Rizza R. The effects of non-insulin-dependent diabetes mellitus on the kinetics of onset of insulin action in hepatic and extrahepatic tissues. J Clin Invest. 1995;95:755–762. doi: 10.1172/JCI117723. [DOI] [PMC free article] [PubMed] [Google Scholar]
- 9.Yarasheski KE, Marin D, Claxton S, Powderly WG. Endocrine, metabolic, and body composition disorders. In: Powderly WG, editor. Manual of HIV Therapeutics. Philadelphia, PA.: Lippincott, Williams & Wilkins; 2001. [Google Scholar]
- 10.Hruz PW, Murata H, Mueckler M. Adverse metabolic consequences of HIV protease inhibitor therapy: the search for a central mechanism. Am J Physiol Endocrinol Metab. 2001;280:E549–553. doi: 10.1152/ajpendo.2001.280.4.E549. [DOI] [PubMed] [Google Scholar]
- 11.Reeds DN, Yarasheski KE, Fontana L, Cade WT, Laciny E, Demoss A, Patterson BW, Powderly WG, Klein S. Alterations in liver, muscle, and adipose tissue insulin sensitivity in men with HIV infection and dyslipidemia. Am J Physiol Endocrinol Metab. 2006;290:E47–E53. doi: 10.1152/ajpendo.00236.2005. [DOI] [PubMed] [Google Scholar]
- 12.Authier FJ, Chariot P, Gherardi RK. Skeletal muscle involvement in human immunodeficiency virus (HIV)-infected patients in the era of highly active antiretroviral therapy (HAART) Muscle & Nerve. 2005;32:247–260. doi: 10.1002/mus.20338. [DOI] [PubMed] [Google Scholar]
- 13.van der Valk M, Bisschop PH, Romijn JA, Ackermans MT, Lange JM, Endert E, Reiss P, Sauerwein HP. Lipodystrophy in HIV-1-positive patients is associated with insulin resistance in multiple metabolic pathways. AIDS. 2001;15:2093–2100. doi: 10.1097/00002030-200111090-00004. [DOI] [PubMed] [Google Scholar]
- 14.Woerle HJ, Mariuz PR, Meyer C, Reichman RC, Popa EM, Dostou JM, Welle SL, Gerich JE. Mechanisms for the deterioration in glucose tolerance associated with HIV protease inhibitor regimens. Diabetes. 2003;52:918–925. doi: 10.2337/diabetes.52.4.918. [DOI] [PubMed] [Google Scholar]
- 15.Sekhar RV, Jahoor F, Pownall HJ, Rehman K, Gaubatz J, Iyer D, Balasubramanyam A. Severely dysregulated disposal of postprandial triacylglycerols exacerbates hypertriacylglycerolemia in HIV lipodystrophy syndrome. Am J Clin Nutr. 2005;81:1405–1410. doi: 10.1093/ajcn/81.6.1405. [DOI] [PubMed] [Google Scholar]
- 16.Meininger G, Hadigan C, Laposata M, Brown J, Rabe J, Louca J, Aliabadi N, Grinspoon S. Elevated concentrations of free fatty acids are associated with increased insulin response to standard glucose challenge in human immunodeficiency virus-infected subjects with fat redistribution. Metabolism. 2002;51:260–266. doi: 10.1053/meta.2002.29999. [DOI] [PubMed] [Google Scholar]
- 17.Haugaard SB, Andersen O, Madsbad S, Frosig C, Iversen J, Nielsen JO, Wojtaszewski JFP. Skeletal muscle insulin signaling defects downstream of phosphatidylinositol 3-kinase at the level of Akt are associated with impaired nonoxidative glucose disposal in HIV lipodystrophy. Diabetes. 2005;54:3474–3483. doi: 10.2337/diabetes.54.12.3474. [DOI] [PubMed] [Google Scholar]
- 18.Hadigan C, Kamin D, Liebau J, Mazza S, Barrow S, Torriani M, Rubin R, Weise S, Fischman A, Grinspoon S. Depot-specific regulation of glucose uptake and insulin sensitivity in HIV-lipodystrophy. Am J Physiol Endocrinol Metab. 2006;290:E289–298. doi: 10.1152/ajpendo.00273.2005. [DOI] [PMC free article] [PubMed] [Google Scholar]
- 19.Mynarcik DC, Combs T, McNurlan MA, Scherer PE, Komaroff E, Gelato MC. Adiponectin and leptin levels in HIV-infected subjects with insulin resistance and body fat redistribution. J Acquir Immune Defic Syndr. 2002;31:514–520. doi: 10.1097/00126334-200212150-00009. [DOI] [PubMed] [Google Scholar]
- 20.Yarasheski KE, Smith SR, Powderly WG. Reducing plasma HIV RNA improves muscle amino acid metabolism. Am J Physiol Endocrinol Metab. 2005;288:E278–284. doi: 10.1152/ajpendo.00359.2004. [DOI] [PMC free article] [PubMed] [Google Scholar]
- 21.Yarasheski KE, Tebas P, Claxton S, Marin D, Coleman T, Powderly WG, Semenkovich CF. Visceral adiposity, C-peptide levels, and low lipase activities predict HIV-dyslipidemia. Am J Physiol Endocrinol Metab. 2003;285:E899–905. doi: 10.1152/ajpendo.00036.2003. [DOI] [PubMed] [Google Scholar]
- 22.Schonfeld G, Patterson BW, Yablonskiy DA, Tanoli TSK, Averna M, Elias N, Yue P, Ackerman J. Fatty liver in familial hypobetalipoproteinemia: triglyceride assembly into VLDL particles is affected by the extent of hepatic steatosis. J Lipid Res. 2003;44:470–478. doi: 10.1194/jlr.M200342-JLR200. [DOI] [PubMed] [Google Scholar]
- 23.Hales CN, Randle PH. Immunoassay of insulin with insulin antibody precipitate. Biochem J. 1963;88:137–146. doi: 10.1042/bj0880137. [DOI] [PMC free article] [PubMed] [Google Scholar]
- 24.Mittendorfer B, Horowitz JF, Klein S. Gender differences in lipid and glucose kinetics during short-term fasting. Am J Physiol Endocrinol Metab. 2001;281:E1333–1339. doi: 10.1152/ajpendo.2001.281.6.E1333. [DOI] [PubMed] [Google Scholar]
- 25.Yarasheski KE, Zachwieja JJ, Gischler J, Crowley J, Horgan MM, Powderly WG. Increased plasma Gln and Leu Ra and inappropriately low muscle protein synthesis rate in AIDS wasting. Am J Physiol Endocrinol Metab. 1998;275:E577–E583. doi: 10.1152/ajpendo.1998.275.4.E577. [DOI] [PMC free article] [PubMed] [Google Scholar]
- 26.Matthews DE, Motil KJ, Rohrbaugh DK, Burke JF, Young VR, Bier DM. Measurement of leucine metabolism in man from a primed, continuous infusion of L-[13C]leucine. Am J Physiol Endocrinol Metab. 1980;238:E473–E478. doi: 10.1152/ajpendo.1980.238.5.E473. [DOI] [PubMed] [Google Scholar]
- 27.Matthews DR, Hosker JP, Rudenski AS, Naylor BA, Treacher DF, Turner RC. Homeostasis model assessment: insulin resistance and beta-cell function from fasting plasma glucose and insulin concentrations in man. Diabetologia. 1985;28:412–419. doi: 10.1007/BF00280883. [DOI] [PubMed] [Google Scholar]
- 28.Caso G, Garlick PJ, Gelato MC, McNurlan MA. Lymphocyte protein synthesis is increased with the progression of HIV-associated disease to AIDS. Clin Sci (Lond) 2001;101:583–589. [PubMed] [Google Scholar]
- 29.Macallan DC, McNurlan MA, Milne E, Calder AG, Garlick PJ, Griffin GE. Whole-body protein turnover from leucine kinetics and the response to nutrition in human immunodeficiency virus infection. Am J Clin Nutr. 1995;61:818–826. doi: 10.1093/ajcn/61.4.818. [DOI] [PubMed] [Google Scholar]
- 30.Jahoor F, Gazzard B, Phillips G, Sharpstone D, Delrosario M, Frazer ME, Heird W, Smith R, Jackson A. The acute-phase protein response to human immunodeficiency virus infection in human subjects. Am J Physiol Endocrinol Metab. 1999;276:E1092–1098. doi: 10.1152/ajpendo.1999.276.6.E1092. [DOI] [PubMed] [Google Scholar]
- 31.Kino T, De Martino MU, Charmandari E, Ichijo T, Outas T, Chrousos GP. HIV-1 accessory protein Vpr inhibits the effect of insulin on the Foxo subfamily of forkhead transcription factors by interfering with their binding to 14-3-3 proteins: potential clinical implications regarding the insulin resistance of HIV-1-infected patients. Diabetes. 2005;54:23–31. doi: 10.2337/diabetes.54.1.23. [DOI] [PubMed] [Google Scholar]
- 32.Hong-Brown LQ, Pruznak AM, Frost RA, Vary TC, Lang CH. Indinavir alters regulators of protein anabolism and catabolism in skeletal muscle. Am J Physiol Endocrinol Metab. 2005;289:E382–390. doi: 10.1152/ajpendo.00591.2004. [DOI] [PubMed] [Google Scholar]
- 33.Chevalier S, Burgess SC, Malloy CR, Gougeon R, Marliss EB, Morais JA. The greater contribution of gluconeogenesis to glucose production in obesity is related to increased whole-body protein catabolism. Diabetes. 2006;55:675–681. doi: 10.2337/diabetes.55.03.06.db05-1117. [DOI] [PubMed] [Google Scholar]
- 34.Meyer C, Dostou J, Gerich J. Role of the human kidney in glucose counterregulation. Diabetes. 1999;48:943–948. doi: 10.2337/diabetes.48.5.943. [DOI] [PubMed] [Google Scholar]
- 35.Sutinen J, Hakkinen AM, Westerbacka J, Seppala-Lindroos A, Vehkavaara S, Halavaara J, Jarvinen A, Ristola M, Yki-Jarvinen H. Increased fat accumulation in the liver in HIV-infected patients with antiretroviral therapy-associated lipodystrophy. AIDS. 2002;16:2183–2193. doi: 10.1097/00002030-200211080-00011. [DOI] [PubMed] [Google Scholar]
- 36.Behrens GMN, Boerner A-R, Weber K, van den Hoff J, Ockenga J, Brabant G, Schmidt RE. Impaired glucose phosphorylation and transport in skeletal muscle cause insulin resistance in HIV-1-infected patients with lipodystrophy. J Clin Invest. 2002;110:1319–1327. doi: 10.1172/JCI15626. [DOI] [PMC free article] [PubMed] [Google Scholar]
- 37.Esposito K, Nappo F, Giugliano F, Di Palo C, Ciotola M, Barbieri M, Paolisso G, Giugliano D. Cytokine milieu tends toward inflammation in Type 2 diabetes. Diabetes Care. 2003;26:1647. doi: 10.2337/diacare.26.5.1647. [DOI] [PubMed] [Google Scholar]
- 38.Straczkowski M, Dzienis-Straczkowska S, Stepien A, Kowalska I, Szelachowska M, Kinalska I. Plasma interleukin-8 concentrations are increased in obese subjects and related to fat mass and tumor necrosis factor–α system. J Clin Endocrinol Metab. 2002;87:4602–4606. doi: 10.1210/jc.2002-020135. [DOI] [PubMed] [Google Scholar]
- 39.Bahcecioglu IH, Yalniz M, Ataseven H, Ilhan N, Ozercan IH, Seckin D, Sahin K. Levels of serum hyaluronic acid, TNF-alpha and IL-8 in patients with nonalcoholic steatohepatitis. Hepatogastroenterology. 2005;52:1549–1553. [PubMed] [Google Scholar]
- 40.Baggiolini M. Chemokines in pathology and medicine. J Intern Med. 2001;250:91–104. doi: 10.1046/j.1365-2796.2001.00867.x. [DOI] [PubMed] [Google Scholar]
- 41.Bruun JM, Pedersen SB, Richelsen B. Regulation of interleukin 8 production and gene expression in human adipose tissue in vitro. J Clin Endocrinol Metab. 2001;86:1267–1273. doi: 10.1210/jcem.86.3.7264. [DOI] [PubMed] [Google Scholar]