Abstract
Factorial design and response surface techniques were used to design and optimize increasing P450 BM-3 expression in E. coli. Operational conditions for maximum production were determined with twelve parameters under consideration: the concentration of FeCl3, induction at OD578 (optical density measured at 578 nm), induction time and inoculum concentration. Initially, Plackett-Burman (PB) design was used to evaluate the process variables relevant in relation to P450 BM-3 production. Four statistically significant parameters for response were selected and utilized in order to optimize the process. With the 416C model of hybrid design, response surfaces were generated, and P450 BM-3 production was improved to 57.90×10⁻³ U/ml by the best combinations of the physicochemical parameters at optimum levels of 0.12 mg/L FeCl3, inoculum concentration of 2.10%, induction at OD578 equal to 1.07, and with 6.05 h of induction.
Keywords: Optimization, P450 BM-3, Plackett-Burman (PB) design, Hybrid design
INTRODUCTION
P450 enzymes are found throughout nature and can catalyze the oxidation of various chemicals (Ortiz de Montellano, 1995). Because of their important roles in these processes, numerous systems have been developed for the expression of P450s in vitro (Helvig and Capdevila, 2000; Nakamura et al., 2001; Deeni, 2001). But P450 enzymes fermentation levels in the microbial system are too low to catalyze the reactions for industrial preparations. Therefore, it is necessary to improve fermentation conditions to obtain maximum P450 levels.
Optimization of enzyme production and activity requires consideration of a large number of potentially influential factors, so it is essential to select the more important ones prior to optimization.
The classical method—studying one variable at a time while holding all others constant—is extremely inefficient in many cases. In recent years, a number of statistical experimental designs, which include regression analysis, factorial design and EVOP (evolutionary operation), have been employed for studying interaction and selecting optimal conditions (Kar et al., 2002). However, even these either involve a large number of experiments or are too restricted in the number of variables which can be studied.
Here, the methodology of Plackett-Burman was used as a tool for the initial screening, and is based on balanced incomplete blocks (Plackett and Burman, 1946). Instead of using more extensive factorial design, the statistical procedure would furnish more complete information. Each design of N experiments can be used to study up to N−1 variables.
After initial screening, response surface analysis can be limited to the most critical variables for determining their optimum operation conditions. Recently, many statistical experimental designs with response surface methodology have been employed for optimizing enzyme production from microorganism (de Coninck et al., 2000; Murthy et al., 2000; Kalil et al., 2000; Uyar and Baysal, 2004; Dahiya et al., 2005). Hybrid design is a superior and more accurate modelling technique when compared to the response surface methodology (Roquemore, 1976). Response surfaces plotted by 3D plots can provide a good way for visualizing the parameter interaction. Therefore, both techniques can be used together to predict optimum process conditions for microbial enzyme production.
The aim of this work was to increase the production of P450 BM-3 by optimizing the fermentation conditions. Therefore, Plackett-Burman design based on screening design and factorial design was used to determine the relevant factors, and then the factors having more significant effect were further optimized by hybrid design methodology and response surface analysis.
MATERIALS AND METHODS
Microorganism
The basis system involving the construction of plasmid and the expression of P450 BM-3 is described elsewhere (Li et al., 2000; 2005). pET28a(+) expresses P450 BM-3 with three sites mutagenesis (D168N, A225V, K440N) in E. coli BL21.
Chemicals
All chemicals used were of analytical grade. The yeast extract, tryptone, kanamycin, NADH (reduced nicotinamide adenine dinucleotide) and IPTG (isopropyl-β-D-thiogalactoside) were purchased from Shanghai Sangon Biological Engineering & Technology and Service Co. Ltd. (Shanghai, China).
Medium and culture conditions
The strain was grown aerobically on LB medium containing 30 μg/ml kanamycin overnight at 37 °C in tube. Aliquots of the cell culture from the tube were transferred to 50 ml LB medium supplemented with 30 μg/ml kanamycin and 0.1 mg/L FeCl3 in a 250 ml flask. The shaking flask was incubated at 180 r/min and 37 °C. After reaching an optical density at 578 nm (OD578) of 0.8, P450 BM-3 expression was induced by adding 0.5 mmol/L IPTG for 5 h. E. coli cells containing P450 BM-3 were harvested.
The most important influential parameters were selected by Plackett-Burman (PB) design and optimized by hybrid design to maximize the P450 BM-3 production.
Enzyme preparation
For enzyme preparation, the cells were centrifuged at 8000 r/min for 15 min, washed once with 0.1 mol/L potassium phosphate buffer (pH 7.4), then resuspended in the same buffer (5 ml per 50 ml medium), and broken up under ice-cooling with Sonifier (output level 200 W, three 2 min duty cycles of 20% each). The suspension was centrifuged for 20 min at 8000 r/min. The crude extracts were used directly for the activity assay.
Activity assay of P450 BM-3
The activity assay was carried out as modified according to Schwaneberg et al.(1999). For all assay procedures, after addition of 25 μl of 10-p-NCA (p-nitrophenoxydecanoic acid) solution in DMSO (dimethyl sulfoxide) (25 mmol/L), 1725 μl Tris/HCl buffer (pH 8.2, 0.1 mol/L), and 500 µl of P450 BM-3 extract solution, the samples were preincubated for 5 min. Then the reaction was started by adding 250 μl aqueous NADH solution (6 mmol/L). The formation of p-nitrophenolate was determined from the absorption at 410 nm [with an extinction coefficient=13.2 L/(mmol∙cm)]. The enzyme activity was defined as the initial rate of p-nitrophenolate formation, with the unit of activity being the amount of enzyme that produces 1 μmol of p-nitrophenolate per minute under the assay conditions.
Experimental design
1. Plackett-Burman (PB) design
PB designs are very useful for screening process variables from a large number of factors, and require fewer runs than other factorial designs (Stowe and Mayer, 1966).
The influence of twelve variables on P450 BM-3 activity was investigated using the methodology of PB design. Each of the independent variables was tested at two levels, a high level (+) and a low level (−), as shown in Table 1.
Table 1.
Range of variables for PB design
| Level |
||
| −1 | +1 | |
| Yeast extract (g/L) | 5.0 | 7.5 |
| Tryptone (g/L) | 10 | 15 |
| NaCl (g/L) | 10 | 15 |
| Original pH | 7.0 | 7.5 |
| Kanamycin (μg/ml) | 30 | 45 |
| FeCl3 (mg/L) | 0.10 | 0.15 |
| Induction at OD578 | 0.8 | 1.2 |
| IPTG (mmol/L) | 0.50 | 0.75 |
| Induction time (h) | 5 | 7 |
| Induction temperature (°C) | 30 | 35 |
| Inoculum concentration (%) | 1 | 2 |
| Medium volume in 250 ml flask | 50 | 75 |
2. Hybrid design
After the four relevant variables were selected by screening, hybrid design was used to obtain a quadratic model with the P450 BM-3 activity as response. The empirical polynomial model for four factors was in the following form:
 , ,
|
(1) |
where y was the predicted response as the dependent variable; Xi (i=1, 2, 3 and 4) were the controlling variables or input predictors; and β 0, βi (i=1, 2, 3 and 4), βij (i=1, 2, 3 and 4; j=i, …, 4) and βii were the regression coefficients. They were estimated by multiple non-linear regression analysis. Surfaces were then built using the quadratic model for the statistically significant variables.
Table 2 presents the values in actual and coded form of the variables used to optimize the P450 BM-3 activity. The first three variables were studied at five different levels, and the last variable at four different levels. All the variables were taken with the central coded value considered as zero.
Table 2.
The values of variables for the P450 BM-3 activity determination for hybrid design
| Coded values (Xi) | Variables (xi) |
|||
| FeCl3 (mg/L) | Induction at OD578 | Induction time (h) | Inoculum concentration (%) | |
| −1.4697 | 0.088 | 0.71 | 4.530 | − |
| −1.0509 | − | − | − | 0.975 |
| −1.0000 | 0.100 | 0.80 | 5.000 | 1.000 |
| 0.0000 | 0.125 | 1.00 | 6.000 | 1.500 |
| 0.5675 | − | − | − | 1.784 |
| 1.0000 | 0.150 | 1.20 | 7.000 | 2.000 |
| 1.4697 | 0.162 | 1.29 | 7.470 | − |
| 1.7654 | − | − | − | 2.383 |
RESULTS AND DISCUSSION
Screening design
Table 3 presents the PB design matrix and the results obtained for P450 BM-3 activity from experiments.
Table 3.
PB design matrix for determining the effects with P450 BM-3 activity as responses
| Run | A | B | C | D | E | F | G | H | I | J | K | L | M | N | O | P450 BM-3 activity (×10−3 U/ml) |
| 1 | + | + | + | + | − | + | − | + | + | − | − | + | − | − | − | 37.88 |
| 2 | + | + | + | − | + | − | + | + | − | − | + | − | − | − | + | 35.35 |
| 3 | + | + | − | + | − | + | + | − | − | + | − | − | − | + | + | 27.78 |
| 4 | + | − | + | − | + | + | − | − | + | − | − | − | + | + | + | 29.85 |
| 5 | − | + | − | + | + | − | − | + | − | − | − | + | + | + | + | 41.34 |
| 6 | + | − | + | + | − | − | + | − | − | − | + | + | + | + | − | 45.76 |
| 7 | − | + | + | − | − | + | − | − | − | + | + | + | + | − | + | 37.60 |
| 8 | + | + | − | − | + | − | − | − | + | + | + | + | − | + | − | 40.53 |
| 9 | + | − | − | + | − | − | − | + | + | + | + | − | + | − | + | 32.30 |
| 10 | − | − | + | − | − | − | + | + | + | + | − | + | − | + | + | 29.55 |
| 11 | − | + | − | − | − | + | + | + | + | − | + | − | + | + | − | 27.61 |
| 12 | + | − | − | − | + | + | + | + | − | + | − | + | + | − | − | 39.47 |
| 13 | − | − | − | + | + | + | + | − | + | − | + | + | − | − | + | 25.25 |
| 14 | − | − | + | + | + | + | − | + | − | + | + | − | − | + | − | 49.24 |
| 15 | − | + | + | + | + | − | + | − | + | + | − | − | + | − | − | 25.83 |
| 16 | − | − | − | − | − | − | − | − | − | − | − | − | − | − | − | 23.67 |
A, B, C, E, F, G, I, J, K, M, N, O are yeast extract, tryptone, NaCl, original pH, kanamycin, FeCl3, induction at OD578, IPTG, induction time, induction temperature, inoculum concentration, and medium volume in 250 ml flask, respectively; D, H, L are dummy variables
Dummy variables were used as the measure of variability for PB design. They gave a direct estimate of the standard error of a factor effect.
The effects of the variables on each response are presented in Table 4. P450 BM-3 production was affected by FeCl3 concentration, inoculum concentration, induction at OD578, and induction time.
Table 4.
Effect estimates on P450 BM-3 activity from PB design
| Variable |
Effect |
Relative significance |
||
| Code | Factor | (+) to (−) | t-test | Confidence level (%) |
| A | Yeast extract (g/L) | 3.60 | 0.799 | 78.16 |
| B | Tryptone (g/L) | 0.15 | 0.033 | 51.29 |
| C | NaCl (g/L) | 4.14 | 0.919 | 81.37 |
| D | Dummy | 2.72 | − | − |
| E | Original pH | 3.09 | 0.686 | 74.84 |
| F | Kanamycin (µg/ml) | 0.04 | 0.009 | 50.35 |
| G | FeCl3 (mg/L) | −4.48 | −0.994 | 83.20 |
| H | Dummy | 4.56 | − | − |
| I | Induction at OD578 | −6.43 | −1.427 | 91.30 |
| J | IPTG (mmol/L) | 1.95 | 0.432 | 66.41 |
| K | Induction time (h) | 4.79 | 1.063 | 84.77 |
| L | Dummy | 5.72 | − | − |
| M | Induction temperature (°C) | 1.31 | 0.292 | 61.29 |
| N | Inoculum concentration (%) | 4.29 | 0.952 | 82.19 |
| O | Medium volume in 250 ml flask | −3.87 | −0.860 | 79.83 |
As shown in Table 4, an increase in FeCl3 concentration led to a decrease in P450 BM-3 activity. Increasing inoculum concentration and induction time, however, led to an increase in P450 BM-3 activity. In relation to the compositions of medium, increasing the concentrations of yeast extract, tryptone and NaCl resulted in an increase in P450 BM-3 activity, although this effect did not reach statistical significance.
Table 4 also shows that original pH, the concentrations of kanamycin and IPTG, and induction temperature did not exert statistically significant effects on P450 BM-3 activity.
These results determine which at the variables have more significant effect on the responses. So the variables selected for further optimization were the following: FeCl3 concentration, inoculum concentration, induction at OD578, and induction time.
Hybrid design
Table 5 shows the experimental design and the results for P450 BM-3 activity from experiments and predicted responses. Based on the principle of saving costs, yeast extract, tryptone, NaCl, kanamycin and IPTG were fixed at 5 g/L, 10 g/L, 10 g/L, 30 µg/ml and 0.5 mmol/L, respectively, and medium volume was 50 ml in 250 ml flask. The original pH of medium and induction temperature were fixed at 7.5 and 35 °C according to their effects of PB design.
Table 5.
Matrix for hybrid design with the experimental and predicted values of P450 BM-3 activity
| Run | FeCl3 | Induction at OD578 | Induction time | Inoculum concentration | Observed response (×10−3 U/ml) | Predicted response (×10−3 U/ml) |
| 1 | 0 | 0 | 0 | 1.7654 | 56.44 | 56.44 |
| 2 | −1 | −1 | −1 | 0.5675 | 33.33 | 34.37 |
| 3 | 1 | −1 | −1 | 0.5675 | 44.92 | 43.88 |
| 4 | −1 | 1 | −1 | 0.5675 | 41.93 | 40.89 |
| 5 | 1 | 1 | −1 | 0.5675 | 41.29 | 42.33 |
| 6 | −1 | −1 | 1 | 0.5675 | 39.92 | 38.88 |
| 7 | 1 | −1 | 1 | 0.5675 | 35.53 | 36.57 |
| 8 | −1 | 1 | 1 | 0.5675 | 48.79 | 49.83 |
| 9 | 1 | 1 | 1 | 0.5675 | 40.49 | 39.45 |
| 10 | 1.4697 | 0 | 0 | −1.0509 | 46.29 | 46.29 |
| 11 | −1.4697 | 0 | 0 | −1.0509 | 40.27 | 40.27 |
| 12 | 0 | 1.4697 | 0 | −1.0509 | 36.59 | 36.59 |
| 13 | 0 | −1.4697 | 0 | −1.0509 | 48.14 | 48.14 |
| 14 | 0 | 0 | 1.4697 | −1.0509 | 59.39 | 59.39 |
| 15 | 0 | 0 | −1.4697 | −1.0509 | 50.45 | 50.45 |
| 16 | 0 | 0 | 0 | 0 | 57.20 | 57.20 |
Date were analyzed by non-linear multiple regression using SAS software (SAS Institute Inc., USA). The equation with the optimized coefficients is given by:
 , ,
|
(2) |
where y is the output response (i.e. P450 BM-3 activity), X 1, X 2, X 3 and X 4 are the coded values of FeCl3 concentration, induction at OD578, induction time and inoculum concentration, respectively.
Table 6 shows the analysis of variance (ANOVA) for P450 BM-3 activity. The response has a very high correlation coefficient of 0.995.
Table 6.
ANOVA and regression analysis for P450 BM-3 activity
| Source | Sum of squares | Mean square | Degree of freedom | F-value |
| Model | 921.98 | 65.86 | 14 | 7.61 |
| Residual | 8.65 | 8.65 | 1 | − |
| Total | 930.63 | − | 15 | − |
| Correlation coefficient | 0.995 | − | − | − |
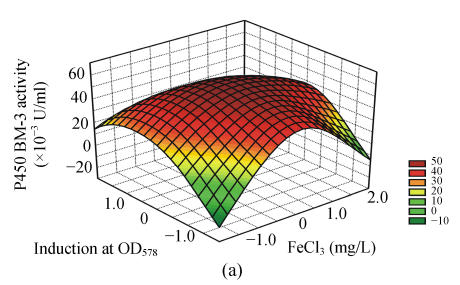
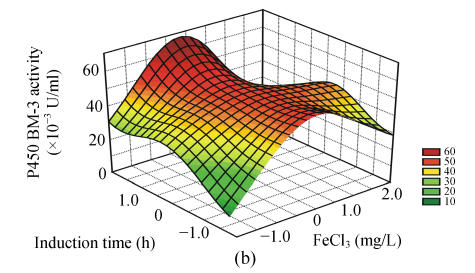
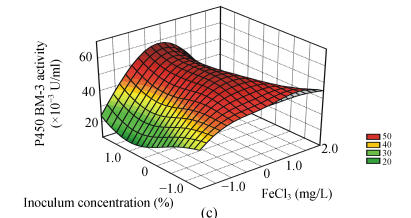
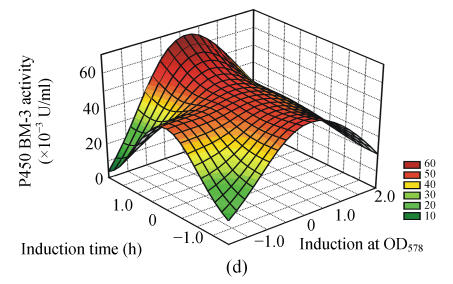
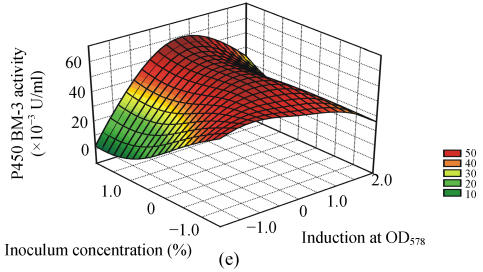
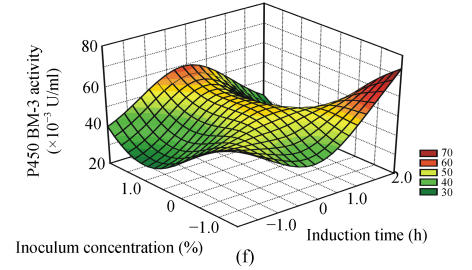
To study the interactions of variables and analyze the P450 BM-3 activity, three-dimensional response surfaces are plotted in Fig.1.
Fig. 1.
Response surface curves of P450 BM-3 activity expressed as a function of (a) FeCl3 concentration and induction at OD578, (b) FeCl3 concentration and induction time, (c) FeCl3 concentration and inoculum concentration, (d) induction at OD578 and induction time, (e) induction at OD578 and inoculum concentration, and (f) induction time and inoculum concentration
The response surfaces were plotted to define the optimal conditions for P450 BM-3 activity. All possible combinations of the four variables were studied. Figs.1a, 1d and 1e revealed that P450 BM-3 activity was maximal when the coded value of induction at OD578 was at the central point, which corresponded to the actual value of 1.0. And Figs.1a, 1b and 1c showed that when the coded value of FeCl3 was at the central point, which was equal to the actual value of 0.125 mg/L, high P450 BM-3 activity was obtained. Figs.1c, 1e and 1f revealed that P450 BM-3 activity increased greatly when inoculum concentration was increased.
The optimal operating conditions obtained from the polynomial model were FeCl3 of 0.12 mg/L, inoculum volume of 2.10 ml in 100 ml medium, when OD578 equal to 1.07, IPTG added to the cultures, and in 6.05 h of induction with 57.41×10⁻³ U/ml of predicted P450 BM-3 activity. Under the conditions, the P450 BM-3 production in the experimental result was 57.90×10⁻³ U/ml. While when the initial conditions were adopted, which corresponded to FeCl3 of 0.10 mg/L, inoculum volume of 1.0 ml in 100 ml medium, when OD578 equals 0.8, IPTG was added to the cultures, and in 5 h of induction, P450 BM-3 activity was at a lower level of 37.62×10⁻³ U/ml. Thus by optimizing the fermentation process parameters using hybrid design, P450 BM-3 production was increased from 37.62×10⁻³ to 57.90×10⁻³ U/ml.
CONCLUSION
The methodology of Plackett-Burman is very useful for selecting relevant variables for further optimization. This makes it efficient to consider a large number of variables and can provide much more useful information than other factorial designs. Four more important factors were picked out using this technique. The main parameters were FeCl3 concentration, inoculum concentration, induction at OD578, and induction time.
High P450 BM-3 activity was obtained by using hybrid design and response surface analysis. Thus hybrid design is a powerful tool well suited for modelling the fermentation process.
Footnotes
Project (No. 30570411) supported by the National Natural Science Foundation of China
References
- 1.Dahiya N, Tewari R, Tiwari RP. Chitinase production in solid-state fermentation by Enterobacter sp. NRG4 using statistical experimental design. Curr Microbiol. 2005;51(4):222–228. doi: 10.1007/s00284-005-4520-y. [DOI] [PubMed] [Google Scholar]
- 2.de Coninck J, Bouquelet S, Dumortier V, Duyme F, Denantes VI. Industrial media and fermentation process for improved growth and protease production by Tetrahymena thermophila BIII. J Ind Microbiol Biotechnol. 2000;24(4):285–290. doi: 10.1038/sj.jim.2900826. [DOI] [Google Scholar]
- 3.Deeni YY. Expression, purification and biochemical characterization of a human cytochrome P450 CYP2D6-NADPH cytochrome P450 reductase fusion protein. Arch Biochem Biophys. 2001;396(1):16–24. doi: 10.1006/abbi.2001.2585. [DOI] [PubMed] [Google Scholar]
- 4.Helvig C, Capdevila JH. Biochemical characterization of rat P450 2C11 fused to rat or bacterial NADPH-P450 reductase domains. Biochemistry. 2000;39(17):5196–5205. doi: 10.1021/bi992578v. [DOI] [PubMed] [Google Scholar]
- 5.Kalil SJ, Maugeri F, Rodrigus MI. Response surface analysis and simulation as a tool for bioprocess design and optimization. Process Biochem. 2000;35(6):539–550. doi: 10.1016/S0032-9592(99)00101-6. [DOI] [Google Scholar]
- 6.Kar B, Banerjee R, Bhattacharyya BC. Optimization of physicochemical parameters for gallic acid production by evolutionary operation-factorial design technique. Process Biochem. 2002;37(12):1395–1401. doi: 10.1016/S0032-9592(02)00020-1. [DOI] [Google Scholar]
- 7.Li QS, Schwaneberg U, Fischer P, Schmid RD. Directed evolution of the fatty-acid hydroxylase P450 BM-3 into an indole-hydroxylating catalyst. Chemistry—A European Journal. 2000;6(9):1531–1536. doi: 10.1002/(SICI)1521-3765(20000502)6:9<1531::AID-CHEM1531>3.3.CO;2-4. [DOI] [PubMed] [Google Scholar]
- 8.Li HM, Mei LH, Urlacher V, Schmid RD. Cytochrome P450 BM-3 mutants with improved catalytic properties hydroxylating indole to indigo by error-prone PCR. Prog Biochem Biophys. 2005;32(7):1–6. (in Chinese) [Google Scholar]
- 9.Murthy MSRC, Swaminathan T, Rakshit SK, Kosugi Y. Statistical optimization of lipase catalyzed hydrolysis of methyloleate by response surface methodology. Bioprocess Eng. 2000;22(1):35–39. doi: 10.1007/PL00009097. [DOI] [Google Scholar]
- 10.Nakamura K, Martin MV, G.uengerich FP. Random mutagenesis of human cytochrome P450 2A6 and screening with indole oxidation products. Arch Biochem Biophys. 2001;395(1):25–31. doi: 10.1006/abbi.2001.2569. [DOI] [PubMed] [Google Scholar]
- 11.Ortiz de Montellano PR. Cytochrome P450: Structure, Mechanism, and Biochemistry. 2nd Ed. New York: Plenum; 1995. [Google Scholar]
- 12.Plackett RL, Burman JP. The design of optimum multifactorial experiments. Biometrika. 1946;33(4):305–325. doi: 10.2307/2332195. [DOI] [Google Scholar]
- 13.Roquemore KG. Hybrid design for quadratic response surfaces. Technometrics. 1976;18(4):419–423. doi: 10.2307/1268657. [DOI] [Google Scholar]
- 14.Schwaneberg U, Schmidt-Dannert C, Schmitt J, Schmid RD. A continuous spectrophotometric assay for P450 BM-3, a fatty acid hydroxylating enzyme, and its mutant F87A. Anal Biochem. 1999;269(2):359–366. doi: 10.1006/abio.1999.4047. [DOI] [PubMed] [Google Scholar]
- 15.Stowe RA, Mayer RP. Efficient screening of process variables. Ind Eng Chem. 1966;58(2):36–40. doi: 10.1021/ie50674a007. [DOI] [Google Scholar]
- 16.Uyar F, Baysal Z. Production and optimization of process parameters for alkaline protease production by a newly isolated Bacillus sp. under solid state fermentation. Process Biochem. 2004;39(12):1893–1898. doi: 10.1016/j.procbio.2003.09.016. [DOI] [Google Scholar]


