Abstract
In the mammalian lifecycle, the two periods of genome-wide epigenetic reprogramming are in the early embryo, when somatic patterns are set, and during germ cell development. Although some differences between the reprogrammed states of somatic and germ cells have been reported, overall patterns of genomic methylation are considered to be similar. Using restriction landmark genomic scanning to examine ≈2,600 loci distributed randomly throughout the genome, we find that the methylation status of testicular DNA is highly distinct, displaying eightfold the number of hypomethylated loci relative to somatic tissues. Identification and analysis of >300 loci show that these regions are generally located within nonrepetitive sequences that are away from CpG islands and 5′ regions of genes. We show that a contributing factor for these differences is that the methylation state of non-CpG-island DNA is correlated with the regional level of GC content within chromosomes and that this relationship is inverted between the testis and somatic tissues. We also show that in Dnmt3L-deficient mice, which exhibit infertility associated with abnormal chromosomal structures in germ cells, this unique testicular DNA methylation pattern is not established. These special properties of testicular DNA point to a broad, distinct epigenetic state that may be involved in maintaining a unique chromosomal structure in male germ cells.
Keywords: germ cells, restriction landmark genomic scanning, epigenetic
Although germ cells faithfully carry parental genetic information to the next generation, they edit the epigenetic information that they inherit. Epigenetic marks in the form of DNA methylation are erased in primordial germ cells in favor of the establishment of a sex-specific, de novo epigenetic program (1). This initial programming is not only important for gametogenesis (2–4) but also provides the basis for genomic imprinting (5), because some sex-specific marks persist after a second wave of demethylation that occurs during early embryogenesis. Furthermore, it has been shown recently that some epigenetic marks can pass from one generation to the next by avoiding both periods of reprogramming in what is termed “epigenetic inheritance” (6, 7). A clear appreciation of the genome-wide nature of the germ cell epigenetic program is paramount to the understanding of these important processes.
DNA methylation in mammals occurs at cytosine residues in CpG dinucleotides. CpG islands are generally thought to be devoid of methylation, whereas the rest of the genome is highly methylated in nondeveloping tissues (1). A recent study in humans confirmed that CpG islands represent the only major unmethylated genomic compartment in somatic (brain) DNA and implied that germ cells were similar, but the latter was not tested directly (8). Although DNA methyltransferases are differentially regulated and essential during germ-cell development (9, 10), few studies to date have directly examined germ cell genome-wide DNA methylation patterns. Because of the larger number of germ cells produced in the male than in the female, their greater accessibility and their continual renewal, most germ-cell studies focus on spermatozoa and testicular tissues. In the adult, the testis is composed of >80% germ cells, mainly in the meiotic and postmeiotic phases of spermatogenesis (11) and, thus, will be referred to in this study as nonsomatic. Although the data are limited, imprinted loci (5), some repetitive sequences (12), and tissue-specific genes (13), point to a unique state of DNA methylation in the testis. Studies using restriction landmark genomic scanning (RLGS) have found methylation differences between the testis and other tissues (14, 15), but these studies either did not identify the sequences or the analysis was restricted to tissue-specific genes. In this study, we have used RLGS as well as other techniques to explore, in a nonbiased fashion, the DNA methylation pattern in the testis.
Results and Discussion
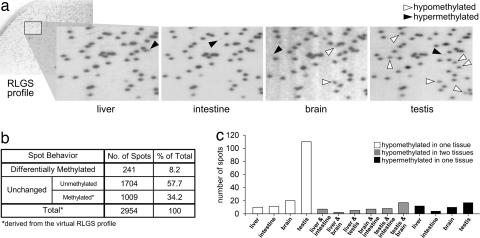
RLGS was used to survey ≈2,600 genomic NotI restriction sites that are found mostly in CpG islands but also in noncoding unique and repetitive sequences not within CpG islands. Analysis of testis, liver, intestine, and brain from adult mice revealed 241 spots that display tissue-specific intensity (Fig. 1). Although each tissue demonstrates a unique spot profile, more than one-half of all differentially methylated (DM) spots are specific to the testis. The testis displays eightfold the number of exclusively hypomethylated spots compared with the average of the somatic tissues. A comparison of adult testis and mature sperm isolated from the cauda of the epididymis display identical RLGS patterns, consistent with the fact that the adult testis is composed of a majority of mature germ cells [see supporting information (SI) Fig. 7].
Fig. 1.
RLGS analysis of tissue-specific DNA methylation. Two-dimensional spot profiles are produced by digestion of genomic DNA with the methylation-sensitive restriction enzyme, NotI, followed by radioactive end-labeling. A spot is produced if the site is unmethylated and absent if methylated. (a) Enlargements of liver, intestine, brain, and testis RLGS profiles. Black and white arrowheads denote hyper- and hypomethylated spots, respectively. (b) Summary of RLGS spot data. A total of 1,945 spots are visible over four tissues; 241display differential intensity between tissues. Consistent methylation of ≈1/3 of all spots is predicted by subtracting the total visible spots from the total number of spots calculated by virtual RLGS analysis of the mouse genome. (c) Tissue-specific breakdown of DM spots. Hyper- and hypomethylated spots can occur either in one tissue or can be shared. More than half of all observed DM spots are testis-specific.
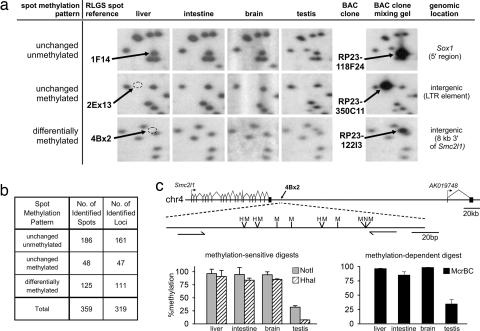
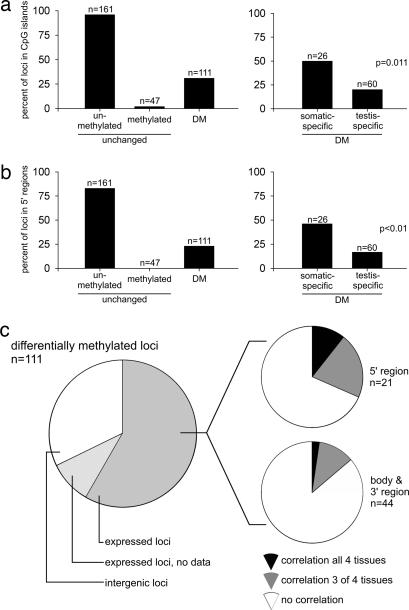
Using a combination of the mouse RLGS spot cloning library (16) and the virtual RLGS method (D.J.S., R. Wenger, and C. Plass, unpublished work), we identified the genomic location of approximately half (125) of the DM spots (Fig. 2 and SI Table 2). We further identified the genomic locations of 48 “absent” spots that correspond to unchanged methylated NotI sites and, combining 89 spots identified in ref. 16, 186 unchanged unmethylated spots. Over 90% of loci that are unmethylated and unchanged in all tissues are found in CpG islands and within the 5′ region of genes; unchanged methylated loci are found in regions of low CpG content and away from 5′ regions (Fig. 3). Interestingly, DM loci are found in sequences of diverse CpG content and in various locations within and outside of known genes. Focusing on the loci that are either DM between testis and somatic tissue (testis-specific DM) or DM between different somatic tissues (somatic-specific DM) reveals that testis-specific DM loci are less likely to be located in 5′ regions of genes or to be found in strong CpG islands than are somatic-specific DM loci. Only 20% of testis-specific DM loci are within CpG islands and include genes that are previously known to be DM, such as imprinted genes (Cdkn1c, U2af1-rs1, and Nap1l5) and testis-specific genes (Ddx4 and Hspa1l), whereas the remaining 80% (non-CpG island) represent previously uncharacterized DM loci.
Fig. 2.
Identification and confirmation of the genomic locations of RLGS spots. (a) The identity of 260 unmethylated, methylated, or DM spots was established by observing enhanced spot intensity on RLGS gels produced by mixing plasmid or BAC clone DNA with genomic testis DNA as background. (b) Summary of identified spots and the corresponding loci. Forty spots were found to originate from the same NotI site as another spot and were removed from the data set to ensure that each spot relates to a single locus. (c) Verification of the DNA methylation status of identified loci by using the qAMP assay (25). Real-time PCR amplification of the region after digestion with the methylation-sensitive enzymes HhaI(H) and NotI(N) and the methylation-dependent enzyme McrBC(M) confirms the testis-specific hypomethylation of the 4Bx2 locus using all three enzymes. The methylation status of a total of 36 identified loci was verified by using this method.
Fig. 3.
Analysis of identified loci. (a and b) The positional distribution of all identified loci with respect to CpG islands (a) and 5′ regions (b). All identified loci were grouped according to their DNA methylation pattern in different tissues as being either unmethylated, methylated or DM. DM loci are subdivided into somatic- and testis-specific DM loci. The percentages of loci from each group that are found in CpG islands and within 5′ regions are shown. Proportionally fewer testis-specific DM loci are within CpG islands and 5′ regions (P < 0.05). (c) The correlation of expression of known genes with tissue-specific methylation of DM loci. Approximately 2/3 of all DM loci are located within or near known genes. Relative levels of tissue-specific expression are known for 66 of these genes in the GNF gene-expression database. Tissue-specific hypomethylation correlated with expression in only a minority of DM loci in the vicinity of genes.
Seventy-five percent of NotI sites are found within CpG islands (18). Because of this bias, by using RLGS, we would expect to find a majority of DM loci in CpG islands if they are located randomly. The high proportion of DM loci being found in non-CpG islands is highly significant for both testis and somatic tissues (P < 1 × 10⁻¹⁷ and P < 1 × 10⁻⁷, respectively), clearly demonstrating that a unique state of DNA methylation exists outside CpG island sequences, especially in the testis. This finding also implies that the numbers of testis-specific DM loci that are found away from CpG islands are vastly underrepresented on RLGS profiles.
In the mouse, NotI sites are found within some interspersed repetitive elements, predominantly in the internal sequence of intracisternal-A particle (IAP) and in the long terminal repeats (LTRs) of early transposon (ETn) and other LTR-containing families of repeat sequences (18–20). All unchanged unmethylated loci were found solely within nonrepetitive sequences, whereas approximately one-half of the unchanged methylated loci were found to be within various interspersed repeats, particularly IAP (Table 1). An analysis of 240 and 60 NotI sites (present on virtual RLGS profiles) within IAP and ETn repeats, respectively, revealed consistent hypermethylation in all tissues tested, as revealed by the absence on actual RLGS profiles (SI Fig. 8). Despite the high level of methylation of repetitive DNA, a limited number of full-length LTR-containing repeats were found to be unmethylated in somatic tissues. Interestingly, all these repeats were methylated in the testis. We did find several repetitive elements to be hypomethylated in the testis that are specific to solitary LTR fragments belonging to ERVK (class II) and MaLR (class III) of the LTR family of repeats. The differential methylation state of longer-length LTRs vs. solitary LTRs demonstrates that some small repetitive sequences are not targets for methylation in the testis. Transcripts derived from these specific subfamilies of repetitive elements are present and are developmentally regulated in female germ cells and early embryos (21). These sequences may serve a functional role in germ cells (22) or may not be of sufficient length and/or are too divergent to be targeted by the methylation machinery.
Table 1.
The number and characterization of repetitive elements associated with identified RLGS loci
| DNA methylation pattern | Total loci, n | Repetitive, n (%) | Hypermethylated | Hypomethylated | Classification of repetitive elements |
|||||
|---|---|---|---|---|---|---|---|---|---|---|
| Non-LTR-containing |
LTR-containing (solitary LTR) |
|||||||||
| ERVK |
MaLR |
|||||||||
| SINE | LINE | IAP | ETn | RLTR | MT | |||||
| Unchanged unmethylated | 161 | 0 (0) | 0 | 0 | 0 | 0 | 0 | 0 | 0 | 0 |
| Unchanged methylated | 47 | 23 (49) | 23 | 0 | 1 | 3 | 11 | 3 (1) | 4 (2) | 1 (1) |
| DM testis vs. somatic | 60 | 22 (37) | 3 | 19 | 0 | 1 | 0 | 1 | 18 (17) | 2 (2) |
| DM intersomatic | 26 | 3 (12) | 0 | 3 | 0 | 0 | 0 | 3 | 0 | 0 |
RLTR, retrotransposon LTR; ERVK, endogenous retrovirus K; IAP, intracisternal-A particle; ETn, early transposon; MT, mouse transcript; MaLR, mammalian retrotransposon-like; SINE, short interspersed transposable; LINE, long interspersed transposable.
The germ cells of the testis have a highly unique global transcriptional profile owing to the vast number of different gene products that are produced during meiosis and spermiogenesis (23). Although testis-specific DM loci are generally not found in typical promoter regions, hypomethylation of loci found in or near genes could be related to increased gene activity. Of the 72 DM loci found within expressed sequences, tissue-specific expression levels are known for 62 in the GNF SymAtlas database. Of these, only 2 of 21 loci found in 5′ regions, Ddx4 and Cdkn1c, and 1 of 44 non-5′ loci, Hspa1l, demonstrated a correlation in all four tissues of increased expression with hypomethylation (Fig. 3c). Only nine additional loci showed a correlation in three of four tissues. The poor correlation with expression, coupled with the fact that approximately a third of all DM loci are not found associated with known expressed sequences and many are within repetitive sequences, suggests that, in addition to its role as a transcriptional regulator, DNA methylation has additional functions, especially outside 5′ regions.
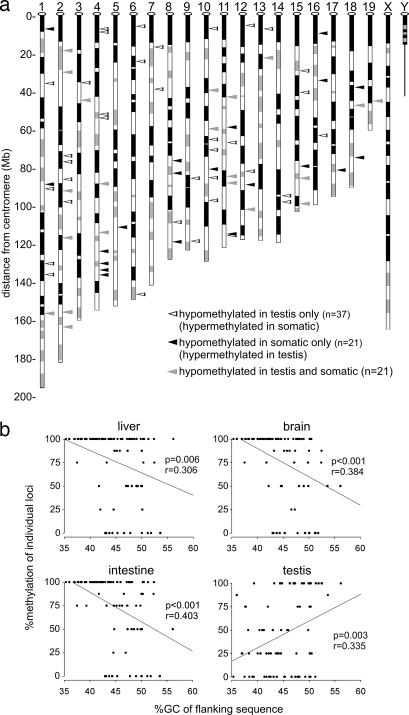
The majority of loci that are found to be DM in this study occur within non-CpG-island sequences in the testis. As a potential explanation, we observed that those loci that are hypermethylated in the testis are significantly more commonly located within R (reverse)-type bands on chromosomal ideograms, and that loci hypomethylated in the testis are commonly located in G (Giemsa) bands (Fig. 4a and SI Fig. 9). Heterogeneous banding patterns reveal regional differences in chromosomal structure and are related to the disparity in the long-range G+C nucleotide composition that occurs along chromosomes (24). R-bands generally contain above-average and G-bands contain below-average GC content. We tested whether the sequence that surrounds each locus in these two groups differs in overall GC content. We found that loci that are hypomethylated specifically in the testis are found in regions of lower GC content (SI Fig. 9). Consistent with the banding-pattern results, loci that are hypomethylated in somatic tissue are located in regions of higher GC content, opposite to what is found in the testis. To further compare the differential nature of the relationship between methylation and GC content between testis and somatic tissues, the level of methylation of all identified non-CpG-island hypomethylated loci in each tissue was compared with its regional GC content. In all somatic tissues, there is a significant negative relationship between the level of methylation and GC content, demonstrating that lower GC-content regions are more likely to be hypermethylated (Fig. 4b). In the testis, this relationship is inverted, illustrating that lower GC content regions are specifically hypomethylated.
Fig. 4.
Analysis of non-CpG-island hypomethylated loci. (a) The chromosomal locations of non-CpG-island loci that are hypomethylated in testis, somatic tissues, or both (open, black, and gray triangles, respectively) are shown. (b) Correlation analysis of all hypomethylated non-CpG-island loci comparing the percent GC of 50 Kb of flanking sequence with the level of methylation as assessed by visual inspection of each RLGS spot in different tissues. The relationship between methylation and GC content is inverted in testicular DNA. Ideograms are adapted from the University of California, Santa Cruz, CA, genome browser.
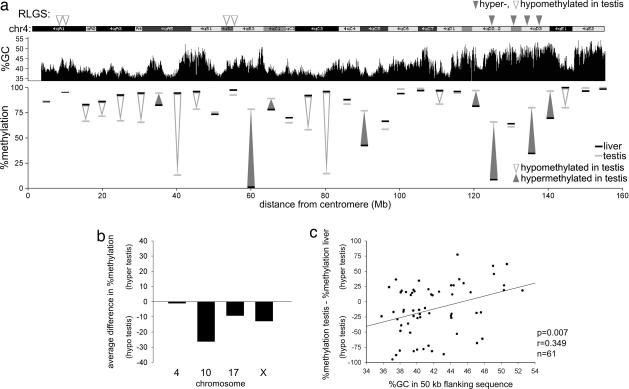
Because of the GC-rich nature of the NotI recognition site (GCGGCCGC), RLGS sites are relatively rare in non-CpG-island DNA and are biased toward sequences of higher GC content. To avoid this bias and the potential influence of nearby genes and repeat elements on DNA methylation, we focused on HhaI, HpaII, and McrBC sites in non-5′, non-CpG-island, and nonrepetitive sequences using the qAMP assay (25). A survey of 104 small amplified regions evenly spaced along chromosomes 4, 10, 17, and X in liver and testis shows striking differences in the pattern of DNA methylation between the two tissues (Fig. 5a and SI Fig. 10). Consistent with the RLGS findings, lower levels of methylation are generally found in the testis (Fig. 5b). In liver, non-CpG-island sequences are generally highly methylated in GC-poor regions, whereas lower levels are observed in some GC-rich regions. In the testis, the methylation status of these sites is again found to be inverted by using this alternate approach. A comparison of the regional GC content with the difference in methylation between the two tissues reveals a significant correlation between lower GC content and hypomethylation on these four chromosomes in the testis (Fig. 5c).
Fig. 5.
DNA methylation analysis of non-CpG-island DNA on chromosomes 4, 10, 17, and X using the qAMP assay. Primers were designed to flank McrBC and HhaI or HpaII restriction sites placed at roughly 5-Mb intervals along each chromosome. Amplified regions were chosen only on the basis of the sequence not being in the proximity of a CpG island or a known 5′ region, or within a repetitive sequence. (a) Analysis of chromosome 4. The percentage of DNA methylation of each amplified region in liver (black dash) and testis DNA (gray dash) is shown. Differences in methylation are shown by arrows. The ideogram and GC percentage are shown, as are the positions of hyper- and hypomethylated loci identified by using RLGS. (b) The average difference in percentage of methylation of all DM regions analyzed on each chromosome shows an overall decreased level of methylation in testis vs. liver in three of four chromosomes. Unchanged regions (<10% difference) were excluded. (c) The correlation between the difference in methylation in each region on all three chromosomes and the GC percent of flanking sequence shows a lower relative level of methylation in the testis in sequences of lower GC content. Chromosome 4 ideogram and percentage of GC were obtained from the University of California, Santa Cruz, CA, genome browser.
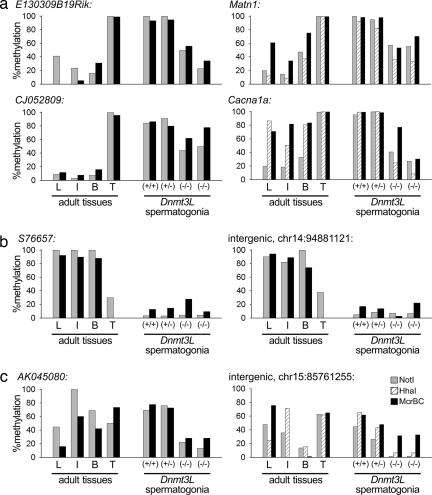
These data show that, by taking into account broad regional characteristics of chromosomes, we are able to explain a significant proportion of the differences of DNA methylation that occur at single sites or small regions in non-CpG-island sequences at both a whole-chromosome and a genome-wide scale. Because these differences occur broadly, are more likely to occur away from regulatory regions of genes, and correlate with broad attributes of chromosomes, the possibility is raised that the testicular DNA methylation pattern may have a role in maintaining a unique chromosomal state that is capable of undergoing germ cell-specific processes, such as meiosis. The Dnmt3L gene is highly expressed during the perinatal period of reprogramming in male germ cells; yet, the primary defect that results from the disruption of the Dnmt3L gene is observed after birth in meiotic germ cells in which highly abnormal chromosomal structures are seen (2). If the testis-specific methylation patterns we describe for non-CpG-island sequences have a role in chromosome structure or meiosis in germ cells, we would predict that these patterns might be altered in the germ cells of Dnmt3L−/− mice. To address this issue, spermatogonia were isolated from Dnmt3L−/− mice, and the methylation levels at various DM loci determined by RLGS were analyzed by using qAMP (Fig. 6). In the spermatogonia from Dnmt3L−/− mice, all loci examined that were hypermethylated in the testis failed to gain the normal levels of methylation found in wild-type spermatogonia and testis. Other DM loci are also hypomethylated. Testis-specific hypomethylated loci remained normal, indicating that the primary influence of Dnmt3L is to promote DNA methylation. Furthermore, levels of methylation in wild-type spermatogonia resemble the levels found in the adult testis, demonstrating that the testis-specific pattern was acquired in early germ cell development at these non-CpG-island sequences.
Fig. 6.
Levels of DNA methylation in Dnmt3L-deficient spermatogonia and adult tissues. The percent methylation of DM RLGS loci that are hypermethylated in testis (a), hypomethylated in testis (b), and somatic-specific DM (c) was determined by using qAMP. Loci that are hypermethylated in the testis fail to gain normal levels of methylation in Dnmt3L-deficient spermatogonia. Analyzed loci were all in non-5′ regions. L, liver; I, intestine; B, brain; T, testis.
We have demonstrated the finding that male germ cells have highly unique patterns of DNA methylation, with most of the hypomethylation found in nonrepetitive, non-CpG-island sequences. These hypomethylated sequences do not correlate with expression patterns, which is consistent with the fact that they are generally not found in the regulatory regions of genes. Instead, they are correlated with regional chromosome features, such as banding patterns and GC content. Although another study inferred a paucity of non-CpG-island hypomethylation in germ cells (8), experimental evidence in the present study indicates a prominent role for regulation of DNA methylation in this compartment of the testis genome. Because greater than half of the total genomic sequence and CpG dinucleotide content belongs to nonrepetitive, non-CpG-island DNA (26), these modifications might be expected to have prevalent effects on the overall structure of chromosomes in the testis. We also find that in the spermatogonia of Dnmt3L−/− mice, a model that displays abnormal chromosomal structures, at the sites examined, the unique testicular DNA methylation pattern is not established. We propose that the maintenance of a unique, germ cell-specific chromosomal structure may require a distinct configuration of DNA methylation patterns in non-CpG-island DNA.
Materials and Methods
RLGS and Spot Identification.
Adult male C57BL/6 mice were from Charles River Laboratories (St-Constant, QC, Canada). Genomic DNA was isolated from tissues by using proteinase K, followed by phenol extraction (27). RLGS was done as described (27). Three replicate RLGS profiles were generated for each tissue. Each spot was assessed a score between 0 and 4 based on its intensity relative to surrounding, fully unmethylated spots. Intensity scores of 0, 1, 2, 3, and 4 are representative of 100, 75, 50, 25, and 0% methylation, respectively. Visual assessment of spot intensity was confirmed by densitometry. All DM spots were observed to be changed in all three replicates. Spot identities were determined by using either the RLGS cloning library (16) or the virtual RLGS method (D.J.S., R. Wenger, and C. Plass, unpublished work). Loci identified by using virtual RLGS were confirmed by obtaining the corresponding BAC clone (Roswell Park Microarray Core Facility, Buffalo, NY) and running RLGS mixing gels. The methylation status of 36 identified loci was confirmed by using the qAMP methylation assay (25). Briefly, DNA is digested with various methylation-sensitive and methylation-dependent restriction enzymes and amplified by using real-time PCR. Changes in cycle threshold values were used to calculate the percentage of methylation at each restriction enzyme site. For the analysis of chromosomes 4, 10, 17, and X, the percentage of methylation of each locus was determined by averaging the values obtained for all of the restriction enzyme sites analyzed within the amplified region. To obtain purified Dnmt3L-deficient spermatogonia, heterozygous Dnmt3L-deficient mice (28) were crossed with GOF18deltaPE-Oct4/GFP mice (29), and spermatogonia were isolated from the testes of 6-dpp offspring by using fluorescence-activated cell sorting; 3–5 mice were pooled in each group. All primers are listed in SI Tables 3 and 4.
Data Analysis.
All positional and sequence information was obtained from the University of California, Santa Cruz, CA, genome browser (30) Mouse August 2005 assembly, mm7 (http://genome.ucsc.edu/). Chromosomal bands were defined as a G-band if they appeared to be black or gray and as an R-band if they appeared to be white on ideograms. CpG islands were defined by the criteria of Takai and Jones (31) (G+C ≥55%, CpGobs/exp ≥0.6, ≥500 bp), 5′ regions were defined as being within −3 to +1 kb of the transcriptional start site. DM loci were divided into the subcategories of “somatic-specific DM” and “testis-specific DM” if the unique state of hyper- or hypomethylation occurred solely in a single somatic tissue or in the testis, respectively. SigmaStat v3.0 software (SPSS, Chicago, IL) was used for statistical analysis, with P < 0.05 considered to be significant. Gene expression data were obtained from the GNF SymAtlas v1.2.4 expression database (http://symatlas.gnf.org/SymAtlas/) by using the GNF1M gcRMA data set.
Supplementary Material
Acknowledgments
We thank T. Bestor (Columbia University, New York, NY) for the gift of the Dnmt3L−/− mice and H. Scholer (Max Planck Institute for Molecular Biomedicine, Münster, Germany) for the gift of the GOF18dΔPE-Oct4/GFP mice. C.C.O. and S.L. are recipients of Canadian Institutes of Health Research (CIHR) Doctoral Research Awards and Montreal Children's Hospital Studentship Awards. J.M.T. is a William Dawson Scholar of McGill University and a Scholar of the Fonds des Recherches en Santé du Québec. B.R. is a James McGill Professor of McGill University. This work was supported by funding from the CIHR.
Abbreviations
- DM
differentially methylated
- LTR
long terminal repeat
- RLGS
restriction landmark genomic scanning
- qAMP
quantitative analysis of DNA methylation by real-time PCR.
Footnotes
The authors declare no conflict of interest.
This article is a PNAS direct submission.
This article contains supporting information online at www.pnas.org/cgi/content/full/0607521104/DC1.
References
- 1.Reik W, Dean W, Walter J. Science. 2001;293:1089–1093. doi: 10.1126/science.1063443. [DOI] [PubMed] [Google Scholar]
- 2.Bourc'his D, Bestor TH. Nature. 2004;431:96–99. doi: 10.1038/nature02886. [DOI] [PubMed] [Google Scholar]
- 3.Kaneda M, Okano M, Hata K, Sado T, Tsujimoto N, Li E, Sasaki H. Nature. 2004;429:900–903. doi: 10.1038/nature02633. [DOI] [PubMed] [Google Scholar]
- 4.Hayashi K, Yoshida K, Matsui Y. Nature. 2005;438:374–378. doi: 10.1038/nature04112. [DOI] [PubMed] [Google Scholar]
- 5.Ferguson-Smith AC, Surani MA. Science. 2001;293:1086–1089. doi: 10.1126/science.1064020. [DOI] [PubMed] [Google Scholar]
- 6.Morgan HD, Sutherland HG, Martin DI, Whitelaw E. Nat Genet. 1999;23:314–318. doi: 10.1038/15490. [DOI] [PubMed] [Google Scholar]
- 7.Rakyan VK, Chong S, Champ ME, Cuthbert PC, Morgan HD, Luu KV, Whitelaw E. Proc Natl Acad Sci USA. 2003;100:2538–2543. doi: 10.1073/pnas.0436776100. [DOI] [PMC free article] [PubMed] [Google Scholar]
- 8.Rollins RA, Haghighi F, Edwards JR, Das R, Zhang MQ, Ju J, Bestor TH. Genome Res. 2006;16:157–163. doi: 10.1101/gr.4362006. [DOI] [PMC free article] [PubMed] [Google Scholar]
- 9.La Salle S, Mertineit C, Taketo T, Moens PB, Bestor TH, Trasler JM. Dev Biol. 2004;268:403–415. doi: 10.1016/j.ydbio.2003.12.031. [DOI] [PubMed] [Google Scholar]
- 10.La Salle S, Trasler JM. In: The Sperm Cell: Production, Maturation, Fertilization, Regeneration. De Jonge C, Barratt C, editors. New York: Cambridge Univ Press; 2006. pp. 279–322. [Google Scholar]
- 11.Bellvé AR, Cavicchia JC, Millette CF, O'Brien DA, Bhatnagar YM, Dym M. J Cell Biol. 1977;74:68–85. doi: 10.1083/jcb.74.1.68. [DOI] [PMC free article] [PubMed] [Google Scholar]
- 12.Sanford J, Forrester L, Chapman V, Chandley A, Hastie N. Nucleic Acids Res. 1984;12:2823–2836. doi: 10.1093/nar/12.6.2823. [DOI] [PMC free article] [PubMed] [Google Scholar]
- 13.Maclean JA, Wilkinson MF. Curr Top Dev Biol. 2005;71:131–197. doi: 10.1016/S0070-2153(05)71005-X. [DOI] [PubMed] [Google Scholar]
- 14.Shiota K, Kogo Y, Ohgane J, Imamura T, Urano A, Nishino K, Tanaka S, Hattori N. Genes Cells. 2002;7:961–969. doi: 10.1046/j.1365-2443.2002.00574.x. [DOI] [PubMed] [Google Scholar]
- 15.Song F, Smith JF, Kimura MT, Morrow AD, Matsuyama T, Nagase H, Held WA. Proc Natl Acad Sci USA. 2005;102:3336–3341. doi: 10.1073/pnas.0408436102. [DOI] [PMC free article] [PubMed] [Google Scholar]
- 16.Yu L, Liu C, Bennett K, Wu YZ, Dai Z, Vandeusen J, Opavsky R, Raval A, Trikha P, Rodriguez B, et al. Genomics. 2004;84:647–660. doi: 10.1016/j.ygeno.2004.06.010. [DOI] [PubMed] [Google Scholar]
- 17.Fazzari MJ, Greally JM. Nat Rev Genet. 2004;5:446–455. doi: 10.1038/nrg1349. [DOI] [PubMed] [Google Scholar]
- 18.Aota S, Gojobori T, Shigesada K, Ozeki H, Ikemura T. Gene. 1987;56:1–12. doi: 10.1016/0378-1119(87)90153-3. [DOI] [PubMed] [Google Scholar]
- 19.Baust C, Gagnier L, Baillie GJ, Harris MJ, Juriloff DM, Mager DL. J Virol. 2003;77:11448–11458. doi: 10.1128/JVI.77.21.11448-11458.2003. [DOI] [PMC free article] [PubMed] [Google Scholar]
- 20.Jurka J, Kapitonov VV, Pavlicek A, Klonowski P, Kohany O, Walichiewicz J. Cytogenet Genome Res. 2005;110:462–467. doi: 10.1159/000084979. [DOI] [PubMed] [Google Scholar]
- 21.Peaston AE, Evsikov AV, Graber JH, De Vries WN, Holbrook AE, Solter D, Knowles BB. Dev Cell. 2004;7:597–606. doi: 10.1016/j.devcel.2004.09.004. [DOI] [PubMed] [Google Scholar]
- 22.Shapiro JA. BioEssays. 2005;27:122–125. doi: 10.1002/bies.20192. [DOI] [PubMed] [Google Scholar]
- 23.Shima JE, McLean DJ, McCarrey JR, Griswold MD. Biol Reprod. 2004;71:319–330. doi: 10.1095/biolreprod.103.026880. [DOI] [PubMed] [Google Scholar]
- 24.Bernardi G, Olofsson B, Filipski J, Zerial M, Salinas J, Cuny G, Meunier-Rotival M, Rodier F. Science. 1985;228:953–958. doi: 10.1126/science.4001930. [DOI] [PubMed] [Google Scholar]
- 25.Oakes CC, La Salle S, Robaire B, Trasler JM. Epigenetics. 2006;1:146–152. doi: 10.4161/epi.1.3.3392. [DOI] [PubMed] [Google Scholar]
- 26.Fazzari MJ, Greally JM. Nat Rev Genet. 2004;5:446–455. doi: 10.1038/nrg1349. [DOI] [PubMed] [Google Scholar]
- 27.Okazaki Y, Okuizumi H, Sasaki N, Ohsumi T, Kuromitsu J, Hirota N, Muramatsu M, Hayashizaki Y. Electrophoresis. 1995;16:197–202. doi: 10.1002/elps.1150160134. [DOI] [PubMed] [Google Scholar]
- 28.Bourc'his D, Xu GL, Lin CS, Bollman B, Bestor TH. Science. 2001;294:2536–2539. doi: 10.1126/science.1065848. [DOI] [PubMed] [Google Scholar]
- 29.Yoshimizu T, Sugiyama N, De FM, Yeom YI, Ohbo K, Masuko K, Obinata M, Abe K, Scholer HR, Matsui Y. Dev Growth Differ. 1999;41:675–684. doi: 10.1046/j.1440-169x.1999.00474.x. [DOI] [PubMed] [Google Scholar]
- 30.Kent WJ, Sugnet CW, Furey TS, Roskin KM, Pringle TH, Zahler AM, Haussler D. Genome Res. 2002;12:996–1006. doi: 10.1101/gr.229102. [DOI] [PMC free article] [PubMed] [Google Scholar]
- 31.Takai D, Jones PA. Proc Natl Acad Sci USA. 2002;99:3740–3745. doi: 10.1073/pnas.052410099. [DOI] [PMC free article] [PubMed] [Google Scholar]
Associated Data
This section collects any data citations, data availability statements, or supplementary materials included in this article.


