Abstract
X-band EPR features in the region of 90–150 mT have previously been attributed to heme ci of the b6 complex [Zhang H, Primak A, Bowman MK, Kramer DM, Cramer WA (2004) Biochemistry 43:16329–16336] and interpreted as arising from a high-spin species. However, the complexity of the observed spectrum is rather untypical for high-spin hemes. In this work, we show that addition of the inhibitor 2-n-nonyl-4-hydroxyquinoline N-oxide largely simplifies heme ci's EPR properties. The spectrum in the presence of 2-n-nonyl-4-hydroxyquinoline N-oxide is demonstrated to be caused by a simple S = 5/2, rhombic species split by magnetic dipolar interaction (Axx = 7.5 mT) with neighboring heme bH. The large spacing of lines in the uninhibited system, by contrast, cannot be rationalized solely on the basis of magnetic dipolar coupling but is likely to encompass strong contributions from exchange interactions. The role of the H2O/OH− molecule bridging heme ci's Fe atom and heme bH's propionate side chain in mediating these interactions is discussed.
Keywords: photosynthesis, electron transfer, quinone reduction, spin–spin interaction
The x-ray structure resolution of the b6f complexes from the cyanobacterium Mastigocladus laminosus (1) and the green alga Chlamydomonas reinhardtii (2) revealed the presence of the additional redox cofactor heme ci in the b6f complex with respect to its mitochondrial/proteobacterial homologs. Heme ci is positioned in the Qi pocket of the enzyme in very close proximity to the n-side heme bH and is covalently bound to the cytochrome b protein by a single thioether linkage to a cysteine residue. No axial ligands are provided by the surrounding protein, and a water molecule or a hydroxide ion is proposed as fifth ligand to heme ci, based on the crystal structure. Heme ci's role remains enigmatic at present. Involvements in cyclic electron transfer, redox signaling, state transitions (1, 2), or simply in a variant of Qi-site turnover have been proposed.
A recent study of isolated cytochrome b6f complex from Chlamydomonas by redox-controlled optical spectroscopy has clarified heme ci's UV/visible spectral and electrochemical properties (3). The paramagnetic properties of heme ci, by contrast, are not understood at present. EPR signals in the g = 6 region have been interpreted to arise from heme ci on the basis of their sensitivity to potential exogenous sixth ligands of the putatively 5-coordinated heme (4). The number and field positions of observed lines, however, cannot be rationalized by assuming a single high-spin heme ci. The unprecedented configuration of the tightly packed pair of redox centers heme ci/heme bH, by contrast, may well explain some of ci's peculiar EPR features.
To progress in our understanding of the paramagnetic properties of this unusual redox center, we have studied the b6f complex by EPR spectroscopy in the presence and absence of the inhibitor 2-n-nonyl-4-hydroxyquinoline N-oxide (NQNO) (5) at different redox potentials and in partially ordered samples.
Results
Paramagnetic Species Observed on the Purified b6f Complex from Chlamydomonas and on Spinach Chloroplasts.
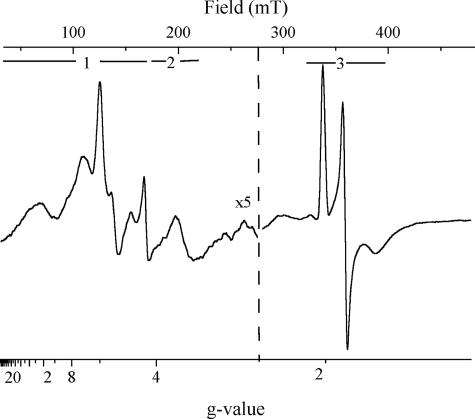
Fig. 1 shows the EPR spectrum of purified cytochrome b6f complex from C. reinhardtii poised to an ambient redox potential of +200 mV. The spectrum contains contributions from the low-spin hemes f and b (gz peaks in the spectral region labeled 2) and from a small fraction of reduced Rieske center (spectral region 3) in addition to several strong lines in the g = 6 region (region 1). The positions of the latter signals cover the range of those reported for the Mastigocladus enzyme in the untreated state and attributed to heme ci (4). High-spin hemes typically have superimposed gx and gy signals at g = 6 (for axial symmetry) or two separate signals around g = 6 (in the case of a rhombic center). Substantially more signals are present in this spectral region, and their complex structure as well as the high (g > 10) g values cannot be explained by a single high-spin heme.
Fig. 1.
EPR spectrum of the isolated b6f complex from C. reinhardtii recorded at Eh = +200 mV. EPR settings were: temperature, 15 K; microwave power, 2.02 mW; microwave frequency, 9.42 GHz; modulation amplitude, 0.003231 mT; sweep time, 83.89 s. The spectral regions of the gx/y signals of high-spin hemes (1), the gz signals of cytochromes b and f (2), and the gz,y,x signals of the Rieske center (3) are indicated. The amplitude in the low-field region has been multiplied by a factor of 5.
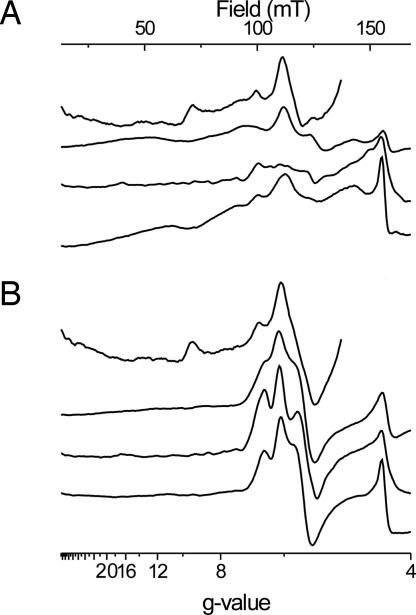
Fig. 2A compares EPR spectra of the high-spin spectral region from Chlamydomonas membranes, purified b6f complex from Chlamydomonas, and intact spinach chloroplasts and thylakoids. EPR features observed on Chlamydomonas membranes and intact spinach chloroplasts cover a narrower field range than those seen in the purified enzyme from Chlamydomonas or on thylakoids. In the latter spectra a broad peak at low field values (50–70 mT) can be observed. All samples except the purified enzyme from Chlamydomonas give rise to a distinguishable peak at g = 6.7, which was also observed in the purified enzyme from spinach and Mastidogladus (at g = 6.6) (4). The spectra of heme ci in membranes from Chlamydomonas are superimposed by a ramp-shaped signal at g = 9, which arises from adventitious iron.
Fig. 2.
EPR spectra in the low-field region of (from top to bottom) membranes of C. reinhardtii, isolated cytochrome b6f complex from C. reinhardtii, intact chloroplasts, and thylakoids from spinach for an untreated sample (A) and in the presence of NQNO (B). The amplitude of the signals was normalized to the amplitude of the Rieske spectrum after ascorbate reduction. EPR settings are as for Fig. 1. The amplitude of spectra from C. reinhardtii membranes is divided by 2 because they are contaminated by a strong iron signal at g = 9.35 and g = 4.2.
Spectral and Electrochemical Species of Heme ci in the Presence of NQNO.
Fig. 2B shows spectacular changes in the spectra induced by the addition of the inhibitor NQNO (5), a semiquinone analogue (6). The numerous resolved and unresolved lines between 40 and at least 155 mT (g = 13 to g = 4) present in the uninhibited state collapsed to a pair of peaks slightly above g = 6 and a derivative shaped line at g = 5.5. This action of NQNO corroborates the identification of the low field lines to heme ci's EPR spectrum, and the similarity of spectra recorded on spinach chloroplast and the purified enzyme from Chlamydomonas indicates that the large majority of the high-spin signals in thylakoids seen in Fig. 2A are caused by cytochrome b6f complex.
The simplified spectrum of heme ci around g = 6 in the presence of the inhibitor still shows more lines than expected for a single noninteracting paramagnetic species, which would be a peak and a derivative signal.
Alric et al. (3) have recently shown that the Qi site inhibitor NQNO dramatically affects heme ci's redox properties in optical redox titrations. In the uninhibited enzyme they determined a redox potential of +100 mV at pH 7 and a −60 mV/pH dependence. In the presence of NQNO, two distinct titration waves were observed: The major one titrated at much lower redox potentials (Em = −120 mV), whereas the second one had a potential close to that seen in the untreated state. Because the pH dependence of the high-potential (HP) wave seemed to be substantially different from that obtained on the noninhibited enzyme, Alric et al. argued that this HP species probably represented a different state of heme ci in the presence of NQNO rather than merely a fraction of complex that did not bind the inhibitor.
The presence of two populations of heme ci titrating in the presence of NQNO at potentials above and below, respectively, the midpoint potential of the close-by heme bH [−20 mV (3)] provides a powerful experimental tool to detect and investigate possible interactions between the two cofactors.
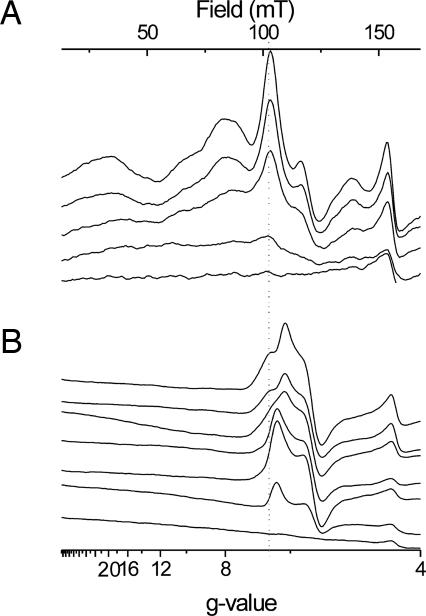
Comparison of spectra recorded at different redox potentials in the presence of NQNO (Fig. 3B) demonstrated that, rather than simply decreasing in amplitude upon progressive reduction, heme ci's signals in the g = 6 region dramatically changed shape in the course of the titration. Below +15 mV, the spectrum transformed to that of a typical rhombic high-spin heme and vanished upon further reduction without distinguishable spectral changes. A spectral conversion is therefore superimposed on the decrease in amplitude.
Fig. 3.
EPR spectra in the low-field region as recorded during a redox titration of the isolated b6f complex from C. reinhardtii (30 μM). EPR settings are as for Fig. 1. (A) Shown are results with no inhibitor; ambient redox potentials from top to bottom are: +362, +198, +18, −104, and −232 mV. (B) Shown are results in the presence of 66 μM NQNO at ambient redox potentials of (from top to bottom) +414, +200, +15, −61, −97, −217, and −337 mV.
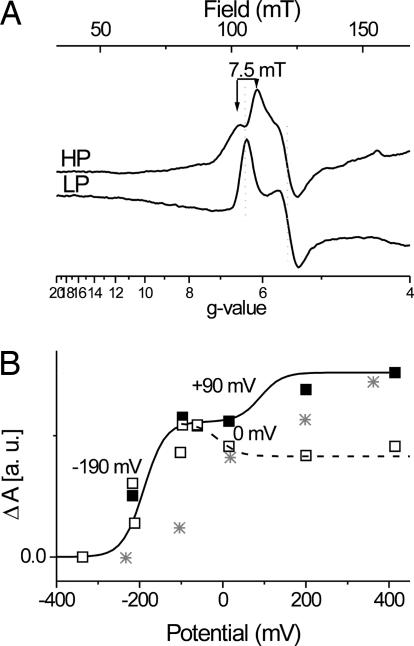
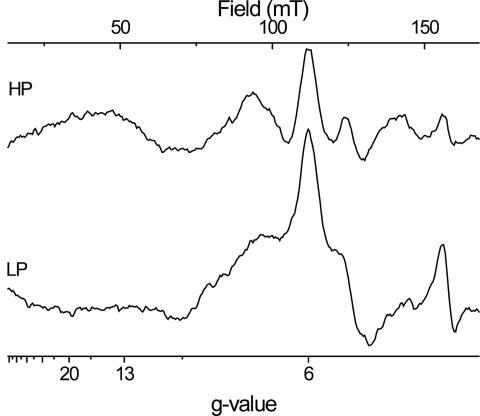
Fig. 4A shows the difference spectra of the HP and the low-potential (LP) compounds observed in this titration above and below the region of ambient potentials where the spectral conversion occurs. The spectrum of the LP component (−217 mV minus −337 mV; LP in Fig. 4A) indeed corresponded to a rhombic, noninteracting S = 5/2 paramagnetic center with gx = 6.3, gy = 5.5 (rhombicity 5%). The spectrum of the HP compound (+414 mV minus +200 mV; HP in Fig. 4A), by contrast, showed two lines symmetrically split about g = 6.3 with a splitting constant of 7.5 mT. The gy signal remained unchanged at g = 5.5. Reduction of other redox centers in the enzyme thus obviously had removed a paramagnetic interaction pattern on heme ci's EPR spectrum. The HP and LP components both show spectra that are significantly different from that seen in the uninhibited enzyme and thus confirm the proposal put forward by Alric et al. (3) that the HP electrochemical component corresponds to a second population of heme ci with NQNO present in the Qi pocket.
Fig. 4.
Evaluation of ci 's redox behavior. (A) Redox-induced EPR difference spectra of the high-spin heme signals of the isolated b6f complex from C. reinhardtii in the presence of 66 μM NQNO are shown; HP is +414/+200 mV; LP is −217/−337 mV. EPR settings are as for Fig. 1. (B) Signal amplitudes are plotted versus ambient redox potential: ■, gy signal at 5.5; □, difference of the amplitudes of the gx signals at 6.5 and 6.1. Two n = 1 Nernst curves were fitted to each set of data points. Asterisks indicate signal amplitude of the gy signal at 5.32 from the titration without inhibitor versus ambient redox potential.
A comparison of the spectral features of the HP and LP species shows that the derivative-shaped gy line at g = 5.5 is not measurably affected during the spectral conversion. We therefore used the amplitude of this line to estimate heme ci's redox potential dependence (■ in Fig. 4B). The data points indicate the presence of two waves separated by a plateau in the region of −100 to 0 mV. In the region of the HP wave the scarcity of data points did not permit the determination of an Em value. EPR experiments on highly concentrated purified enzyme require vast amounts of sample, precluding a precise titration over the whole redox range (>400 mV) by EPR. We therefore used the value of +90 mV obtained by optical spectroscopy (3) for the HP wave. The simulation of the LP wave required a lower Em value (−190 mV) than that obtained in the optical study (−130 mV).
The conversion of the split gx peak of the HP form to the simple gx peak of the LP form was evaluated by plotting the amplitude difference between the g = 6.1 peak of the HP spectrum and the g = 6.3 of the LP spectrum versus ambient potential. The resulting curve (□ in Fig. 4B) consists of the titration of (i) the redox state of the LP species and (ii) the spectral conversion corresponding to the decrease in signal amplitude at higher redox potentials. This conversion occurs at an Em value of ≈0 mV, which is close to the midpoint potential of heme bH (−20 mV) as determined by Alric et al. (3) and is incompatible with any other redox cofactors of the enzyme. These results thus clearly identify heme bH as the redox center inducing the observed interaction phenomena on heme ci's EPR spectrum.
Orientation of the g-Tensor Axes of Heme ci in the Presence of NQNO.
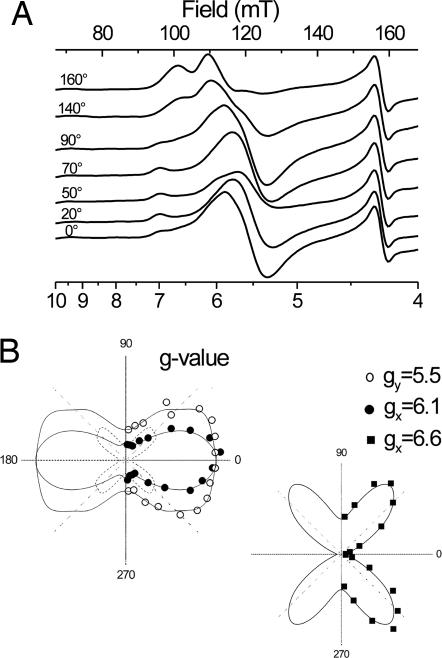
Fig. 5A shows selected EPR spectra of partially ordered membranes from spinach chloroplasts in the presence of NQNO at various orientations with respect to the magnetic field. Fig. 5B shows the corresponding polar plots for the peaks at gx1 = 6.6 and gx2 = 6.1 and the derivative signal at gy = 5.5. Both gx signals are similarly oriented, i.e., parallel to the plane of the membrane. gx and gy axes of hemes are parallel to the heme plane and perpendicular to each other. Because gx was found parallel to the membrane, the orientation of the gy signal directly yields the inclination angle of the heme plane toward the membrane. The angle of 50° determined from this study is in good agreement with heme ci's inclination, observed in the crystal structure (56°), and thus further confirmed the attribution of these spectral features to heme ci. The identical orientation of the signals at g = 6.6 and 6.1 corroborated our interpretation that they represent a single gx signal split by magnetic interaction with the closeby heme bH.
Fig. 5.
Orientation of ci 's g tensor in the presence of NQNO. (A) EPR spectra were recorded on partially ordered multilayers of chloroplast membranes from spinach in the presence of NQNO. The angle between the magnetic field and the membrane plane is indicated for each spectrum. EPR settings are as for Fig. 1 except for temperature (6 K) and microwave power (63.8 mW). (B) Polar plots of signal amplitudes are shown.
The signal at g = 6.1 was superimposed by a composite gx/gy signal at g = 6 of an axial high-spin center resulting in the apparent difference between the angular dependences of the g = 6.1 and g = 6.6 signals. Subtracting the curve obtained for the g = 6.6 peak from that of the g = 6.1 signal revealed a single orientation of the axial g = 6 component at 45° (dashed line in Fig. 5B). Both in-plane directions, gx and gy, are therefore oriented at 45° with respect to the membrane, requiring that the parent heme is perpendicular to the membrane. Possible candidates for this heme species are the high-spin form of either cytochrome b559 (7) or cytochrome bL (8).
Minor signals such as the peak at g = 7.0 and shoulders at g = 5.4, 5.7, and 6.4 may originate from different substates of heme ci in the presence of NQNO, from a Qi site devoid of NQNO or other high-spin species present in the chloroplast membrane. Currently, we cannot distinguish between these possibilities.
Characterization of Heme ci in the Uninhibited Cytochrome b6f Complex.
EPR spectra in the magnetic field region of gx/gy lines from high-spin centers taken at specific ambient potentials are shown in Fig. 3A. In contrast to the NQNO-inhibited case where a significant fraction of heme ci was still oxidized at around −100 mV (Figs. 3B and 4A), virtually no signal intensity remained at comparable potentials in the uninhibited enzyme (Fig. 3A). At first sight, this redox behavior seems to be in line with the results of the optical study where only a single HP wave at +100 mV (at pH 7) was observed. However, the amplitudes of the high-spin signals diminished over the entire titration range from +360 mV down to −100 mV, strongly deviating from a single n = 1 Nernst curve (Fig. 4B see asterisks). For instance, in the spectrum taken at +200 mV, part of the amplitude of the high-spin signals disappeared with respect to the spectrum taken at +362 mV, indicating that a population of heme ci titrates at much higher Em values than observed by Alric et al. (3). Furthermore, the spectral shape changed during the titration. Redox difference spectra shown in Fig. 6 were calculated from spectra recorded at relatively high (+362 mV minus +18 mV) and moderately low ambient redox potentials (+18 mV minus −104 mV). The broad signals at 50 mT (g = 13) and 140 mT (g = 4.8) were present mainly in the former difference spectrum. Additionally, both spectra differed in the width of the derivative-shaped line at g = 5.7 and the shape of the poorly resolved feature between 80 and 110 mT (g = 8.5 and 6.1). Unfortunately, the orientation of ci signals in uninhibited b6f complex could not be determined. Preparation of oriented membrane multilayers from these samples resulted repeatedly in loss of the spectral features from heme ci that were observed in frozen solutions. Instead, a nearly axial, unsplit g = 6 signal appeared. A regrettable experimental obstacle at first sight, this behavior may hold information on the environment of heme ci. Qi site occupancy by NQNO obviously stabilizes the otherwise more labile environment of heme ci.
Fig. 6.
Difference spectra of HP and LP components. Redox-induced EPR difference spectra of the high-spin heme signals of the isolated b6f complex from C. reinhardtii are shown: HP, +362/+18 mV; LP, +18/−104 mV. EPR settings are as for Fig. 1.
Discussion
Astonishing as heme ci was to the “functionalists” in the b6f field, it also provided a major surprise to the metalloenzyme community in general. Its single thioether linkage, the absence of axial ligands arising from the protein, and the presence of a water molecule or hydroxide ion as putative fifth ligand are unique properties for heme proteins. This H2O/OH− is in hydrogen-bonding distance to one of the propionate oxygens of heme bH, and the Fe–Fe distance between ci and bH (9.8 Å) is among the shortest observed so far for pairs of hemes. All of these characteristics together with the almost perpendicular arrangement of hemes ci and bH make the ci/bH pair a unique configuration of redox centers. Accordingly, the magnetic properties of heme ci, or more appropriately of the ci/bH pair, are quite particular.
The Spectral Properties of the NQNO-Inhibited Sample Can Be Rationalized by Magnetic Dipolar Coupling.
The results detailed above on the NQNO-treated enzyme showed that at all potentials where heme bH is oxidized and thus paramagnetic heme ci's gx peak is split in two, indicative of coupling to an S = 1/2 spin. The fact that this putative coupling disappeared with the reduction of heme bH would identify the latter as the interaction partner.
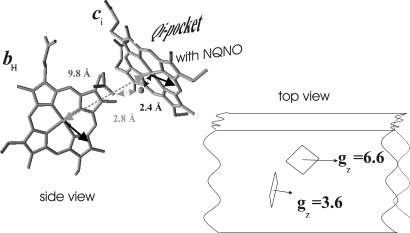
Two terms in the Hamiltonian operator of spin pairs are susceptible to inducing spectrally detectable interactions, magnetic dipolar interaction and spin exchange interaction. A rigorous determination of the respective sizes of these interactions at all g factors requires, in addition to 3D structural details of the interacting pair, the knowledge of the orientations of the corresponding g tensors with respect to the heme systems and to each other, parameters that usually are not accessible for most experimental cases. For the ci/bH pair, combining the crystal structure information and the results described above on partially ordered NQNO-inhibited membranes allow the determination of almost all relevant geometric parameters (i.e., direction cosines) of the spin pair. As detailed in Results, the data obtained on oriented samples unequivocally positioned the full g tensor of heme ci with respect to the 3D structure. Heme bH being a typical low-spin heme, its gz direction must be close to collinear with the heme normal (9) and is thus determined by the 3D structure. The only free variables are the orientations of heme bH's gy and gx axes, which are constrained to lie in the heme bH plane and to be mutually perpendicular. This fact allows one to calculate the set of possible solutions for the magnetic dipolar interaction by rotating the gx/gy diad about bH's heme normal. Most conveniently, in the case of heme ci's gx direction, i.e., the spectral position where an interaction pattern is observed experimentally, the solution is nearly insensitive to the positioning of heme bH's gx/gy diad. The geometric rationalization is illustrated in Fig. 7. As is evident from Fig. 7, heme ci's gx and heme bH's gz directions are close to collinear, which in turn translates into the magnetic dipolar interaction on heme ci's gx value being dominated by heme bH's gz value. gz being heme bH's maximal g value, the magnetic dipolar interaction visible on the gx peak of heme ci thus comes close to the maximal interaction possible for this pair of hemes. The absolute maximum value, assuming full collinearity of gx (ci) and gz (bH), obtained by solving the Hdd component of the Hamiltonian operator, is 11 mT. Taking into account a possible deviation of gz (bH) from the heme normal (<15°) (10) and the uncertainties inherent in the data obtained on oriented membranes (<10°), the experimentally observed value of 7.5 mT is perfectly among the solutions that can be obtained for Hdd. The interaction pattern visible on heme ci's EPR spectrum in the gx region can therefore be explained by magnetic dipolar interaction within the ci/bH pair. Heme bH's spectrum should in turn exhibit additional structure because of the interaction with the spin 5/2 system of heme ci. A splitting of bH's gz peak into several lines is indeed observed in the difference spectum of heme bH in the NQNO-inhibited enzyme (data not shown).
Fig. 7.
g-tensor orientation with respect to the 3D structure. (Left) Structure of the ci/bH pair. The oxygen atom bridging heme ci's central Fe atom to a propionate side-chain oxygen of heme bH (Protein Data Bank ID code ) is highlighted. Bold arrows indicate the orientations of bH's gz and ci's gx directions. (Right) Schematic representation of the mutual orientations of the ci/bH pair and their maximal g values as seen from the n-side of the membrane.
Multiple Populations of Heme ci in the Uninhibited State.
In the native enzyme, heme ci titrates almost entirely above heme bH, precluding straightforward identification of interaction-induced lines. Furthermore and in contrast to the NQNO-inhibited state, too many lines are present to be rationalized solely by interaction with heme bH. All of these lines indeed arise from heme ci because they disappear entirely after addition of NQNO (Fig. 2). We can only interpret this multitude of lines by the presence of several distinct subpopulations of heme ci. The actual existence of such subpopulations is evidenced both by distinguishable spectra in the HP and LP part of heme ci's redox titration (Fig. 6) and by the weak slope of the redox titration that cannot be fitted by a single n = 1 Nernst curve. This observation constitutes a conflict between the optical data by Alric et al. (3) who found a single n = 1 wave with an Em of +100 mV, whereas our titration curve extends from +300 to −100 mV. This discrepancy, however, can be rationalized by the different experimental methods. In the optical study, heme ci is a weak spectral component superimposed on the much larger signals of hemes bH, bL, and f. In the presence of heterogeneity, the optical approach is likely to reveal only the major, dominant population. In EPR spectra, by contrast, heme ci's gx and gy peaks show up in a spectral region free of contributions of the other hemes (see Fig. 1), at least if the latter are in their undamaged states. Because of the high transition probability of high-spin paramagnetic centers as compared with low-spin systems, heme ci's spectra are of significant size. Unfortunately, estimation of stoichiometries is much less straightforward in EPR than in optical spectroscopy. Nevertheless, from its large integrated signal intensity, the center giving rise to the broad signal at 50 mT probably represents the major population of heme ci. This spectral population was found to titrate >0 mV (Fig. 4). It therefore seems well possible that this EPR species corresponds to Alric et al.'s (3) +90 mV component, whereas the other centers represent minor populations of heme ci that escaped attention in the optical study.
Heme ci 's EPR Parameter in the Uninhibited State.
In addition to heterogeneity, rhombic distortion and spin–spin interactions (as observed for the NQNO-treated sample) will increase the number of lines deviating from the spectral position at g = 6 typical for axial S = 5/2 systems. Rhombicity alone cannot shift signals low field beyond g = 10 (11). By contrast, lines arising from heme ci are observed down to 50 mT (g = 13.5 in X band). It seems highly unlikely that these low-field lines arise from an S > 5/2 spin system because the presence of a sizeable low-spin gz signal of the potential interaction partner, heme bH (data not shown), argues against the regrouping of hemes ci and bH into a common spin system. Because the results obtained on the NQNO-inhibited sample demonstrate that spin–spin interactions do occur in the ci/bH moiety, the signals at apparently very high g most probably represent the low-field lines of a splitting imparted by spin–spin interaction on a gx < 10 peak of a rhombic S = 5/2 system.
At present, we are unable to propose a reliable attribution of lines to distinct paramagnetic centers in the presence of spin–spin coupling. Too many lines and thus too many possible configurations can be envisaged from the spectra. Several experimental methods in principle lend themselves for sorting out the spectral interpretation of the high-spin species in the uninhibited state, such as S- or Q-band EPR, analysis of oriented samples, and EPR on single crystals. So far, all three approaches have failed to yield conclusive results because of insufficient sample concentrations (for the multifrequency and single-crystal approaches) or lability of the uninhibited complex to drying on Mylar.
This ambiguity of spectral attribution not withstanding, a clear-cut conclusion can be drawn concerning the lower limit of coupling strength. Because the center of coupling-induced pairs of lines cannot exceed g = 10, the presence of the peak at 50 mT requires the splitting to be >80 mT. The maximally possible magnetic dipolar coupling constant in this system (assuming gx = 10 for heme ci and a geometry of g tensors as seen in the NQNO-inhibited state) is ≈20 mT. This finding implies that spin exchange interaction with an unusually strong coupling constant J should play an important role in the bH/ci heme pair.
On the Role of the Bridging H2O/OH− Molecule.
In the 3D structure, heme ci was found to be devoid of axial ligands provided by the parent polypeptide chain. An oxygen atom arising from H2O or OH−, however, is seen in a position appropriate for an axial ligand (Fig. 7). The high-spin state observed by EPR shows that heme ci is indeed five-coordinated and thus confirms the role of this oxygen as the fifth ligand on the heme side distal to the Qi pocket. As discussed above, the EPR spectra recorded on the uninhibited complex clearly indicate heterogeneity in the population of oxidized heme ci. A rationalization for this heterogeneity that easily comes to mind would consist of OH− being the fifth ligand in part of the centers and H2O in others. However, varying the pH between 6 and 9 resulted in only minor spectral modifications (data not shown), and we are therefore reluctant to assume different protonation states of the fifth ligand as the molecular basis for this heterogeneity. The fact that OH− is a stronger axial ligand than H2O and that furthermore no model substance has so far been reported that contains H2O as the fifth axial ligand in a five-coordinated Fe-porphyrin system indicates that in the uninhibited complex the oxygen atom seen in the structure most likely belongs to an OH− ion. The heterogeneity remains an open issue. It might be caused by different occupancies of the Qi site.
The addition of NQNO fully abolishes all heterogeneity. Because NQNO is situated in the Qi pocket, i.e., distal to the oxygen atom of the H2O/OH− molecule, a steric influence of NQNO on this latter molecule appears unlikely. To explain the dramatic effect on the EPR spectrum, NQNO must therefore itself ligate to heme ci. Despite this introduction of a “sixth” ligand, the EPR spectrum remains that of a high-spin state. The binding of NQNO thus either displaces the former fifth ligand or this ligand now binds very weakly to heme ci. The latter scenario would be in line with a water molecule because, for example, methemo/myoglobins have been shown to accommodate H2O molecules as sixth ligands while still remaining in the high-spin state (12). Coordination of NQNO to heme ci suggests a similar mode of binding for plastoquinone. An electron density near ci's iron was seen in ref. 2 but could not be unambiguously attributed to (possibly coordinated) quinone because of limited resolution.
The strongly decreased bond strength of the oxygen ligand on the heme side opposite to the Qi pocket upon binding of NQNO is paralleled by the loss of the very strong EPR coupling. In our mind, this fact emphasizes the important role of the bridging OH−/H2O molecule in setting up the strongly interacting ci/bH pair. It is tempting to speculate that, in addition to mediating spin–spin interactions, this bridging molecule may play a role in interconnecting redox properties of both hemes resulting in the seemingly contradictory redox potentials for heme ci, ranging from ≪ −50 mV (4) through −60 mV (13) to +90 mV (3). A tunable midpoint potential for heme ci would argue for a role in Qi site turnover, rather than in redox signaling or cyclic electron transfer. In such a scenario, the bH/ci pair may provide both electrons required to fully reduce plastoquinone, explaining the apparent absence of a semiquinone in the Qi site of b6f complexes.
Materials and Methods
The cytochrome b6f complex was purified from C. reinhardtii as described by Stroebel et al. (2). EPR spectra were recorded on an ESP300e X-band spectrometer (Bruker, Karlsruhe, Germany) fitted with an He-cryostat and temperature control system (Oxford Instruments, Oxon, U.K.). Redox titrations were performed as described by Dutton (14) in the presence of mediators (100 μM Cresyl Blue, anthraquinone, indigocarmine, 2,5-dimethyl-p-benzoquinone, and 50 μM ferricyanide). Reductive titrations were carried out with sodium dithionite, and oxidative titrations were carried out using ferricyanide. NQNO was synthesized in the laboratory according to the procedure described in ref. 5. It was used at a concentration of 66 μM during the redox titration; the protein concentration was 30 μM. All experiments were carried out at pH 7.
Chloroplasts were prepared from local market spinach. Two kilograms of spinach leaves were stripped from their nervures and homogenized in a precooled blender in 1 liter of 0.2 M sucrose, 10 mM NaCl, and 50 mM Tris at pH 8. The mixture was filtered through three layers of nylon cloth, centrifuged at 4,300 × g for 10 min, and resuspended in the same buffer. For the preparation of chloroplast membranes, chloroplasts were broken by an osmotic shock in a large excess of 50 mM Mops buffer at pH 7 and 2 mM EDTA and centrifuged at 290,000 × g for 1 h. The upper dark-green layer of the pellet was used for the experiments. Partially ordered chloroplast membrane multi-layers were prepared by an additional washing step of those membranes in doubly distilled water at pH 7, before painting them on Mylar sheets (15).
Acknowledgments
We thank R. Kappl (University of Homburg, Homburg, Germany) for stimulating discussions and suggestions and the group of B. Guigliarelli (Laboratoire de Bioénergétique et Ingénierie des Protéines, Centre National de la Recherche Scientifique) for extensive access to the EPR facilities.
Abbreviations
- NQNO
2-n-nonyl-4-hydroxyquinoline N-oxide
- HP
high-potential
- LP
low-potential.
Footnotes
The authors declare no conflict of interest.
This article is a PNAS direct submission.
References
- 1.Kurisu G, Zhang H, Smith JL, Cramer WA. Science. 2002;302:1009–1014. doi: 10.1126/science.1090165. [DOI] [PubMed] [Google Scholar]
- 2.Stroebel D, Choquet Y, Popot J-L, Picot D. Nature. 2003;426:413–418. doi: 10.1038/nature02155. [DOI] [PubMed] [Google Scholar]
- 3.Alric J, Pierre Y, Picot D, Lavergne J, Rappaport F. Proc Natl Acad Sci USA. 2005;102:15860–15865. doi: 10.1073/pnas.0508102102. [DOI] [PMC free article] [PubMed] [Google Scholar]
- 4.Zhang H, Primak A, Cape J, Bowman MK, Kramer DM, Cramer WA. Biochemistry. 2004;43:16329–16336. doi: 10.1021/bi048363p. [DOI] [PubMed] [Google Scholar]
- 5.Cornforth JW, James AT. Biochem J. 1956;63:124–130. doi: 10.1042/bj0630124. [DOI] [PMC free article] [PubMed] [Google Scholar]
- 6.Musser SM, Stowell HB, Lee HK, Rumbley JN, Chan SI. Biochemistry. 1997;36:894–902. doi: 10.1021/bi961723r. [DOI] [PubMed] [Google Scholar]
- 7.Rutherford AW. Biochim Biophys Acta. 1985;807:189–201. [Google Scholar]
- 8.Nitschke W, Hauska G. Biochim Biophys Acta. 1987;892:314–319. [Google Scholar]
- 9.Mailer C, Taylor CP. Can J Biochem. 1972;50:1048–1055. doi: 10.1139/o72-145. [DOI] [PubMed] [Google Scholar]
- 10.Hori H, Fujii M, Shiro Y, Iizuka T, Adachi S, Morishima I. J Biol Chem. 1989;264:5715–5719. [PubMed] [Google Scholar]
- 11.Hagen WR. In: Advances in Inorganic Chemistry. Cammack R, Sykes AG, editors. San Diego: Academic; 1992. pp. 165–222. [Google Scholar]
- 12.Bennett JE, Gibson JF, Ingram DJE. Proc R Soc London Ser A. 1957;240:67–82. [Google Scholar]
- 13.Lavergne J. Biochim Biophys Acta. 1983;725:25–33. [Google Scholar]
- 14.Dutton PL. Biochim Biophys Acta. 1971;226:63–80. doi: 10.1016/0005-2728(71)90178-2. [DOI] [PubMed] [Google Scholar]
- 15.Rutherford AW, Sétif P. Biochim Biophys Acta. 1990;1100:128–132. [Google Scholar]


