Full Text
The Full Text of this article is available as a PDF (406.9 KB).
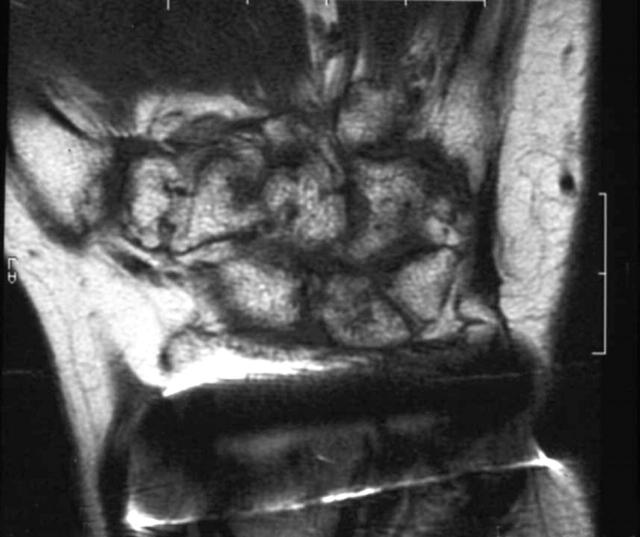
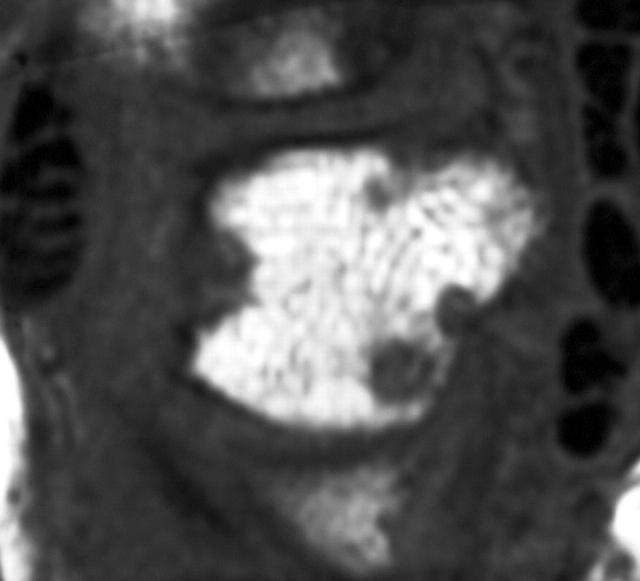
Figure 1.
T1 weighted (T1w) coronal image of the wrist in a patient with RA in whom a metal screw was used for surgical fixation of the distal radioulnar joint.
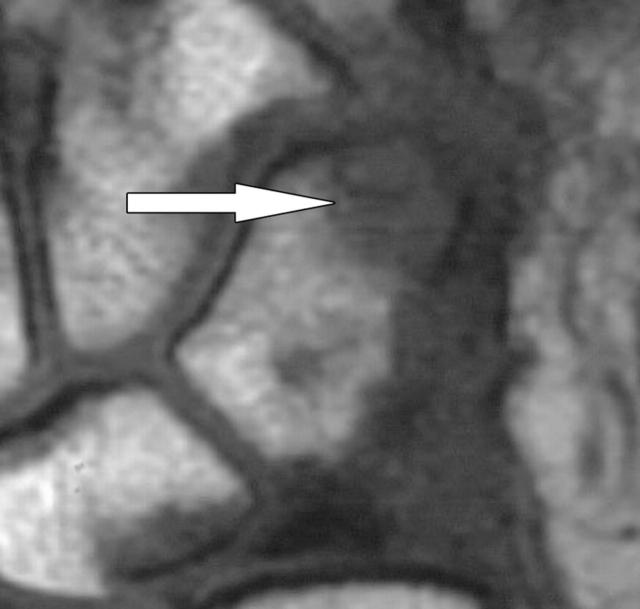
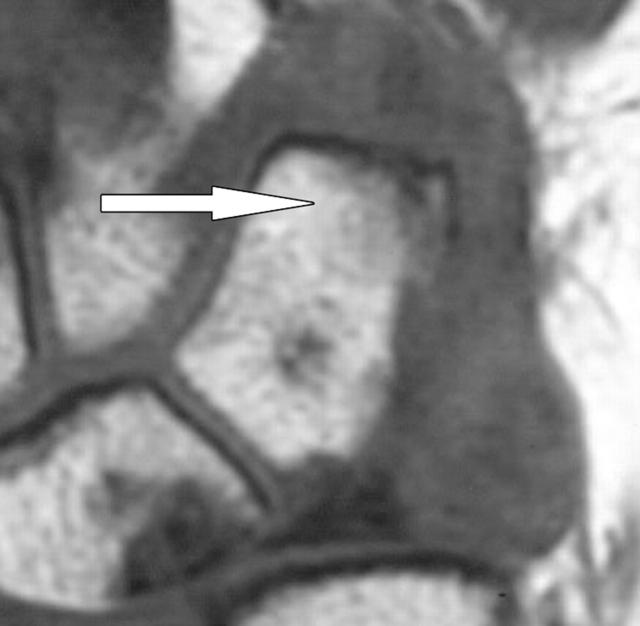
Figure 2.
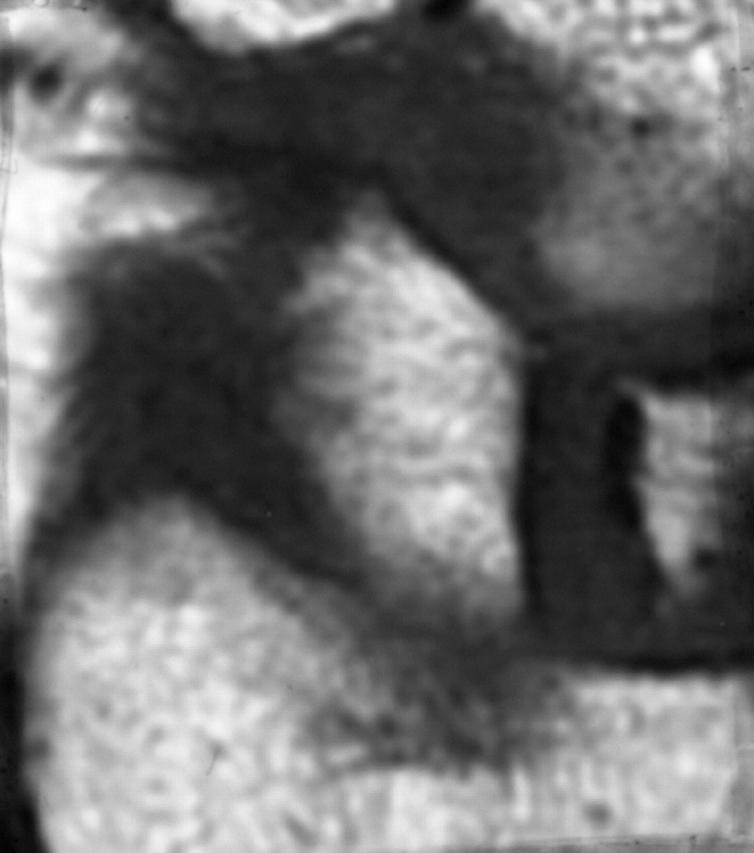
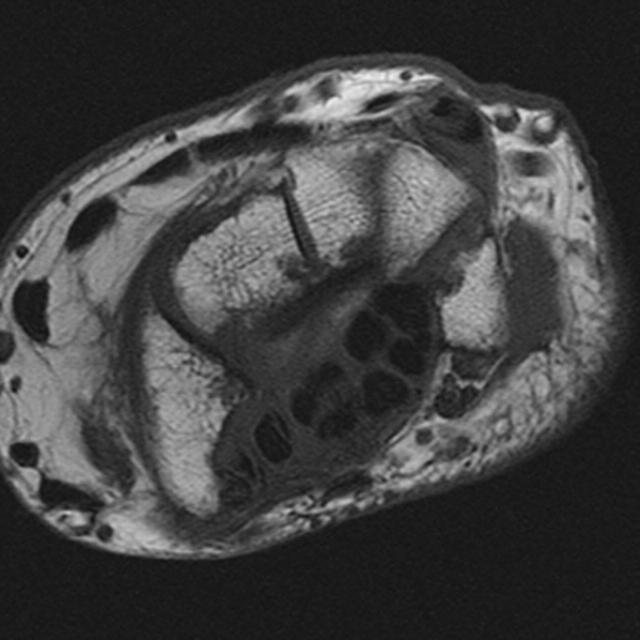
(A) T1 weighted coronal image of the scaphoid where the radial border is blurred because of adjacent synovial membrane with lower signal, "averaging" with high signal of bone marrow. (B) T1 weighted axial image showing the scaphoid margin is not eroded.
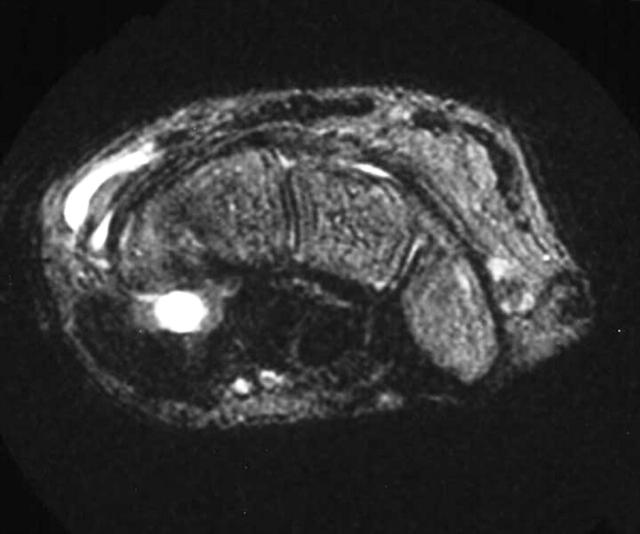
Figure 3.
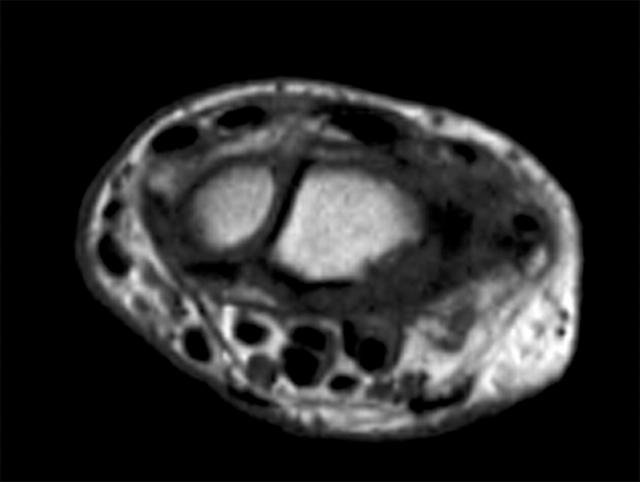
T2 weighted fat saturated (T2w FS) axial image of the wrist showing movement artefact.
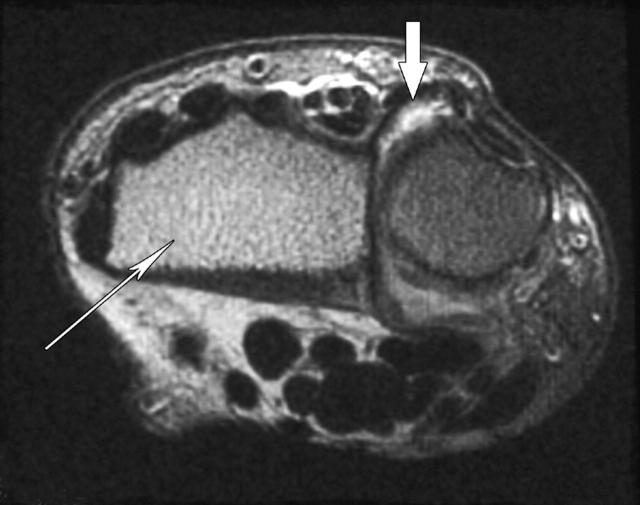
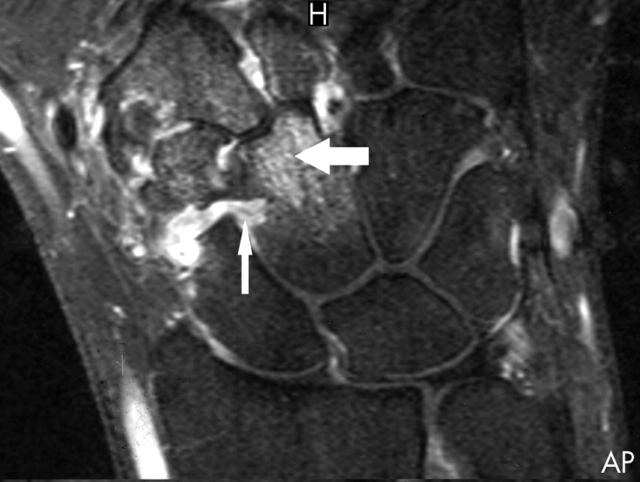
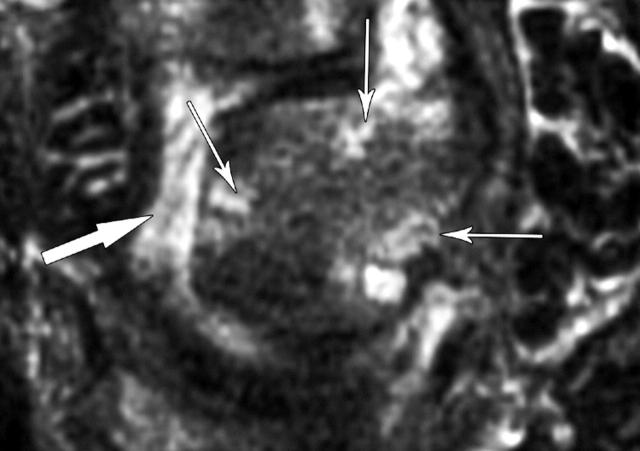
Figure 4.
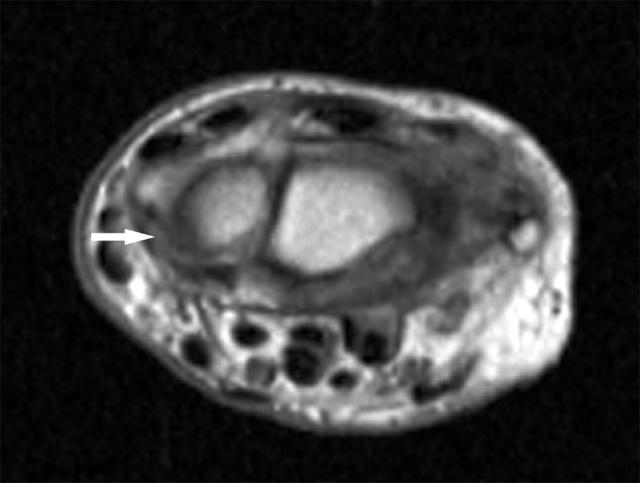
T2 weighted axial image of the distal radius and ulna. Fat saturation is complete for the ulna but not for the radius, where "shine through" of marrow fat is apparent (thin arrow). This appearance mimics bone oedema. Fat in subcutaneous tissues is also bright in the left half of the picture but not in right half where bright signal in the distal radioulnar joint indicates synovitis (wide arrow).
Figure 5.
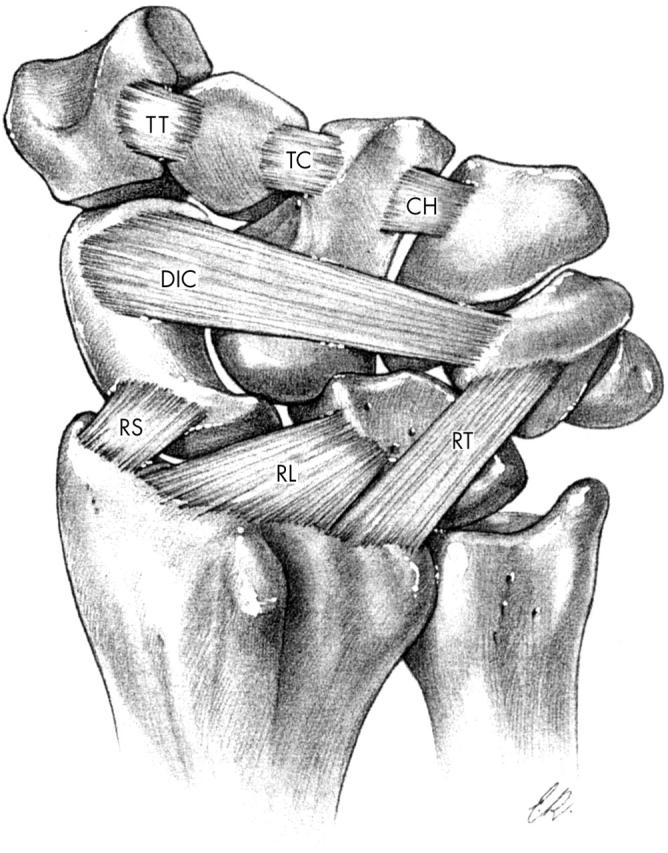
Palmar interosseous ligaments of the wrist (Reprinted from Taleisnik, J. The Wrist, Figure 2-18, copyright 1985, with permission from Elsevier Inc.).
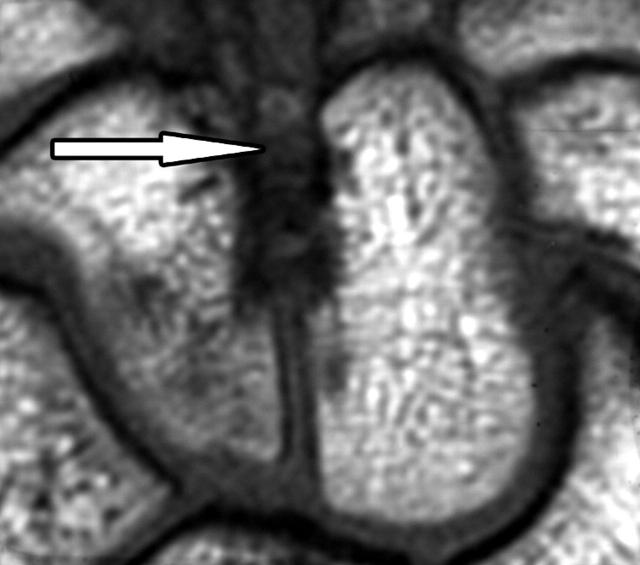
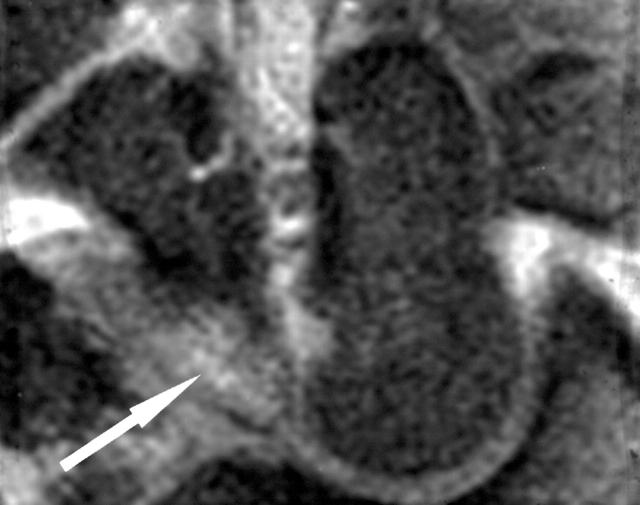
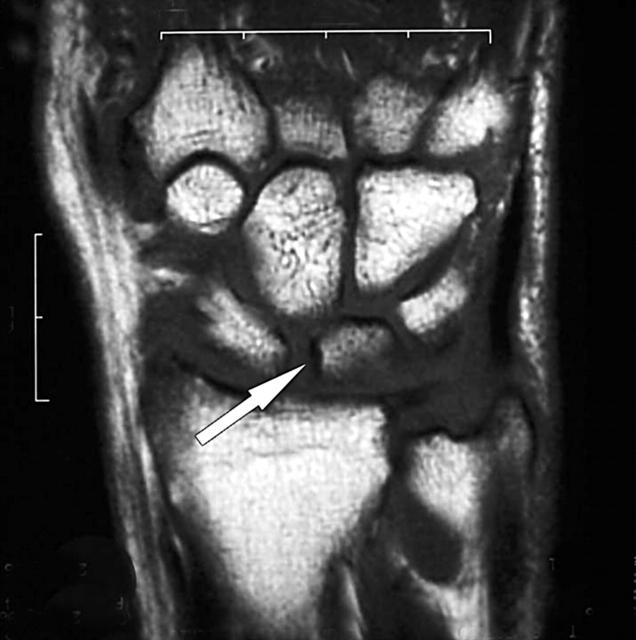
Figure 6.
(A) T1 weighted coronal image of the wrist from a patient with early RA. The interosseous ligament between the capitate and hamate blurs the inner borders of these bones distally (arrow). This appearance can mimic erosion (but erosion may also occur adjacent to this ligament). (B) On the T2 weighted fat saturated image, the ligament and adjacent synovial membrane are bright suggesting inflammation. There is also bright signal (arrow) in the hamate revealing bone oedema (seen as grey on T1 weighted image).
Figure 7.
Short tau inversion recovery (STIR) coronal image of the wrist reveals an interosseous ligament between the capitate and scaphoid (thin arrow). There is also bone oedema within the distal capitate (wide arrow).
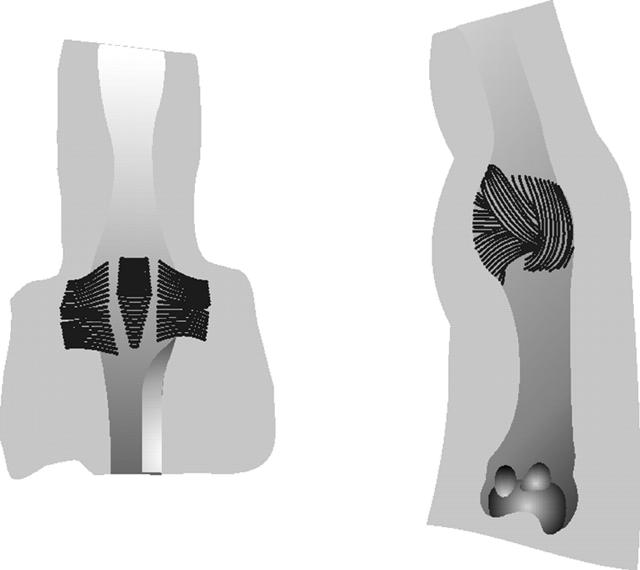
Figure 8.
Interosseous ligaments as they attach to the metacarpal head and the base of the proximal phalanx.
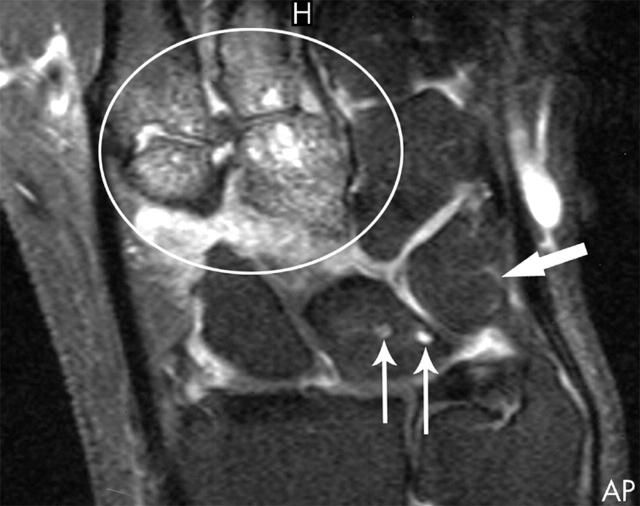
Figure 9.
Short tau inversion recovery (STIR) coronal image of the carpus showing a nutrient vessel within the triquetrum and two nutrient foramina within the lunate mimicking erosions (thin arrows). True erosions with surrounding bone oedema are shown within the distal capitate and trapezoid bones and adjacent metacarpal bases (circle).
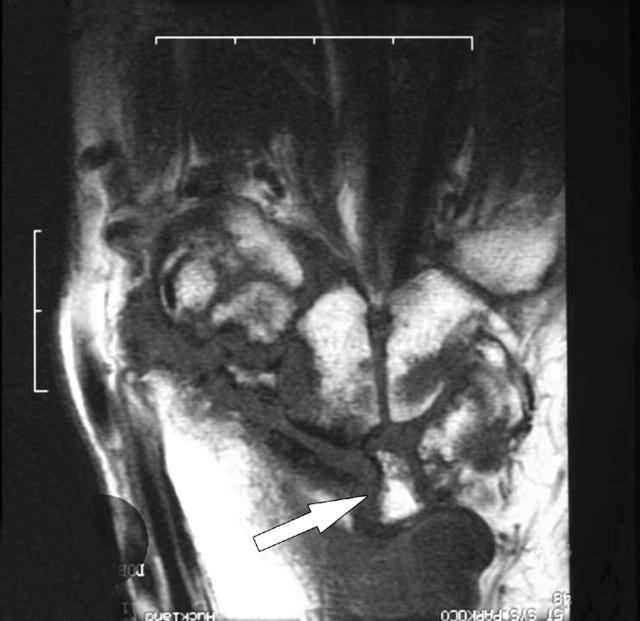
Figure 10.
(A) T1 weighted coronal image of the wrist from a patient with early RA (six months from onset). (B) T1 weighted coronal image of the same region six years later showing gross deformity of the joint with erosion and distal migration of the lunate (arrow).
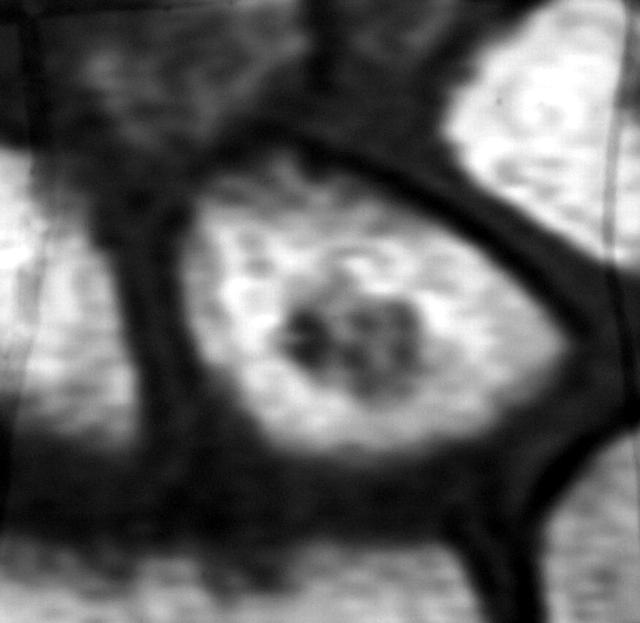
Figure 11.
(A) T1 weighted coronal image of the wrist. The central lesion in the lunate might be localised bone oedema or erosion—an axial view is required. (B) T1 weighted axial image reveals several erosions. (C) T2 weighted fat saturation axial image showing bone oedema surrounding erosions (thin arrows) and adjacent synovitis (thick arrow).
Figure 12.
(A) T1 weighted coronal image of the wrist in a patient with early RA. Bone oedema is seen at the pole of the triquetrum with blurring of the dark cortical line, raising the possibility of an adjacent erosion. Bone oedema is also present more proximally within the triquetrum and also at the proximal border of the lunate. (B) T1 weighted coronal image one year later, showing that most of the bone oedema at the pole of the triquetrum has resolved. Bone oedema remains in the centre of that bone and is now more extensive in the lunate.
Figure 13.
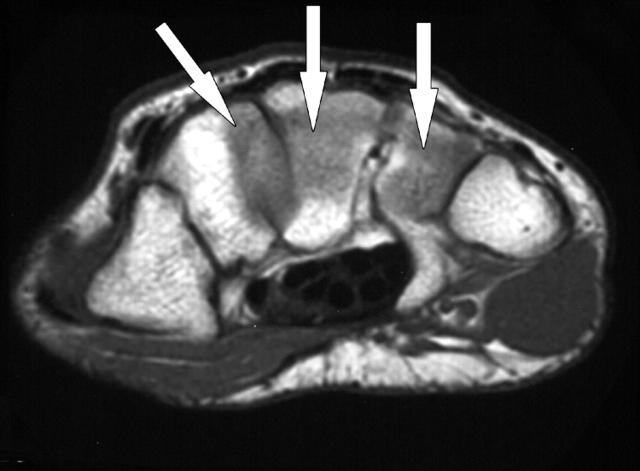
T1 weighted axial image of the wrist showing reduced signal within the capitate, hamate, and trapezoid due to proximity of the bony border adjacent to the metacarpal bases.
Figure 14.
(A) T1 weighted axial image of the wrist from a normal control subject. (B) Postcontrast (gadolinium-DTPA) image of the same region revealing a thin rim of enhancing synovial membrane adjacent to the palmar aspect of the ulna (arrow).
Figure 15.
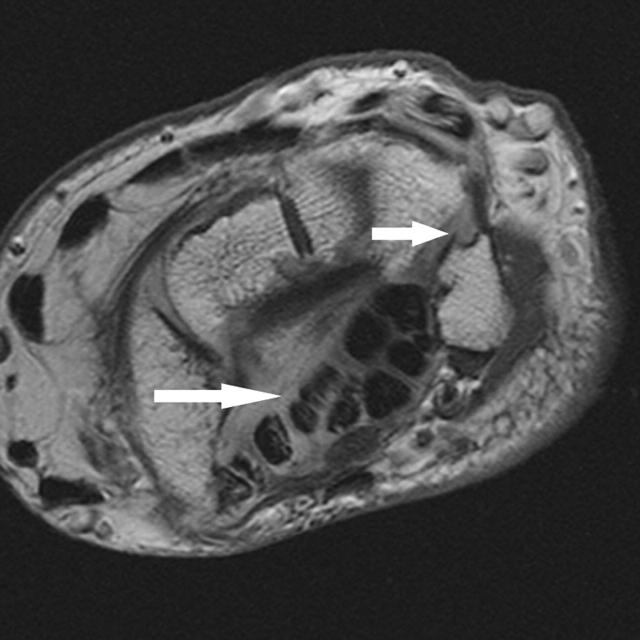
(A) T1 weighted axial image of the wrist. (B) Postcontrast T1 weighted axial image of the same region showing increased signal in the region of the flexor tendons (long arrow) plus low grade synovitis within the intercarpal joint (short arrow).
Figure 16.
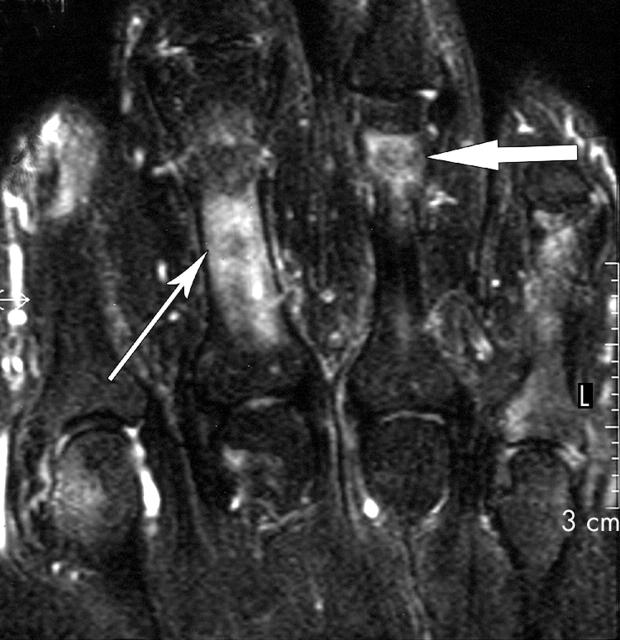
Short tau inversion recovery (STIR) coronal image of the fingers of a patient with rheumatoid arthritis covering the second to fifth metacarpophalangeal and proximal interphalangeal joints. Bright signal over the proximal phalanx of the third finger (thin arrow) resembles bone oedema but is actually due to inflammation within the flexor tendon sheath (tenosynovitis). True bone oedema is seen distally at the fourth proximal phalanx (wide arrow).
Selected References
These references are in PubMed. This may not be the complete list of references from this article.
- Ejbjerg Bo, Narvestad Eva, Rostrup Egill, Szkudlarek Marcin, Jacobsen Søren, Thomsen Henrik S., Østergaard Mikkel. Magnetic resonance imaging of wrist and finger joints in healthy subjects occasionally shows changes resembling erosions and synovitis as seen in rheumatoid arthritis. Arthritis Rheum. 2004 Apr;50(4):1097–1106. doi: 10.1002/art.20135. [DOI] [PubMed] [Google Scholar]
- Goldbach-Mansky Raphaela, Woodburn James, Yao Lawrence, Lipsky Peter E. Magnetic resonance imaging in the evaluation of bone damage in rheumatoid arthritis: a more precise image or just a more expensive one? Arthritis Rheum. 2003 Mar;48(3):585–589. doi: 10.1002/art.10819. [DOI] [PubMed] [Google Scholar]
- McQueen F. M. Magnetic resonance imaging in early inflammatory arthritis: what is its role? Rheumatology (Oxford) 2000 Jul;39(7):700–706. doi: 10.1093/rheumatology/39.7.700. [DOI] [PubMed] [Google Scholar]
- Partik B., Rand T., Pretterklieber M. L., Voracek M., Hoermann M., Helbich T. H. Patterns of gadopentetate-enhanced MR imaging of radiocarpal joints of healthy subjects. AJR Am J Roentgenol. 2002 Jul;179(1):193–197. doi: 10.2214/ajr.179.1.1790193. [DOI] [PubMed] [Google Scholar]
- Peterfy C. G., Linares R., Steinbach L. S. Recent advances in magnetic resonance imaging of the musculoskeletal system. Radiol Clin North Am. 1994 Mar;32(2):291–311. [PubMed] [Google Scholar]
- Peterfy C. G. Magnetic resonance imaging of rheumatoid arthritis: the evolution of clinical applications through clinical trials. Semin Arthritis Rheum. 2001 Jun;30(6):375–396. doi: 10.1053/sarh.2001.22497. [DOI] [PubMed] [Google Scholar]
- Østergaard Mikkel, Peterfy Charles, Conaghan Philip, McQueen Fiona, Bird Paul, Ejbjerg Bo, Shnier Ron, O'Connor Philip, Klarlund Mette, Emery Paul. OMERACT Rheumatoid Arthritis Magnetic Resonance Imaging Studies. Core set of MRI acquisitions, joint pathology definitions, and the OMERACT RA-MRI scoring system. J Rheumatol. 2003 Jun;30(6):1385–1386. [PubMed] [Google Scholar]


