Abstract
Background: Left ventricular contractility in atrial fibrillation is known to change in a beat to beat fashion, but there is no gold standard for contractility indices in atrial fibrillation, especially those measured non-invasively.
Objective: To determine whether the non-invasive index of contractility “preload-adjusted PWRmax” (maximal ventricular power divided by the square of end diastolic volume) can accurately measure left ventricular contractility in a beat to beat fashion in atrial fibrillation.
Methods: Atrial fibrillation was induced experimentally using 60 Hz stimulation of the atrium and maintained in 12 sheep; four received diltiazem, four digoxin, and four no drugs (control). Aortic flow, left ventricular volume, and left ventricular pressure were monitored simultaneously. Preload-adjusted PWRmax, the slope of the end systolic pressure–volume relation (Emax), and the maximum rate of change of left ventricular pressure (dP/dtmax) were calculated in a beat to beat fashion.
Results: Preload-adjusted PWRmax correlated linearly with load independent Emax (p < 0.0001) and curvilinearly with load dependent dP/dtmax (p < 0.0001), which suggested the load independence of preload-adjusted PWRmax. After five minutes of diltiazem administration, preload-adjusted PWRmax, dP/dtmax, and Emax fell significantly (p < 0.0001) to 62%, 64%, and 61% of baseline, respectively. Changes were not significant after five minutes of digoxin (103%, 98%, and 102%) or in controls (97%, 96%, and 95%).
Conclusions: Preload-adjusted PWRmax correlates linearly with Emax and is a useful measure of contractility even in atrial fibrillation. Non-invasive application of this method, in combination with echocardiography and tonometry, may yield important information for optimising the treatment of patients with atrial fibrillation.
Keywords: atrial fibrillation, preload-adjusted maximal power, contractility, sheep
Left ventricular contractility in atrial fibrillation is known to change in a beat to beat fashion.1,2 However, evaluating left ventricular contractility during atrial fibrillation is difficult because there is no gold standard.
Although the maximum rate of change in left ventricular pressure (dP/dtmax) has often been used to evaluate contractility during atrial fibrillation,1–5 non-invasive echocardiographic measurement of dP/dtmax is limited by the need for enough mitral regurgitation to generate a Doppler signal with a well defined velocity curve.6 In addition, dP/dtmax is known to be load dependent. Contractility in atrial fibrillation is regulated by the preceding RR interval (RR1) and the pre-preceding RR interval (RR2); this can be explained by combining post-extrasystolic mechanical restitution and the potentiation theory.2–5,7–10 In other words, beats that have a high preload tend to have a higher contractility with a longer RR1. Consequently, the load sensitivity of left ventricular dP/dtmax may lead to an overestimation of the contractility in those beats because both higher preloads and greater contractility can increase dP/dtmax under such conditions.
The end systolic pressure–volume relation (ESPVR), which is known to be a load insensitive index of contractility,11,12 was experimentally applied to atrial fibrillation in a canine model by Yamaguchi and colleagues.13 In that study, the slope of ESPVR (Emax) was identified as the slope of the line connecting the predetermined volume axis intercept (V0) of ESPVR and the upper left corner of each pressure–volume loop in a beat to beat fashion, on the assumption that V0 never changes. However, it may not be possible to apply this technique to human patients because of the need to determine V0 in normal sinus rhythm.
Preload-adjusted maximal ventricular power (PWRmax) has recently been introduced as another load insensitive index of left ventricular contractility. Left ventricular power is the product of instantaneous pressure and flow. PWRmax is the peak value during the cardiac cycle, and it reflects the left ventricular contractile state. The preload sensitivity of PWRmax can be reduced by dividing PWRmax by the square of left ventricular end diastolic volume (VED). This is known as preload-adjusted PWRmax.14,15
Although promising, preload-adjusted PWRmax has not yet been applied in the setting of atrial fibrillation. We believe that it has great potential in patients with atrial fibrillation because preload-adjusted PWRmax can be calculated non-invasively by combining echocardiography with tonometry.16 If this index is validated in atrial fibrillation, the application of the method will give us useful and important information about patients with this arrhythmia, including how to optimise rate control treatment17,18 and how best to manage tachycardic atrial fibrillation urgently in the operating room or intensive care unit.19,20
Our purpose in this study was to evaluate the use of preload-adjusted PWRmax in atrial fibrillation in an animal model. Because there is no gold standard against which to measure contractility indices in atrial fibrillation, we tried to accomplish this validation by comparing preload-adjusted PWRmax with dP/dtmax1–5 and Emax.10,13
METHODS
Animal preparation and surgical procedures
This study was approved by the Institutional Animal Care and Use Committee (IACUC) of The Cleveland Clinic Foundation. The Cleveland Clinic Foundation's IACUC is accredited by the Association for the Assessment and Accreditation of Laboratory Animal Care. The animals received humane care in compliance with the Guide for the care and use of laboratory animals, prepared by the National Academy of Sciences and published by the National Institutes of Health, and institutional guidelines.
Twelve Suffolk blackface sheep (average body weight 60.3 kg) were anaesthetised with an intramuscular injection of ketamine (20 mg/kg) and isoflurane inhalation (2.0–4.0%). The anaesthesia was maintained with 0.5–1.5% isoflurane through a ventilator (Narkomed II, North American Drager, Telford, Pennsylvania, USA). Electrocardiograph leads were attached to the extremities to measure the RR interval. After a right thoracotomy was performed, umbilical tapes were passed around the superior and inferior venae cavae. A Transonic flow probe (model No A16, Transonic Systems, Ithaca, New York, USA) was placed around the ascending aorta. Left ventricular angiography for volume calculation was done in the 60° left anterior oblique and 30° right anterior oblique positions. A conductance catheter with two Millar pressure sensors (model SPC-562, Millar Instruments, Houston, Texas, USA) was inserted into the left ventricle to acquire pressure–volume loops and aortic pressure. All haemodynamic data were recorded digitally at a sample rate of 200 Hz using the “PowerLab” data acquisition system (AD Instruments, Mountain View, California, USA).
Study protocol
Steady state haemodynamics (aortic flow, left ventricular volume, left ventricular pressure, and aortic pressure) were measured during normal sinus rhythm. The umbilical tapes around the superior and inferior venae cavae were temporarily occluded (bicaval occlusion) to obtain pressure–volume loops under various preloads. Atrial fibrillation was induced and maintained by stimulating the right atrium at 60 Hz. The baseline measurement after induction of atrial fibrillation was taken over one minute.
Two drugs, diltiazem and digoxin, were used to change contractility because they are commonly used in the urgent management of tachycardic atrial fibrillation.19,20 In the diltiazem group (n = 4), 0.30 mg/kg of diltiazem was given intravenously for two minutes (time 0). A continuous infusion at a rate of 10 mg/h was then started. The haemodynamics were recorded for 30 seconds at 0, 5, 10, 15, 30, and 60 minutes after the initial 0.30 mg/kg load.
In the digoxin group (n = 4), 0.25 mg of digoxin was given intravenously for two minutes (time 0), with an additional 0.25 mg dose at 30 minutes. The haemodynamics were recorded for 30 seconds at 0, 5, 10, 15, 30, and 60 minutes after the initial 0.25 mg load.
To evaluate contractility in the control group (n = 4), the same surgical protocol was followed, and the haemodynamic measurements were taken at the same intervals without any drug administration. All haemodynamic measurements were acquired while the mechanical ventilator was turned off.
Left ventricular contractility analysis
Data analysis was performed using a custom made visual basic program on Excel software (Excel 97 SR-1, Microsoft Corporation, California, USA). All variables described below were calculated in a beat to beat fashion. Left ventricular volumes—as measured by a conductance catheter—were calibrated to a left ventricular angiograph using a two point calibration based on matching left ventricular end systolic volume and VED in a steady state condition21; these two variables were calculated by the area–length method.22 The dP/dtmax was the first derivative of the left ventricular pressure waveform.
We measured left ventricular contractility with Emax, as described by Yamaguchi and colleagues.13 During atrial fibrillation, Emax was identified as the slope of the line connecting the predetermined V0 of ESPVR and the upper left corner of each pressure–volume loop in a beat to beat fashion. The V0 of ESPVR was determined on the basis of the bicaval occlusion data in normal sinus rhythm using an iterative linear regression method.
Left ventricular power was calculated instantaneously by multiplying left ventricular pressure by aortic flow. PWRmax was determined from the left ventricular power in a beat to beat fashion. Preload-adjusted PWRmax was then calculated by dividing PWRmax by the square of VED in each beat. We simultaneously measured left ventricular volume using a conductance catheter, which enabled us to calculate the preload adjustment by VED in a beat to beat fashion. To validate the substitution of left ventricular pressure by aortic pressure in atrial fibrillation for its non-invasive application, preload-adjusted PWRmax was also calculated from aortic pressure.
Statistical analysis
Preload-adjusted PWRmax was compared with Emax and dP/dtmax in both a linear random effects model and a non-linear random effects model (preload-adjusted PWRmax compared with the square root of Emax and dP/dtmax) in a beat to beat fashion at baseline.23 The 12 sheep were considered the random effect. Additionally, preload-adjusted PWRmax was compared with dP/dtmax using the following more appropriate non-linear model (asymptotic fit):
 |
According to this model, preload-adjusted PWRmax increases from zero at dP/dtmax = ∅3 to ∅1 asymptotically. The parameter O2 controls how rapidly preload-adjusted PWRmax approaches its asymptotic value.
Because these two models (square root and asymptotic fit) cannot be compared using standard p values, the Akaike information criteria (AIC)24 and Bayesian information criteria (BIC)25 were used to compare these two fits. Smaller values of AIC and BIC indicate better/more parsimonious fits.
Because abortive beats limit the usefulness of preload-adjusted PWRmax, beats that had a preload-adjusted PWRmax of less than 0.5 (W/cm2 × 104) were excluded from these analyses.
To evaluate the three contractility indices after drug administration, the values were averaged in each time point of data comparison. Changes in the three indices in the course of one hour were expressed as a percentage of the averages at baseline. Changes after drug administration in each index were compared using analysis of variance (ANOVA). Differences among the three indices were also compared at each data collection point using ANOVA.
The relation between preload-adjusted PWRmax, calculated from left ventricular pressure, and aortic pressure was evaluated in a beat to beat fashion, and the Pearson product moment correlation was used.
The relations of the three contractility indices to RR1 and RR2 were also evaluated in a beat to beat fashion. The Pearson product moment correlation coefficient or a linear random effects model was used to evaluate the correlation relations between the preload-adjusted PWRmax and RR1 or RR2. A non-parametric (permutation) test was used to test the changes in this relation after drug administration.
The preload sensitivity of each index was also checked by its relation to VED. This analysis was done using bicaval occlusion data in normal sinus rhythm and baseline atrial fibrillation data before drug administration. A linear random effects model was used to provide the correlation coefficients in the relations between the three contractility indices and VED in a beat to beat fashion.
All data with a probability value of p < 0.05 were considered significant. The α level was adjusted using Bonferroni's correction whenever multiple comparisons were done. We used SAS (version 8, SAS/STAT Software, SAS Institute, Cary, North Carolina, USA) and S-PLUS software (version 6.0, Mathsoft, Seattle, Washington, USA) to perform the analyses.
RESULTS
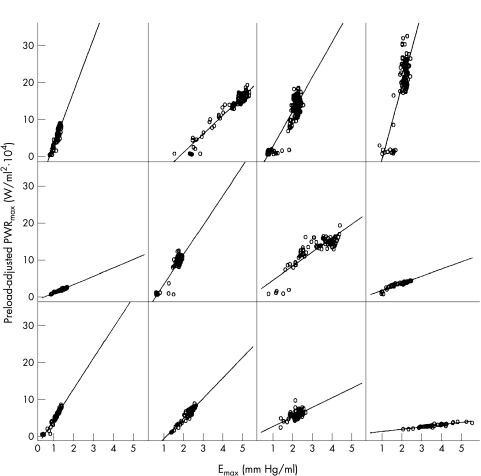
As a result of beat to beat analysis, preload-adjusted PWRmax was shown to correlate with both Emax and dP/dtmax at baseline in all 12 sheep (p < 0.0001). However, the trend of these relations was clearly different for Emax and dP/dtmax. Figure 1 shows the relations between preload-adjusted PWRmax and Emax in each sheep (each data point shows one beat). Linear relations (p < 0.0001) without any curvilinear trends (square root fit, p = 0.71) were observed in all the animals.
Figure 1.
Relations between preload-adjusted PWRmax and Emax at baseline. Baseline, before drug administration; Emax, the slope of end systolic pressure–volume relation; PWRmax, maximal ventricular power.
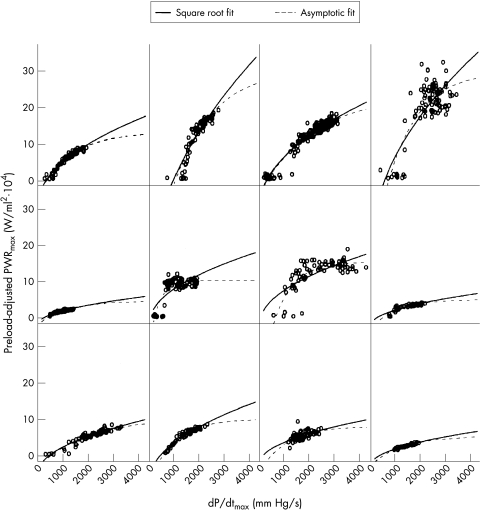
However, in order to obtain a better fit in the relations between preload-adjusted PWRmax and dP/dtmax (fig 2), it was necessary to employ the non-linear model (square root fit, p < 0.0001), which was superior to the linear model (p = 0.07). Furthermore, the asymptotic fit model resulted in a better fit than the square root fit (fig 2) using the AIC (3691.9 v 3815.5) and BIC (3725.1 v 3844.0). These results indicate that once preload-adjusted PWRmax reaches a particular point, it does not change as dP/dtmax changes. In addition, the relation deviated to the larger dP/dtmax side of the linear relation, suggesting that left ventricular contractility was overestimated by dP/dtmax in the higher contractility beats.
Figure 2.
Relations between preload-adjusted PWRmax and dP/dtmax at baseline. Two different random effects models (square root fit and asymptotic fit) were used for this analysis. Baseline, before drug administration; dP/dtmax, maximum rate of change of left ventricular pressure; PWRmax, maximal ventricular power.
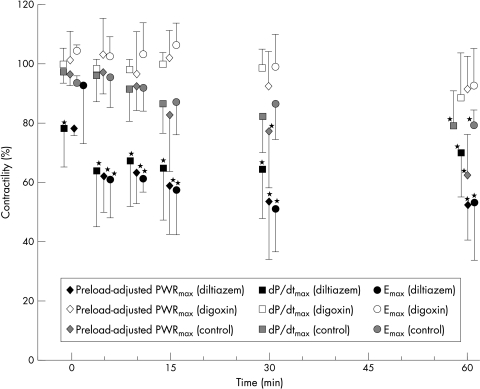
The responses of preload-adjusted PWRmax to the two drugs were similar to those of Emax and dP/dtmax (fig 3). Five minutes after diltiazem was given, the averages of preload-adjusted PWRmax, dP/dtmax, and Emax fell significantly (p < 0.0001) to 62%, 64%, and 61% of baseline, respectively. These decreases were maintained for one hour. These variables did not change much in the digoxin group five minutes after drug administration (103%, 98%, and 102%, respectively) or in the control group (97%, 96%, and 95%), and the values gradually decreased in the course of one hour, reaching significance only in the control group at 60 minutes (p < 0.001).
Figure 3.
Changes in contractility after drug administration. All values are means (with SD) and are expressed as percentages of the values before drug administration. *p < 0.0001 compared with values before drug administration. Emax, the slope of the end systolic pressure–volume relation; dP/dtmax, maximum rate of change of left ventricular pressure; PWRmax, maximal ventricular power.
Per cent changes among the three indices were not significantly different at any of the data collection time points. Although dP/dtmax tended to be higher than the other indices from 10 minutes after diltiazem administration, these changes were not significant.
The relation between preload-adjusted PWRmax calculated from left ventricular pressure and aortic pressure was closely linear in all the animals in a beat to beat fashion. The Pearson product moment correlation coefficient was 0.985 ± 0.011.
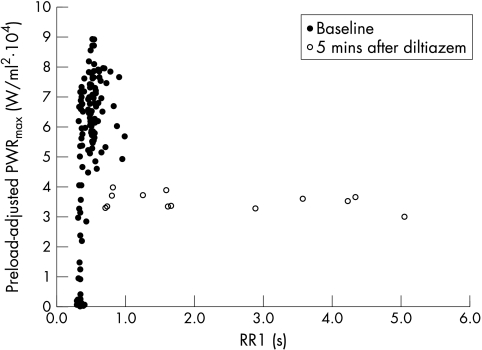
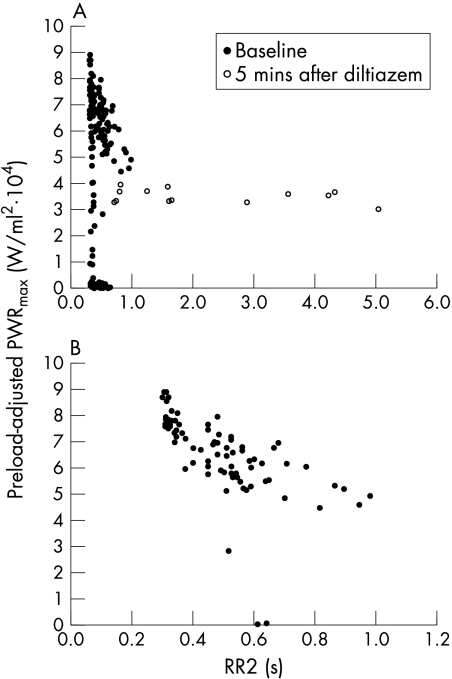
The relation between preload-adjusted PWRmax and RR1 showed a positive correlation (p < 0.0001 by fitting the random effect model). Although this relation changed very little in the digoxin and control groups, it flattened out dramatically in the diltiazem group. The representative change is shown in fig 4. Similar relations with RR1 and similar changes in dP/dtmax and Emax were observed (data not shown). The relation between preload-adjusted PWRmax and RR2 was scattered at baseline (fig 5A). However, after excluding the beats that had an RR1 of less than 350 ms, the weak negative relation (average correlation coefficient = −0.407) appeared (fig 5B). In addition, this relation flattened out after diltiazem administration (fig 5A). Similar phenomena were observed in dP/dtmax and Emax (data not shown). These changes were significant (p < 0.006), suggesting that contractility and its dependence on RR intervals changed in the diltiazem group.
Figure 4.
Representative relation between preload-adjusted PWRmax and RR1 and its change after diltiazem administration. There was a positive trend at baseline, which changed significantly (p < 0.006) after diltiazem administration. Baseline, before diltiazem administration; PWRmax, maximal ventricular power; RR1, preceding RR interval; 5 min after diltiazem, five minutes after the completion of the initial diltiazem load (0.30 mg/kg).
Figure 5.
(A) Representative relation between preload-adjusted PWRmax and RR2 and the change after diltiazem administration. There was no trend in this relation at baseline, which changed significantly (p < 0.006) to flat after diltiazem administration. (B) The same relation at baseline after excluding beats that had an RR1 of less than 350 ms. There was a negative trend after this arrangement. Baseline, before diltiazem administration; PWRmax, maximal ventricular power; RR1, preceding RR interval; RR2, pre-preceding RR interval; 5 min after diltiazem, five minutes after the completion of the initial diltiazem load (0.30 mg/kg).
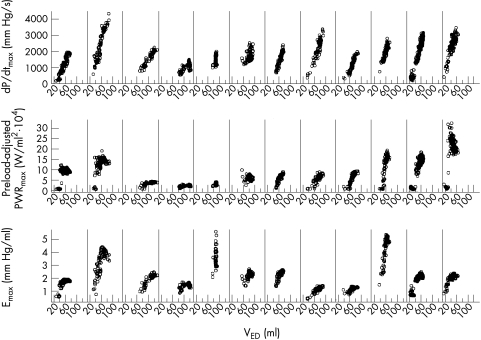
The preload insensitivity of preload-adjusted PWRmax and Emax was shown, in contrast to the preload sensitivity of dP/dtmax with normal sinus rhythm (data not shown). However, during atrial fibrillation, all indices—including the preload-adjusted PWRmax and Emax—were higher with a higher VED (fig 6). A linear random effects model provided the R2 values for dP/dtmax (0.90), Emax (0.90), and preload-adjusted PWRmax (0.81). This indicated that during atrial fibrillation contractility was high when VED was high.
Figure 6.
Relations between VED and dP/dtmax, preload-adjusted PWRmax, and Emax during atrial fibrillation before drug administration in all 12 sheep. Emax, the slope of end systolic pressure–volume relation; dP/dtmax, maximum rate of change of left ventricular pressure; PWRmax, maximal ventricular power; VED, end diastolic left ventricular volume.
DISCUSSION
Our main observation was that, during atrial fibrillation, preload-adjusted PWRmax correlated linearly with the load independent variable (Emax) and curvilinearly with the load dependent variable (dP/dtmax). These results support the use of preload-adjusted PWRmax as a load independent index of left ventricular contractility in atrial fibrillation.
The great advantage of preload-adjusted PWRmax compared with the other two indices is that the method can be used non-invasively.16 Measurement of dP/dtmax usually requires insertion of a Millar catheter into the left ventricle unless enough mitral regurgitation is observed by echocardiography.6 Measuring Emax is more complicated because it requires a conductance catheter system. It may even be impossible to measure because of the need to determine V0 in normal sinus rhythm.13 On the other hand, preload-adjusted PWRmax can be measured using the echocardiographic automated border detection (ABD) method and tonometry.16 Flow can be assessed as the rate of volume change (dV/dt) of the ventricle. The rate of change of left ventricular cross sectional area (dA/dt) obtained by echocardiographic ABD can be substituted for dV/dt so that left ventricular power can be estimated as the product of pressure and dA/dt. In addition, aortic pressure can be substituted for left ventricular pressure, because PWRmax is always identified during systole, which allows the use of non-invasive tonometry for the pressure measurement.26 Because Mandarino and colleagues showed that the (end diastolic area)3/2 substituted the square of VED for the preload adjustment,16 preload-adjusted PWRmax can be estimated only from these non-invasive procedures.
The substitution of left ventricular pressure by aortic pressure in atrial fibrillation was also validated in our data, showing the linear relation between preload-adjusted PWRmax calculated from left ventricular pressure and aortic pressure in 12 sheep. Although the substitution of left ventricular volume by dA/dt still needs to be validated in atrial fibrillation, the evaluation of left ventricular contractility using this non-invasive index may give us important information about how to optimise treatment in patients with acute or chronic atrial fibrillation.17–20
We observed a positive relation with RR1 (mechanical restitution) and a negative relation with RR2 (postextrasystolic potentiation) not only in dP/dtmax and Emax, as reported by other researchers,2–5,10,13 but also in preload-adjusted PWRmax. Although the postextrasystolic potentiation was not clear from the raw data, the relation was better revealed by gating the beats with an RR1 of less than 350 ms. This suggests that it would be difficult to predict the contractility of beats in this RR1 range by RR2, because postextrasystolic potentiation is only incompletely expressed on beats which are not fully restituted, as described by Hardman and colleagues.5 Furthermore, the small mean RR interval in our model (423 ms on average) may have made this relation worse than those in previous reports, for the same reason.
We also found that changes occurred rapidly in the relations between RR1, RR2, and the three contractility indices after diltiazem was given. These changes most probably occurred because both postextrasystolic potentiation and mechanical restitution properties would be expected to have reached saturation in the elongated RR interval situation, as described by Yue and colleagues.27 The effects of these phenomena were minimised when the RR interval range was more than 800 ms, which occurred after diltiazem administration. Most importantly, the changes in preload-adjusted PWRmax, which were similar to the other two contractility indices, were reasonable and support the use of this variable as an index of left ventricular contractility in atrial fibrillation, even after abrupt heart rate changes.
The changes after drug administration and in the control group were similar in all three indices (fig 3). Why did the load dependent variable and load independent variables correlate so well? The normal sinus rhythm data clearly showed the difference between dP/dtmax and other variables (data not shown). However, contractility in atrial fibrillation is regulated by RR1 and RR2,1–5,7–10,13 which also regulate the preload. Consequently, contractility in atrial fibrillation was correlated with preload for each of the indices studied, as shown in fig 6. In preload dependent circumstances such as atrial fibrillation, a load sensitive variable (dP/dtmax) can still express left ventricular contractility in a parallel way. However, dP/dtmax has the potential to overestimate the contractility in beats of high preload (or long RR1). We showed that dP/dtmax correlated curvilinearly rather than linearly with preload-adjusted PWRmax (fig 2) and tended to be higher than the other indices in the diltiazem group (fig 3). These results support the theoretical superiority of preload-adjusted PWRmax over dP/dtmax in the setting of atrial fibrillation.
Study limitations
Because the average heart rate fell significantly after diltiazem administration, the effects of heart rate cannot be neglected in this study. However, as seen in fig 4, the beats of shorter RR intervals five minutes after diltiazem administration showed lower preload-adjusted PWRmax values than those of corresponding intervals at baseline, which supports our contention that preload-adjusted PWRmax can be used to estimate appropriate contractility in spite of the rate changes. Kass and Beyar14 suggested that multiplying preload-adjusted PWRmax by the length of the cardiac cycle (in seconds) can help normalise for pure rate effects. Although we attempted to perform this correction in our data in a beat to beat fashion, the relation between preload-adjusted PWRmax and dP/dtmax or Emax became scattered after this correction (data not shown). The strong regulation of contractility by the RR1 and RR2 intervals may have made this beat to beat correction impracticable in the setting of atrial fibrillation. Further investigation is needed to determine whether this correction is necessary in atrial fibrillation.
Because we did not use autonomic blockade in our study, the effects of the sympathetic and parasympathetic nervous system on measurements of preload-adjusted PWRmax or Emax cannot be eliminated. However, we did not induce autonomic blockade because we wanted the study conditions to correspond closely with those in the clinical setting.
Although preload-adjusted PWRmax was closely related to both Emax and dP/dtmax, it revealed values close to zero when abortive beats occurred. This phenomenon worsened these relations. With abortive beats, preload-adjusted PWRmax falls because aortic flow is close to zero. However, cardiac contractility still exists, as expressed in dP/dtmax or Emax. Mandarino and colleagues voiced similar concerns in the steady state condition,16 stating that severe hypovolaemia or notably raised arterial pressure may make preload-adjusted PWRmax less reliable. Although we excluded the beats that had a preload-adjusted PWRmax of less than 0.5 W/ml2˙ 104 in the analysis in beat to beat fashion, and included all the beats for analysis in averages, the optimum handling of the abortive beats remains to be elucidated.
Finally, complete non-invasive application of preload-adjusted PWRmax using ABD and tonometry needs to be validated in the next stage study.
Conclusions
Preload-adjusted PWRmax correlated linearly with Emax and seems to be a useful measure of contractility in atrial fibrillation. In addition, we believe that this index is a potentially useful non-invasive measure for patients with atrial fibrillation. The application of the method in this setting may yield important information about how to optimise treatment for patients with both acute and chronic atrial fibrillation.
Acknowledgments
MT was supported in part by American Heart Association fellowship award AHA9920575V from the AHA, Ohio Valley Affiliate. TNM was supported in part by AHA 9807701 and NIH HL60833-01 grants. We are grateful to Ms Christine Kassuba for editorial assistance.
Abbreviations
ABD, automated border detection
AIC, Akaike information criteria
BIC, Bayesian information criteria
Emax, slope of ESPVR
ESPVR, end systolic pressure volume relation;
dP/dtmax, maximum rate of change in left ventricular pressure
PWRmax
maximal ventricular power
VED
end diastolic volume
REFERENCES
- 1.Muntinga HJ, Gosselink ATM, Blanksma PK, et al. Left ventricular beat to beat performance in atrial fibrillation: dependence on contractility, preload, and afterload. Heart 1999;82:575–80. [DOI] [PMC free article] [PubMed] [Google Scholar]
- 2.Brookes CIO, White PA, Staples M, et al. Myocardial contractility is not constant during spontaneous atrial fibrillation in patients. Circulation 1998;98:1762–8. [DOI] [PubMed] [Google Scholar]
- 3.Hardman SM, Noble MIM, Biggs T, et al. Evidence for an influence of mechanical restitution on beat-to-beat variations in haemodynamics during chronic atrial fibrillation in patients. Cardiovasc Res 1998;38:82–90. [DOI] [PubMed] [Google Scholar]
- 4.Hardman SM, Noble MIM, Seed WA. Postextrasystolic potentiation and its contribution to the beat-to-beat variation of the pulse during atrial fibrillation. Circulation 1992;86:1223–32. [DOI] [PubMed] [Google Scholar]
- 5.Hardman SM, Pfeiffer KP, Kenner T, et al. Analysis of left ventricular contractile behaviour during atrial fibrillation. Basic Res Cardiol 1994;89:438–55. [DOI] [PubMed] [Google Scholar]
- 6.Bargiggia GS, Bertucci C, Recusani F, et al. A new method for estimating left ventricular dP/dt by continuous wave Doppler-echocardiography. Validation studies at cardiac catheterization. Circulation 1989;80:1287–92. [DOI] [PubMed] [Google Scholar]
- 7.Gibson DG, Broder G, Sowton E. Effect of varying pulse interval in atrial fibrillation on left ventricular function in man. Br Heart J 1971;33:388–93. [DOI] [PMC free article] [PubMed] [Google Scholar]
- 8.Gosselink ATM, Blanksma PK, Crijns HJGM, et al. Left ventricular beat-to-beat performance in atrial fibrillation: contribution of Frank-Starling mechanism after short rather than long RR intervals. J Am Coll Cardiol 1995;26:1516–21. [DOI] [PubMed] [Google Scholar]
- 9.Karliner JS, Gault JH, Bouchard RJ, et al. Factors influencing the ejection fraction and the mean rate of circumferential fibre shortening during atrial fibrillation in man. Cardiovasc Res 1974;8:18–25. [DOI] [PubMed] [Google Scholar]
- 10.Suzuki S, Araki J, Morita T, et al. Ventricular contractility in atrial fibrillation is predictable by mechanical restitution and potentiation. Am J Physiol 1998;275:H1513–19. [DOI] [PubMed] [Google Scholar]
- 11.Suga H, Sagawa K. Instantaneous pressure–volume relationships and their ratio in the excised, supported canine left ventricle. Circ Res 1974;35:117–26. [DOI] [PubMed] [Google Scholar]
- 12.Suga H, Sagawa K, Shoukas AA. Load independence of the instantaneous pressure–volume ratio of the canine left ventricle and effects of epinephrine and heart rate on the ratio. Circ Res 1973;32:314–22. [DOI] [PubMed] [Google Scholar]
- 13.Yamaguchi H, Takaki M, Ito H, et al. Pressure–interval relationship characterizes left ventricular irregular beat contractilities and their mean level during atrial fibrillation. Jpn J Physiol 1997;47:101–10. [DOI] [PubMed] [Google Scholar]
- 14.Kass DA, Beyar R. Evaluation of contractile state by maximal ventricular power divided by the square of end-diastolic volume. Circulation 1991;84:1698–708. [DOI] [PubMed] [Google Scholar]
- 15.Sharir T, Feldman MD, Haber H, et al. Ventricular systolic assessment in patients with dilated cardiomyopathy by preload-adjusted maximal power. Validation and non-invasive application. Circulation 1994;89:2045–53. [DOI] [PubMed] [Google Scholar]
- 16.Mandarino WA, Pinsky MR, Gorcsan J. Assessment of left ventricular contractile state by preload-adjusted maximal power using echocardiographic automated border detection. J Am Coll Cardiol 1998;31:861–8. [DOI] [PubMed] [Google Scholar]
- 17.Blitzer M, Costeas C, Kassotis J, et al. Rhythm management in atrial fibrillation – with a primary emphasis on pharmacological therapy: Part 1. PACE 1998;21:590–602. [DOI] [PubMed] [Google Scholar]
- 18.Prystowsky EN, Benson DW, Fuster V, et al. Management of patients with atrial fibrillation. A statement for healthcare professionals. From the subcommittee on electrocardiography and electrophysiology, American Heart Association. Circulation 1996;93:1262–77. [DOI] [PubMed] [Google Scholar]
- 19.Schreck DM, Rivera AR, Tricarico VJ. Emergency management of atrial fibrillation and flutter: intravenous diltiazem versus intravenous digoxin. Ann Emerg Med 1997;29:135–40. [DOI] [PubMed] [Google Scholar]
- 20.Tisdale JE, Padhi ID, Goldberg AD, et al. A randomized, double-blind comparison of intravenous diltiazem and digoxin for atrial fibrillation after coronary artery bypass surgery. Am Heart J 1998;135:739–47. [DOI] [PubMed] [Google Scholar]
- 21.Kass DA, Wolff MR, Ting CT, et al. Diastolic compliance of hypertrophied ventricle is not acutely altered by pharmacologic agents influencing active processes. Ann Intern Med 1993;119:466–73. [DOI] [PubMed] [Google Scholar]
- 22.Wynne J, Green LH, Mann T, et al. Estimation of left ventricular volumes in man from biplane cineangiograms filmed in oblique projections. Am J Cardiol 1978;41:726–32. [DOI] [PubMed] [Google Scholar]
- 23.Pinheiro JC, Bates DM. Mixed-effects models in S and S-PLUS. New York: Springer Verlag, 2000.
- 24.Akaike H. A new look at the statistical model identification. IEEE Trans Automatic Control 1974;19:716–23. [Google Scholar]
- 25.Schwarz G. Estimating the dimension of a model. Ann Stat 1978;6:461–4. [Google Scholar]
- 26.Kelly R, Hayward C, Avolio A, et al. Noninvasive determination of age-related changes in the human arterial pulse. Circulation 1989;80:1652–9. [DOI] [PubMed] [Google Scholar]
- 27.Yue DT, Burkhoff D, Franz MR, et al. Postextrasystolic potentiation of the isolated canine left ventricle. Relationship to mechanical restitution. Circ Res 1985;56:340–50. [DOI] [PubMed] [Google Scholar]


