Abstract
Objective: To analyse trends in mortality from coronary heart disease (CHD) and cerebrovascular disease (CVD) over the period 1965 to 1998 in the European Union, other European countries, the USA, and Japan.
Methods and results: Data were derived from the World Health Organization database. In the European Union, CHD mortality in men rose from 146/100 000 in 1965–9 to 163/100 000 in 1975–9 and declined thereafter to 99/100 000 in 1995–8 (−39%). In women, the fall was from 70 to 45/100 000 (−36%). A > 55% decline in CVD was registered in both sexes. In eastern Europe, mortality from both CHD and CVD rose up to the early 1990s but has declined over the past few years in Poland and the Czech Republic. In the Russian Federation during 1995–8, mortality rates from CHD reached 330/100 000 men and 154/100 000 women and mortality rates from CVD were 203/100 000 men and 150/100 000 women—that is, they were among the highest rates worldwide. In the USA and Japan, long term trends were favourable for both CHD and CVD.
Conclusions: Trends in mortality from CHD and CVD were favourable in several developed areas of the world, but there were major geographical differences. In a few eastern European countries, mortality from CHD and CVD remains exceedingly high.
Keywords: cerebrovascular diseases, coronary heart diseases, mortality, trends
Mortality from coronary heart disease (CHD) has been declining in the USA and in Japan since the early 1970s and in western Europe since the mid- to late 1970s. However, trends were upwards in eastern Europe up to the late 1980s or early 1990s.1–6 Mortality from cerebrovascular disease (CVD) has been steadily declining in several areas of the world but not in a few eastern European countries, which reached some of the highest rates worldwide in the early 1990s.4–8
We reviewed trends in mortality for CHD and CVD in Europe and other major areas of the world providing data to the World Health Organization (WHO) database up to 1989.4 There are various reasons for updating such work, including the changed political boundaries within Europe, with the consequent definition of new national entities (such as the Russian Federation, the Czech Republic, Slovakia, and Slovenia), and the availability of data for a few other countries. This work, moreover, may have relevant implications for analytical epidemiology, since substantial changes in the standard of life and several risk factor exposures have been observed over recent years, mostly in a few former non-market economy countries of central and eastern Europe.8–16 These changes had major and dramatic implications for changing total mortality, as well as CHD and CVD mortality, over a short period of time, constituting a sort of wide scale, population based epidemiological experiment.
In the present paper, therefore, we update to 1998 trends in mortality from CHD and CVD in European countries, the European Union as a whole, the USA, Japan, Australia, and 12 other relevant countries providing data from the Americas and Asia.
MATERIALS AND METHODS
Europe
Official death certification numbers for 34 European countries (including the Russian Federation, but excluding a few small countries such as Andorra and Liechtenstein, and Albania) were derived from the WHO database available electronically. For new recent political entities such as Belarus, Croatia, the Czech Republic, Estonia, Latvia, Lithuania, the Russian Federation, Slovenia, and Ukraine, data were available only since 1985; for Slovakia, data were partially available only for the most recent calendar period considered—that is, 1995–97.
Americas
The WHO database contains some data on mortality and population for 49 countries and territories in the Americas. After exclusion of all countries with < 2 000 000 population, only those with age stratified mortality and population figures of sufficient detail were retained, comprising, besides Canada and the USA, Argentina, Chile, Costa Rica, Cuba, and Mexico.
Asia
Four countries provided cardiovascular disease mortality from Asia: Hong Kong (not an independent country but a self governing commonwealth), Israel, Japan, and Singapore.
Africa
Data were available only for Mauritius.
Australia and Oceania
Data were available only for Australia and New Zealand. During the calendar period considered (1965 to 1998), three revisions of the International classification of diseases (that is, ICD eighth to 10th revisions) were used. Classification of deaths was thus recoded, for all calendar periods and countries, according to the ninth revision of the ICD. To minimise problems of classification changes and data comparability over time, for the purpose of the present analyses all CVD classifications as a group of the eighth and ninth revisions (ICD codes 430–438) were combined with those of the 10th revision (ICD codes I60–I69). Thus, only data registered after 1968 (that is, using the eighth to the 10th revisions) were considered. Codes 410–414 from the eighth and ninth and codes I20–I25 from the 10th revision were pooled together in a category of “all coronary heart diseases”.
Estimates of the resident population, generally based on official censuses, were obtained from the same WHO databank. From the matrices of certified deaths and resident populations, age specific rates for each five year age group and calendar period were computed. Age standardised rates at all ages were based on the world standard population.
For Chile, the most recent calendar period available was 1990–92. In a few countries, data were missing for the last (1995–98) calendar period considered, as indicated in parentheses beside the legend of the concerned country in tables 1 and 2. In particular, data for 1995 were available for Belgium, Costa Rica, and Mexico; data for 1995–96 were available for Denmark, Finland, Iceland, Ireland, Poland, Sweden, Switzerland, Argentina, Cuba, Hong Kong, and Israel; and data for 1995–97 were available for Armenia, France, Italy, Luxembourg, the Netherlands, Norway, Slovakia, Spain, Canada, the USA, Japan, and Australia.
Table 1.
Trends in age standardised (world population) death certification rates for coronary heart diseases in Europe and other selected areas of the world, 1965–1998*
| Men | Women | |||||||||
| Country | 1965–9 | 1975–9 | 1985–9 | 1995–8* | % Change 1995–8 v 1965–9 | 1965–9 | 1975–9 | 1985–9 | 1995–8* | % Change 1995–8 v 1965–9 |
| Europe | ||||||||||
| Armenia (1995–7) | 255.3 | 265.9 | 167.7 | 170.4 | ||||||
| Austria | 169.0 | 191.2 | 143.9 | 126.6 | −25.1 | 88.4 | 98.7 | 62.0 | 60.4 | −31.7 |
| Belarus | 325.3 | 381.2 | 189.6 | 194.2 | ||||||
| Belgium (1995) | 155.0 | 143.2 | 97.4 | 79.8 | −37.2 | 63.6 | 56.9 | 40.4 | 33.2 | −36.5 |
| Bulgaria | 132.5 | 182.0 | 177.9 | 187.4 | 41.4 | 104.5 | 124.9 | 104.9 | 101.6 | −2.8 |
| Croatia | 90.7 | 163.3 | 33.3 | 87.1 | ||||||
| Czech Republic | 265.8 | 190.0 | 127.6 | 94.9 | ||||||
| Denmark (1995–6) | 237.0 | 244.4 | 199.7 | 129.6 | −45.3 | 121.9 | 111.7 | 90.6 | 62.0 | −49.1 |
| Estonia | 380.7 | 322.0 | 205.8 | 157.8 | ||||||
| Finland (1995–6) | 325.9 | 304.7 | 248.3 | 182.1 | −44.1 | 125.4 | 108.8 | 97.9 | 75.8 | −39.6 |
| France (1995–7) | 70.2 | 75.6 | 66.3 | 49.1 | −30.1 | 27.9 | 29.4 | 25.9 | 18.2 | −34.8 |
| Germany | 152.7 | 165.2 | 148.2 | 125.8 | −17.6 | 60.7 | 70.5 | 63.2 | 59.6 | −1.8 |
| Greece | 64.8 | 84.1 | 86.5 | 82.9 | 27.9 | 28.6 | 34.4 | 33.7 | 33.1 | 15.7 |
| Hungary | 188.6 | 204.6 | 215.2 | 220.9 | 17.1 | 112.8 | 109.4 | 100.9 | 111.7 | −1.0 |
| Iceland (1995–6) | 217.4 | 199.3 | 176.2 | 131.5 | −39.5 | 85.5 | 84.3 | 74.6 | 53.1 | −37.9 |
| Ireland (1995–6) | 234.7 | 261.3 | 238.2 | 185.2 | −21.1 | 117.8 | 121.8 | 104.7 | 82.1 | −30.3 |
| Italy (1995–7) | 123.4 | 130.2 | 91.5 | 74.0 | −40.0 | 65.2 | 64.7 | 38.3 | 32.8 | −49.7 |
| Latvia | 350.7 | 340.1 | 183.9 | 151.3 | ||||||
| Lithuania | 335.7 | 288.9 | 199.7 | 157.0 | ||||||
| Luxembourg (1995–7) | 136.0 | 138.1 | 130.5 | 92.3 | −32.1 | 44.5 | 47.9 | 51.5 | 32.9 | −26.1 |
| Malta | 162.4 | 238.1 | 183.4 | 139.7 | −14.0 | 84.1 | 140.1 | 101.4 | 80.9 | −3.8 |
| Netherlands (1995–7) | 179.1 | 182.3 | 142.9 | 97.6 | −45.5 | 77.3 | 72.5 | 54.8 | 40.7 | −47.3 |
| Norway (1995–7) | 218.6 | 202.3 | 190.3 | 128.2 | −41.4 | 93.4 | 77.6 | 70.4 | 50.6 | −45.8 |
| Poland (1995–6) | 64.7 | 109.8 | 127.5 | 113.7 | 75.7 | 21.6 | 38.9 | 38.3 | 38.9 | 80.1 |
| Portugal | 89.7 | 90.1 | 73.0 | 65.1 | −27.4 | 46.6 | 43.0 | 33.3 | 30.8 | −33.9 |
| Romania | 74.4 | 93.7 | 146.6 | 198.6 | 166.9 | 49.8 | 61.8 | 98.4 | 118.9 | 138.8 |
| Russian Federation | 304.0 | 330.2 | 162.9 | 154.2 | ||||||
| Slovakia (1995–7) | 235.5 | 125.9 | ||||||||
| Slovenia | 99.3 | 101.1 | 40.1 | 48.2 | ||||||
| Spain (1995–7) | 50.9 | 81.0 | 70.6 | 65.5 | 28.7 | 23.3 | 35.4 | 28.2 | 26.5 | 13.7 |
| Sweden (1995–6) | 221.3 | 247.2 | 193.7 | 134.4 | −39.3 | 115.7 | 113.8 | 80.0 | 56.8 | −50.9 |
| Switzerland (1995–6) | 108.2 | 116.1 | 105.0 | 90.7 | −16.2 | 41.9 | 42.5 | 40.2 | 43.3 | 3.3 |
| Ukraine | 316.6 | 393.8 | 196.7 | 223.2 | ||||||
| UK | 255.0 | 258.7 | 218.4 | 150.4 | −41.0 | 108.3 | 107.8 | 95.2 | 67.3 | −37.9 |
| European Union (1995–7) | 146.2 | 158.9 | 129.8 | 99.6 | −31.9 | 63.8 | 68.5 | 54.4 | 44.6 | −30.1 |
| Americas | ||||||||||
| Argentina (1995–6) | 176.3 | 136.4 | 89.5 | 68.2 | −61.3 | 88.9 | 70.1 | 40.5 | 27.1 | −69.5 |
| Canada (1995–7) | 271.4 | 238.2 | 161.0 | 109.4 | −59.7 | 130.7 | 108.2 | 75.1 | 54.2 | −58.5 |
| Chile (1990–2) | 112.7 | 93.3 | 87.4 | 79.0 | −29.9 | 75.1 | 54.9 | 50.9 | 46.9 | −37.5 |
| Costa Rica (1995) | 95.4 | 89.7 | 123.3 | 100.4 | 5.2 | 67.3 | 54.4 | 70.8 | 61.6 | −8.5 |
| Cuba (1995–6) | 177.9 | 159.0 | 151.5 | 137.2 | −22.9 | 127.1 | 122.4 | 110.2 | 97.1 | −23.6 |
| Mexico (1995) | 43.8 | 47.1 | 61.7 | 76.6 | 74.9 | 29.7 | 30.1 | 36.9 | 50.5 | 70.0 |
| USA (1995–7) | 330.5 | 257.0 | 162.4 | 121.2 | −63.3 | 166.0 | 124.0 | 84.9 | 67.1 | −59.6 |
| Africa, Asia, Australia, and Oceania | ||||||||||
| Hong Kong (1995–6) | 38.6 | 61.4 | 55.5 | 47.6 | 23.3 | 16.2 | 32.4 | 31.5 | 26.6 | 64.2 |
| Israel (1995–6) | 207.7 | 142.8 | 102.9 | 133.0 | 83.3 | 60.1 | ||||
| Japan (1995–7) | 50.1 | 44.3 | 32.6 | 35.7 | −28.7 | 27.5 | 25.3 | 17.8 | 17.5 | −36.4 |
| Mauritius | 92.5 | 164.9 | 185.8 | 196.6 | 112.5 | 39.8 | 65.2 | 93.1 | 111.5 | 180.2 |
| Singapore | 115.8 | 156.2 | 151.1 | 122.3 | 5.6 | 49.5 | 76.8 | 86.4 | 72.9 | 47.3 |
| Australia (1995–7) | 325.1 | 259.8 | 180.4 | 117.1 | −64.0 | 149.2 | 118.7 | 87.2 | 58.7 | −60.7 |
| New Zealand | 300.3 | 269.3 | 211.5 | 141.4 | −52.9 | 131.5 | 118.8 | 97.8 | 64.6 | −50.9 |
*Most recent period available is 1995–8 unless otherwise mentioned in parentheses.
Table 2.
Trends in age standardised (world population) death certification rates for cerebrovascular disease in Europe and other selected areas of the world, 1965–98*
| Men | Women | |||||||||
| Country | 1965–9 | 1975–9 | 1985–9 | 1995–8* | % Change 1995–8 v 1965–9 | 1965–9 | 1975–9 | 1985–9 | 1995–8* | % Change 1995–8 v 1965–9 |
| Europe | ||||||||||
| Armenia (1995–7) | 89.6 | 87.4 | 84.8 | 84.2 | ||||||
| Austria | 113.4 | 103.0 | 81.0 | 51.5 | −54.6 | 91.0 | 80.6 | 62.1 | 40.5 | −55.5 |
| Belarus | 110.2 | 136.7 | 88.7 | 95.6 | ||||||
| Belgium (1995) | 93.6 | 81.0 | 50.6 | 39.7 | −45.9 | 74.7 | 65.0 | 41.3 | 31.1 | −44.7 |
| Bulgaria | 132.8 | 158.0 | 160.6 | 154.4 | 16.3 | 137.8 | 142.1 | 127.2 | 112.7 | −18.2 |
| Croatia | 124.0 | 128.5 | 94.5 | 94.7 | ||||||
| Czech Republic | 146.5 | 92.3 | 110.1 | 69.5 | ||||||
| Denmark (1995–6) | 70.6 | 54.4 | 46.3 | 45.5 | −35.6 | 61.5 | 42.5 | 37.3 | 34.6 | −43.7 |
| Estonia | 149.0 | 129.6 | 118.7 | 94.3 | ||||||
| Finland (1995–6) | 127.1 | 86.5 | 69.3 | 55.1 | −56.6 | 115.1 | 67.4 | 54.9 | 43.0 | −62.6 |
| France (1995–7) | 94.6 | 76.7 | 48.8 | 31.3 | −66.9 | 64.1 | 52.1 | 33.3 | 21.2 | −66.9 |
| Germany | 117.3 | 83.4 | 63.1 | 48.7 | −58.5 | 96.2 | 65.6 | 48.8 | 36.9 | −61.6 |
| Greece | 76.4 | 82.2 | 79.0 | 65.9 | −13.7 | 81.1 | 84.2 | 80.4 | 64.3 | −20.7 |
| Hungary | 120.7 | 126.3 | 133.6 | 118.7 | −1.7 | 104.0 | 98.9 | 95.2 | 78.7 | −24.3 |
| Iceland (1995–6) | 76.2 | 51.0 | 40.6 | 41.7 | −45.3 | 65.6 | 41.1 | 37.0 | 34.8 | −47.0 |
| Ireland (1995–6) | 95.1 | 91.2 | 61.2 | 46.5 | −51.1 | 96.4 | 85.7 | 55.0 | 40.6 | −57.9 |
| Italy (1995–7) | 105.6 | 89.1 | 70.4 | 46.3 | −56.2 | 80.2 | 67.5 | 53.2 | 36.4 | −54.6 |
| Latvia | 163.0 | 166.6 | 133.4 | 122.6 | ||||||
| Lithuania | 82.7 | 81.5 | 69.7 | 68.5 | ||||||
| Luxembourg (1995–7) | 84.6 | 91.5 | 97.8 | 53.5 | −36.8 | 64.7 | 70.3 | 72.5 | 39.9 | −38.3 |
| Malta | 131.3 | 116.6 | 71.8 | 48.2 | 120.5 | 109.2 | 60.7 | 41.8 | ||
| Netherlands (1995–7) | 71.2 | 59.0 | 44.9 | 38.6 | −45.8 | 65.7 | 48.7 | 35.6 | 31.6 | −51.9 |
| Norway (1995–7) | 91.0 | 69.8 | 55.1 | 45.2 | −50.3 | 80.4 | 59.8 | 35.5 | 34.7 | −56.8 |
| Poland (1995–6) | 33.3 | 51.9 | 54.2 | 58.3 | 75.1 | 30.4 | 43.4 | 41.7 | 42.9 | 41.1 |
| Portugal | 164.6 | 198.7 | 150.6 | 117.7 | −28.5 | 130.3 | 144.4 | 111.6 | 88.7 | −31.9 |
| Romania | 103.0 | 111.4 | 124.5 | 167.6 | 62.7 | 105.2 | 105.5 | 111.9 | 130.4 | 24.0 |
| Russian Federation | 180.9 | 203.5 | 139.0 | 150.5 | ||||||
| Slovakia (1995–7) | 72.0 | 51.1 | ||||||||
| Slovenia | 96.4 | 74.3 | 68.0 | 50.1 | ||||||
| Spain (1995–7) | 99.5 | 99.5 | 64.8 | 43.7 | −56.1 | 86.3 | 83.1 | 53.4 | 34.0 | −60.6 |
| Sweden (1995–6) | 63.9 | 54.7 | 45.5 | 39.5 | −38.2 | 59.7 | 46.7 | 36.5 | 30.9 | −48.2 |
| Switzerland (1995–6) | 79.8 | 63.7 | 40.7 | 28.7 | −64.0 | 67.7 | 49.1 | 30.9 | 24.7 | −63.5 |
| Ukraine | 138.6 | 152.9 | 110.1 | 112.7 | ||||||
| UK | 102.3 | 81.8 | 61.2 | 44.0 | −57.0 | 87.9 | 71.4 | 53.9 | 38.7 | −56.0 |
| European Union (1995–7) | 102.5 | 86.9 | 63.2 | 46.0 | −55.1 | 83.1 | 68.7 | 49.6 | 36.0 | −56.7 |
| Americas | ||||||||||
| Argentina (1995–6) | 87.6 | 80.9 | 74.8 | 62.1 | −29.1 | 67.9 | 61.8 | 54.0 | 40.7 | −40.1 |
| Canada (1995–7) | 66.5 | 53.7 | 33.4 | 27.8 | −58.2 | 59.3 | 44.5 | 29.4 | 24.3 | −59.0 |
| Chile (1990–2) | 93.1 | 78.5 | 70.5 | 66.1 | −29.0 | 86.4 | 69.0 | 55.1 | 49.4 | −42.8 |
| Costa Rica (1995) | 57.2 | 47.6 | 51.0 | 38.8 | −32.2 | 54.3 | 45.2 | 43.3 | 35.3 | −35.0 |
| Cuba (1995–6) | 91.1 | 56.7 | 56.1 | 51.5 | −43.5 | 89.5 | 57.9 | 52.6 | 50.4 | −43.7 |
| Mexico (1995) | 41.3 | 38.3 | 40.4 | 38.9 | −5.8 | 45.0 | 39.8 | 37.9 | 36.3 | −19.3 |
| USA (1995–7) | 77.7 | 54.1 | 33.6 | 29.3 | −62.3 | 66.8 | 46.2 | 30.9 | 27.5 | −58.8 |
| Africa, Asia, Australia, and Oceania | ||||||||||
| Hong Kong (1995–6) | 100.6 | 83.1 | 55.9 | 40.1 | −60.1 | 67.0 | 61.3 | 43.5 | 32.0 | −52.2 |
| Israel (1995–6) | 75.5 | 46.5 | 43.8 | 79.9 | 45.0 | 35.7 | ||||
| Japan (1995–7) | 228.2 | 153.1 | 75.0 | 60.5 | −73.5 | 150.2 | 104.4 | 52.8 | 38.4 | −74.4 |
| Mauritius | 105.1 | 160.5 | 138.0 | 137.1 | 30.4 | 71.9 | 85.6 | 91.1 | 88.4 | 22.9 |
| Singapore | 92.1 | 106.6 | 72.3 | 55.4 | −39.8 | 74.1 | 95.7 | 66.7 | 48.6 | −34.4 |
| Australia (1995–7) | 102.0 | 81.2 | 50.1 | 35.7 | −65.0 | 94.9 | 74.3 | 44.6 | 31.0 | −67.3 |
| New Zealand | 87.7 | 78.0 | 53.3 | 37.0 | −57.8 | 88.8 | 75.9 | 49.4 | 35.7 | −59.8 |
*Most recent period available is 1995–8, unless otherwise mentioned in parentheses.
RESULTS
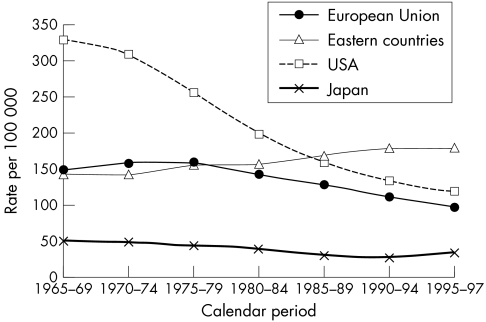
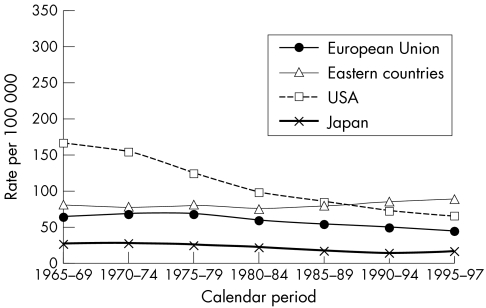
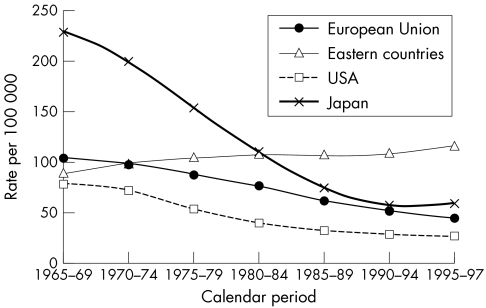
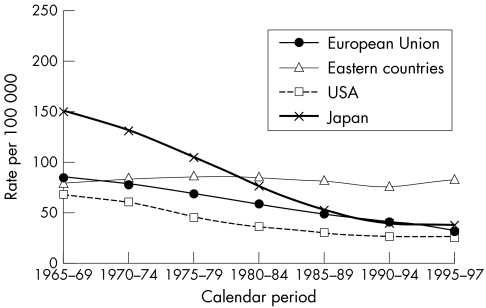
Figures 1, 2, 3, and 4 show trends in mortality from CHD and CVD in men and women in the European Union (Austria, Belgium, Denmark, Finland, France, Germany, Greece, Ireland, Italy, Luxembourg, the Netherlands, Portugal, Spain, Sweden, and the UK), selected eastern European countries providing long term data (Bulgaria, Czech Republic, Hungary, Poland, Romania, and Slovakia), the USA, and Japan.
Figure 1.
Trends in age standardised (world population) death certification rates from coronary heart diseases in men in all age groups from the European Union, eastern European countries (Bulgaria, Czech Republic, Hungary, Poland, Romania, and Slovakia), the USA, and Japan, 1965 to 1997.
Figure 2.
Trends in age standardised (world population) death certification rates from coronary heart diseases in women in all age groups from the European Union, eastern European countries (Bulgaria, Czech Republic, Hungary, Poland, Romania, and Slovakia), the USA, and Japan, 1965 to 1997.
Figure 3.
Trends in age standardised (world population) death certification rates from cerebrovascular diseases in men in all age groups from the European Union, eastern European countries (Bulgaria, Czech Republic, Hungary, Poland, Romania, and Slovakia), the USA, and Japan, 1965 to 1997.
Figure 4.
Trends in age standardised (world population) death certification rates from cerebrovascular diseases in women in all age groups from the European Union, eastern European countries (Bulgaria, Czech Republic, Hungary, Poland, Romania, and Slovakia), the USA, and Japan, 1965 to 1997.
In the European Union as a whole, age standardised mortality from CHD rose from 146.2/100 000 in 1965–69 to 158.9/100 000 in 1975–79 but declined thereafter, mostly after the mid 1980s, to reach 99.6/100 000 in 1995–97 (−37% from the peak of the late 1970s). In women, the pattern was similar, with a peak at 68.5 in 1975–79 and a subsequent decline to 44.6 (−35%) in 1995–97. Mortality from CVD declined steadily, from 102.5/100 000 men in 1965–69 to 46.0 (−55%) and from 83.1/100 000 women in 1965–69 to 36.0 (−57%) in 1995–97. Trends were favourable in the USA and Japan. Overall age standardised rates in the USA were 121.2/100 000 men and 67.1/100 000 women in 1995–97 for CHD and 29.3/100 000 and 27.5/100 000, respectively for CVD. The latter were among the lowest rates registered worldwide. In Japan, rates for CHD were low in the late 1960s (50.1/100 000 men and 27.5/100 000 women) but tended to decline further, at least until mid 1990s, to 35.7/100 000 men and 17.5/100 000 women in 1995–97. The decrease was substantial for CVD in Japan and—starting from high rates of over 190/100 000 men and 125/100 000 women in the late 1960s—declined in 1995–97 to 60.5/100 000 men and 38.4/100 000 women. In contrast, mortality tended to rise for both CHD and CVD in eastern Europe, to reach the highest rates in the two sexes and for both groups of diseases in the late 1990s.
Trends in separate countries are given in tabular form in tables 1 and 2 for CHD and CVD, respectively. The pattern of trends was similar in most western European countries, independently of the initial absolute value of mortality, with the exception of Finland and the UK, which had exceedingly high rates for cardiovascular diseases in the late 1960s, and whose decline started somewhat earlier. The fall in mortality for CHD was comparatively and appreciably later and smaller for Germany, possibly on account of merging with the former East Germany.
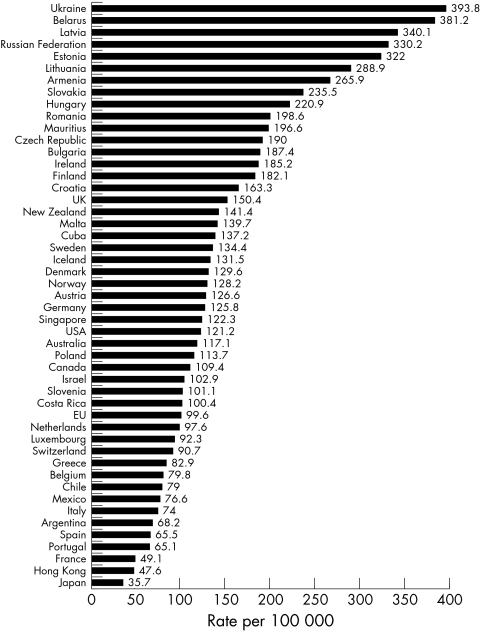
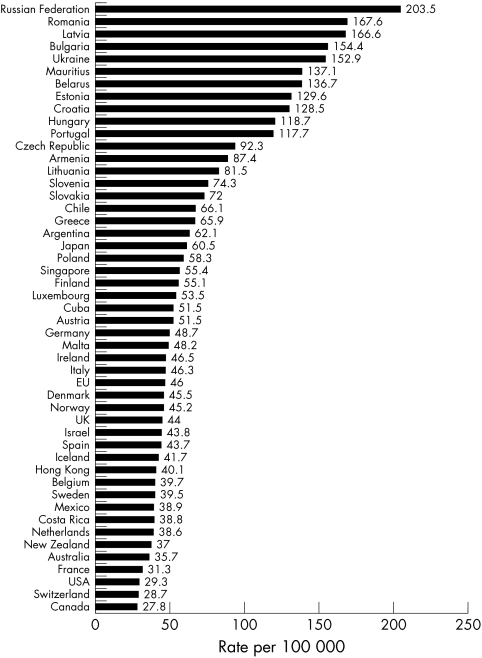
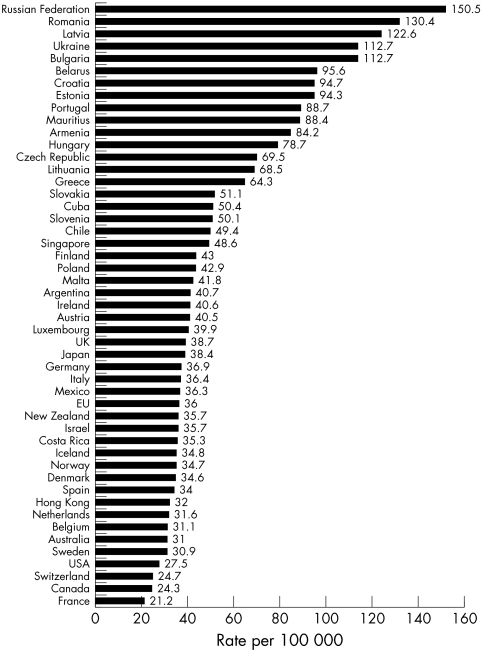
In most of eastern Europe, in contrast, mortality for both CHD and CVD tended to increase up to the most recent calendar period, with the exception of Hungary, whose rates levelled off at very high rates in the mid 1990s, and especially Poland and the Czech Republic, whose rates have tended to decline appreciably since the mid 1990s. In the Russian Federation during 1995–98 mortality rates from CHD reached 330.2/100 000 men and 154.2/100 000 women—that is, they were higher than those of Finland in the late 1960s. Likewise, the Russian rates of 203.5/100 000 men and 150.5/100 000 women for CVD were among the highest registered worldwide.
In the USA, as well as in most other countries in the Americas that provided data, mortality from both CHD and CVD declined steadily, except in Mexico and Costa Rica for CHD, whose rates, however, were low in the late 1960s. Likewise, substantial declines in both CHD and CVD mortality were registered in Australia and New Zealand, of a magnitude comparable with those observed in the USA.
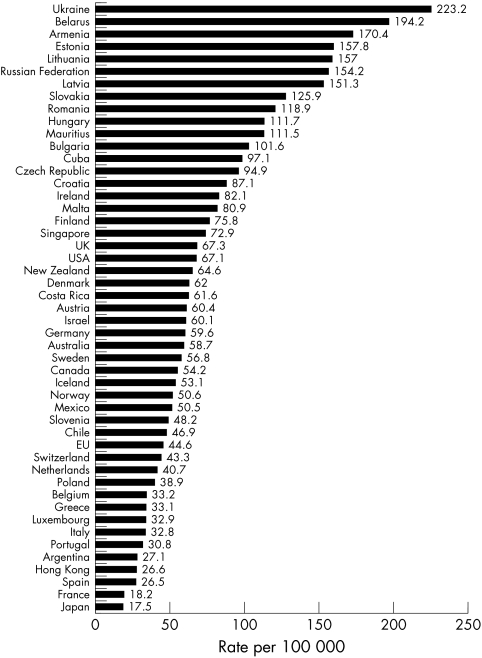
Figures 5, 6, 7, and 8 show the histograms of CHD and CVD in 49 countries or groups of countries over the most recent (1995–98) available calendar period. For both diseases, the rates were highest in eastern European countries or in the Russian Federation and there was an approximately 10-fold difference between the highest and the lowest mortality areas.
Figure 5.
Age standardised (world standard) death certification rates from coronary heart diseases in men in 48 countries and the European Union (EU), 1995–98.
Figure 6.
Age standardised (world standard) death certification rates from coronary heart diseases in women in 48 countries and the European Union (EU), 1995–98.
Figure 7.
Age standardised (world standard) death certification rates from cerebrovascular diseases in men in 48 countries and the European Union (EU), 1995–98.
Figure 8.
Age standardised (world standard) death certification rates from cerebrovascular diseases in women in 48 countries and the European Union (EU), 1995–98.
DISCUSSION
This systematic and essentially descriptive overview of trends in mortality from CHD and CVD in Europe and other selected areas of the world over the past three decades shows and further quantifies the steady and substantial decline in mortality from CVD in western Europe, the Americas, and Japan. It shows a decrease in CHD mortality since the late 1970s in most western European countries and since the early 1970s in North America. Mortality from CHD tended to decline in Japan as well, though starting from a comparatively low absolute level.17
Although major geographical differences in mortality persisted within western Europe (that is, between 185/100 000 men in Ireland and 49/100 000 in France for CHD and between 118/100 000 men in Portugal and 31/100 000 in France for CVD) and the decreases were greater in some (Finland or the Netherlands) than in other countries (Germany, Ireland, or Portugal), the declines were steady and substantial in various countries and geographical areas. The declines started later in some countries, such as Denmark18 and particularly in Germany following reunification with the former East Germany.
It is unlikely that these patterns of trends were influenced appreciably by changes in diagnosis and certification of such broad groups of diseases as CHD or CVD, at least after 1968—that is, after the introduction of the eighth revision of the ICD in most countries.
The factors underlying these favourable trends in mortality from CHD and CVD are variable and include favourable changes in risk factor exposure, such as decreased smoking among men, improvements in diet (but not overweight) and physical exercise, better control of hypertension, and advances in treatment.9,19–23 More widespread and improved control of hypertension has played a major part in reducing CHD and especially CVD mortality.24–28 This line of reasoning may also explain the favourable trends observed in the USA, other countries in the Americas, Australia, and Japan, whose rates from CHD (but not CVD) had been traditionally and substantially lower than in most other areas of the world.29,30 Improvements in treatment and management of patients with CHD may also account for a substantial proportion of the favourable trends.31
Trends were, however, appreciably variable and largely unfavourable14–16 for the eastern European countries whose data were available. In fact, mortality rates increased for both CHD and CVD in most eastern European countries up to the mid-1990s, mostly for men, but an appreciable reversal of trends was observed for Poland and the Czech Republic since the mid 1990s. This is unlikely to be a result of changes in diagnosis and certification and has been explained more in terms of improved food availability (that is, type of diet, including fat composition, fresh fruit, and vegetables) than of smoking, drinking, stress, other risk factors for ischaemic heart disease, or changed medical care.16 A similar sharp decline in mortality from both CHD and CVD was observed in the Czech Republic over the past few years, likely reflecting favourable changes in diet, smoking, cholesterol concentrations, blood pressure, and exposure to other risk factors.14
Other eastern European countries, including Bulgaria, Croatia, Romania, and especially the Russian Federation, had persisting upward trends in mortality from both CHD and CVD. Russian CHD mortality rates in the late 1990s were higher than those of Finland, the USA, or Australia three decades earlier; those from CVD were also substantially higher. This underlines the importance and urgency of integrated intervention for prevention and control of CHD and CVD in those countries.
Acknowledgments
This study has been made possible by a core grant of the Swiss League Against Cancer. Support was also received from the Italian Association for Cancer Research.
Abbreviations
CHD, coronary heart disease
CVD, cerebrovascular disease
ICD, International classification of diseases
WHO, World Health Organization
REFERENCES
- 1.Uemura K, Pisa Z. Trends in cardiovascular disease mortality in industrialized countries since 1950. World Health Stat Q 1988;41:155–78. [PubMed] [Google Scholar]
- 2.Ragland KE, Selvin S, Merrill DW. The onset of decline in ischemic heart disease mortality in the United States. Am J Epidemiol 1988;127: 516–31. [DOI] [PubMed] [Google Scholar]
- 3.Beaglehole R. International trends in coronary heart disease mortality, morbidity, and risk factors. Epidemiol Rev 1990;12:1–15. [DOI] [PubMed] [Google Scholar]
- 4.La Vecchia C, Levi F, Lucchini F, et al. Trends in mortality from cardiovascular and cerebrovascular disease. Soz Präventivmed 1993;38(suppl 1):S3–71. [Google Scholar]
- 5.Murray CJL, Lopez AD, eds. The global burden of disease: a comprehensive assessment of mortality and disability from diseases, injuries, and risk factors in 1990 and projected to 2000. Cambridge: Harvard University Press, 1996.
- 6.Murray CJL, Lopez AD. Mortality by cause for eight regions of the world: global burden of disease study. Lancet 1997;349:1269–75. [DOI] [PubMed] [Google Scholar]
- 7.Murray CJL, Lopez AD. Regional patterns of disability-free life expectancy and disability-adjusted life expectancy: global burden of disease study. Lancet 1997;349:1347–52. [DOI] [PubMed] [Google Scholar]
- 8.La Vecchia C, Levi F, Lucchini F, et al. Trends in mortality from major diseases in Europe, 1980–1993. Eur J Epidemiol 1998;14:1–8. [DOI] [PubMed] [Google Scholar]
- 9.Doll R. Health and the environment in the 1990s. Am J Public Health 1992;82:933–41. [DOI] [PMC free article] [PubMed] [Google Scholar]
- 10.Zatonski WA, Boyle P. Health transformations in Poland after 1988. J Epidemiol Biostat 1996;1:183–7. [Google Scholar]
- 11.Leon DA, Chenet L, Shkolnikov VM, et al. Huge variation in Russian mortality rates 1984–94: artefact, alcohol, or what? Lancet 1997;350:383–8. [DOI] [PubMed] [Google Scholar]
- 12.Shkolnikov V, McKee M, Leon DA. Changes in life expectancy in Russia in the mid-1990s. Lancet 2001;357:917–21. [DOI] [PubMed] [Google Scholar]
- 13.Watson R. Heart disease rising in central and eastern Europe. BMJ 2000;320:467. [DOI] [PMC free article] [PubMed] [Google Scholar]
- 14.Boys RJ, Forster DP, Józan P. Mortality from causes amenable and non-amenable to medical care: the experience of eastern Europe. BMJ 1991;303:879–83. [DOI] [PMC free article] [PubMed] [Google Scholar]
- 15.Bobak M, Skodova Z, Pisa Z, et al. Political changes and trends in cardiovascular risk factors in the Czech Republic, 1985–92. J Epidemiol Community Health 1997;51:272–7. [DOI] [PMC free article] [PubMed] [Google Scholar]
- 16.Zatonski WA, McMichael AJ, Powles JW. Ecological study of reasons for sharp decline in mortality from ischaemic heart disease in Poland since 1991. BMJ 1998;316:1047–51. [DOI] [PMC free article] [PubMed] [Google Scholar]
- 17.Okayama A, Ueshima H, Marmot M, et al. Generational and regional differences in trends of mortality from ischemic heart disease in Japan from 1969 to 1992. Am J Epidemiol 2001;153:1191–8. [DOI] [PubMed] [Google Scholar]
- 18.Juel K, Bjerregaard P, Madsen M. Mortality and life expectancy in Denmark and in other European countries. Eur J Public Health 2000;10:93–100. [Google Scholar]
- 19.McGovern PG, Pankow JS, Shahar E, et al. Recent trends in acute coronary heart disease: mortality, morbidity, medical care, and risk factors. N Engl J Med 1996;334:884–90. [DOI] [PubMed] [Google Scholar]
- 20.Gruppo Italiano per lo Studio della Streptokinasi nell'Infarto Miocardico (GISSI). Effectiveness of intravenous thrombolytic treatment in acute myocardial infarction. Lancet 1986;i:397–402. [PubMed] [Google Scholar]
- 21.ISIS-2 Collaborative group. Randomized trial of intravenous streptokinase, oral aspirin, both, or neither among 17,187 cases of suspected acute myocardial infarction: ISIS-2. Lancet 1988;ii:349–60. [PubMed] [Google Scholar]
- 22.Vartiainen E, Puska P, Jousilati P, et al. Twenty year trends in coronary risk factors in North Karelia and in other areas of Finland. Int J Epidemiol 1994;23:495–503. [DOI] [PubMed] [Google Scholar]
- 23.Murray CLJ, Lopez AD. Global mortality, disability, and the contribution of risk factors: global burden of disease study. Lancet 1997;349:1436–42. [DOI] [PubMed] [Google Scholar]
- 24.WHO Monica project. Ecological analysis of the association between mortality and major risk factors of cardiovascular disease. Int J Epidemiol 1994;23:505–16. [DOI] [PubMed] [Google Scholar]
- 25.Du X, Cruickshank K, McNamee R, et al. Case-control study of stroke and the quality of hypertension control of north west England. BMJ 1997;314:272–6. [DOI] [PMC free article] [PubMed] [Google Scholar]
- 26.Vartiainen E, Sarti C, Tuomilehto J, et al. Do changes in cardiovascular risk factors explain changes in mortality from stroke in Finland? BMJ 1995;310:901–4. [DOI] [PMC free article] [PubMed] [Google Scholar]
- 27.Ebrahim S, Davey Smith G. Exporting failure? Coronary heart disease and stroke in developing countries. Int J Epidemiol 2001;30:201–5. [DOI] [PubMed] [Google Scholar]
- 28.Ciruzzi M, Pramparo P, Rozlosnik J, et al, on behalf of the Argentine Factores de Riesgo Coronario en America del Sud (FRICAS) Investigators. Hypertension and the risk of acute myocardial infarction in Argentina. Prev Cardiol 2001;4:57–64. [DOI] [PubMed] [Google Scholar]
- 29.Vartiainen E, Jousilahti P, Alfthan G, et al. Cardiovasvular risk factor changes in Finland, 1972–1997. Int J Epidemiol 2000;29:49–56. [DOI] [PubMed] [Google Scholar]
- 30.Anon. Decline in deaths from heart disease and stroke—United States, 1900–1999. MMWR Morb Mortal Wkly Rep 1999;48:649–56. [PubMed] [Google Scholar]
- 31.Hunink MGM, Goldman L, Tosteson ANA, et al. The recent decline in mortality from coronary heart disease, 1980–1990. The effect of secular trends in risk factors and treatment. JAMA 1997;277:535–42. [PubMed] [Google Scholar]


