Abstract
Objective: To evaluate clinically a new on line, automated technique to measure flow mediated dilatation (FMD) as a marker of endothelial function.
Design: Prospective study.
Patients: 12 healthy volunteers and 12 patients with significant, angiographically documented coronary artery disease.
Interventions: Brachial arteries were imaged using a standard vascular ultrasound system with a 5–12 MHz linear transducer. Arterial diameter was measured on line (in real time) by connecting the ultrasound system to a personal computer equipped with a frame grabber and artery wall detection software (VIA) specially developed by the authors’ group. By using this new technique, FMD was measured following 4.5 minutes of ischaemia of the proximal forearm in all subjects on two separate days.
Results: The mean (SD) day to day variability in FMD measurements was 0.90 (0.48)%,which compares very favourably with current methods. The FMD measurement was available within seconds of completing the scan.
Conclusions: Personal computer based automated techniques to assess FMD involve image acquisition and recording after which a second (off line) image interpretation session is required. The need for off line analysis makes current methods time consuming and increases the variability of measurement. This on line, automated analysis technique for FMD assessment reduces the variability and greatly increases the speed of measurement. Using this system may mean that fewer patients will be required in clinical trials assessing the effects of interventions on endothelial function. Adopting this method may also facilitate the screening of larger numbers of subjects for endothelial dysfunction.
Keywords: endothelial function, brachial artery ultrasound, flow mediated dilatation
Endothelial dysfunction has an important role in atherogenesis and in the pathophysiology of coronary atherosclerosis.1,2 Prospective studies have also shown that coronary endothelial dysfunction can predict cardiovascular events.3,4 One of the functional consequences of endothelial dysfunction is reduced release of endothelial nitric oxide, which is known to have important antiatherogenic properties.5 Endothelial function can be assessed indirectly by measuring nitric oxide induced vasodilatation in either coronary or peripheral arteries.6 Coronary endothelial function has been shown to correlate with endothelial function in accessible peripheral arteries, such as the brachial artery.7 Hence, measurement of flow mediated dilatation (FMD) of the brachial artery provides a convenient and useful surrogate index of coronary endothelial function and has been applied in many research settings.8
Personal computer based techniques to assess FMD entail image acquisition and recording, after which a separate (off line) image interpretation session is required.9 The need for off line analysis makes current methods time consuming, increases the variability of measurement, and requires an image storage system. These factors limit the widespread use of the technique. We have developed an automated, on line analysis technique whereby images are acquired and arterial diameter is measured simultaneously. The accuracy of this new technique in determining vessel diameter has been shown by using a phantom artery model.10 The aim of this study was to assess the technique’s reproducibility and performance in a clinical setting. We have shown that this new method minimises variability and increases the speed of analysis of FMD.
METHODS
Subjects
Twelve healthy volunteers (seven men, five women) and 12 subjects with documented, significant coronary artery disease (CAD) (10 men, two women) participated in the study. All the healthy volunteers had no history of cardiovascular disease or known cardiovascular risk factors and were taking no regular medication. Significant CAD was defined as the presence of > 50% lumen diameter reduction of at least one major coronary artery on angiography. Exclusion criteria in the CAD group were as follows:
recent (within three months) myocardial infarction as defined by standard World Health Organization criteria
recent (within three months) unstable angina (Braunwald IIIB classification)
any revascularisation procedure within the previous three months.
The local research ethics committee approved the study and all subjects gave written informed consent before enrolment in the study.
The subjects were investigated in our vascular laboratory, maintained at a constant temperature of 24°C. All measurements were performed in the morning before 1100 and all subjects fasted for at least 12 hours. Subjects were also asked to stop taking any medication for at least 12 hours before testing.
Measurement of endothelial function
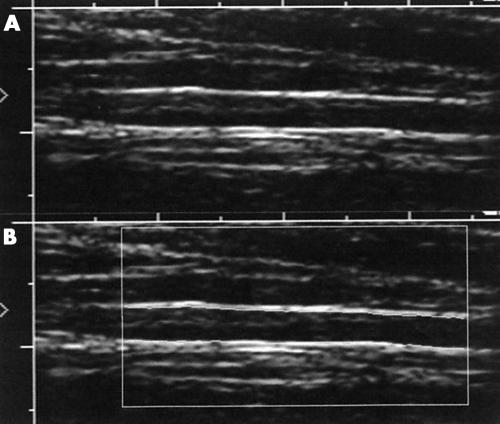
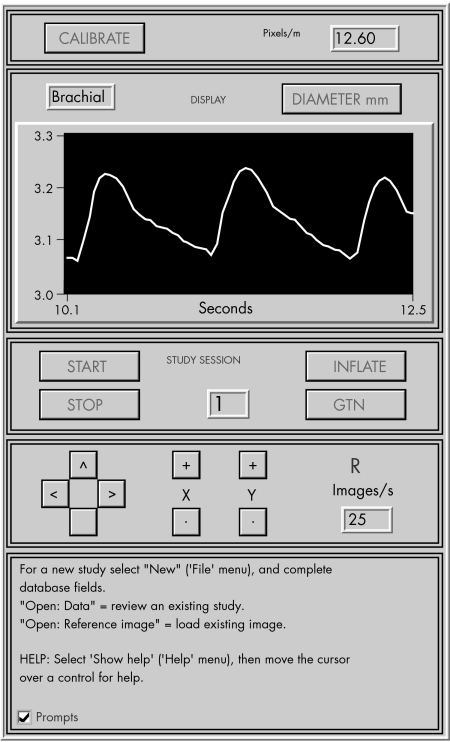
Brachial arteries were imaged with a standard HDI 3000 ultrasound system (ATL, Bothell, Washington, USA) with a 5–12 MHz linear transducer. The ultrasound system was connected to a personal computer equipped with a frame grabber and artificial neural network wall detection software (vessel image analysis (VIA)) specially developed by our group. The VIA software automatically detects and tracks the anterior and posterior walls within a user defined region of interest (fig 1). The vessel diameter is determined by averaging a large number of local vessel diameters. The software can also accommodate angulation of the artery (up to 20°) relative to the perpendicular. The B mode images are processed at 25 frames/s and the vessel diameter, including diameter changes over the cardiac cycle, is displayed in real time (fig 2). This allows ultrasound imaging parameters to be optimised at the start of the scan and the transducer position to be adjusted immediately for optimum tracking performance during the entire test.
Figure 1.
(A) The brachial artery is imaged such that the media–lumen interface is clearly seen. (B) The arterial media–lumen interface is automatically located and tracked within the region of interest.
Figure 2.
The mean vessel diameter within the region of interest is displayed in real time at 25 frames/s. This allows the operator to optimise image quality continually.
The brachial artery was scanned longitudinally 2–10 cm above the elbow until the clearest possible image of the anterior and posterior wall media was obtained. Depth and gain settings were kept constant during the rest of the study. A stereotactic clamp was used to hold the transducer and a screw gauge was used to make small compensatory movements of the transducer to accommodate subject movement during the test. The distance of the transducer from the antecubital fossa was noted and a two dimensional image of the brachial artery was saved on the computer’s hard drive for reference in repeat studies.
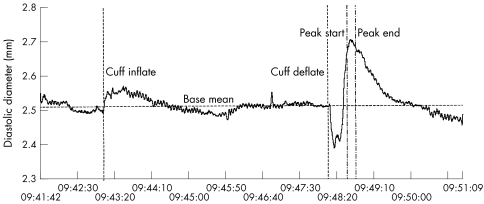
Brachial artery FMD was determined according to a conventional protocol. The right brachial artery was scanned continually throughout the test. Pulsed Doppler was used to assess arterial flow at rest and immediately after tourniquet deflation. Firstly, a baseline scan was performed for 2 minutes. Then a tourniquet located at the right proximal forearm was inflated to a pressure of 300 mm Hg for 4.5 minutes. Brachial artery dilatation following reactive hyperaemia was recorded for 5 minutes after tourniquet release. In the subjects with CAD sublingual glyceryl trinitrate (50 μg) was then administered and imaging performed for another 5 minutes to determine endothelium independent vasodilatation.11 At the end of the study a graph of diameter against time was immediately displayed. The FMD (defined by the percentage increase in mean diameter over a 10 second period, 55 seconds after tourniquet deflation) was automatically calculated by VIA from diastolic vessel diameters (fig 3). The endothelium independent dilatation was calculated similarly to the percentage increase in mean diameter 5 minutes after glyceryl trinitrate administration.
Figure 3.
Graph of brachial artery diameter versus time in a normal subject. Flow mediated dilatation for this subject was 7.34% when comparing mean diastolic diameter before cuff inflation and between the “peak start” and “peak end” cursors (55–65 seconds after cuff deflation). Variation in measured diameter caused by respiration is visible as a low amplitude oscillation.
To assess the reproducibility of our technique, the same operator repeated brachial artery studies in all 24 subjects on two days. The operator was blinded to the initial FMD result and medications remained unchanged between the initial and repeated scans.
Statistical analysis
All data are expressed as mean (1 SD) unless otherwise indicated. Independent variables were compared using the Mann-Whitney test to avoid assumptions about the distribution of data. Significance was inferred at a p < 0.05. The day to day variation of FMD and endothelium independent dilatation in patients with CAD was calculated by the mean (SD) of the difference between both scans of the same subject performed by the same operator. Data were processed using SPSS (version 10, SPSS Inc, Chicago, Illinois, USA).
RESULTS
FMD was measured satisfactorily in all 24 subjects (12 healthy control and 12 CAD subjects). Mean age in the healthy control group was 36 (7) years in the CAD group 62 (10). In each case the FMD and endothelium independent dilatation were computed and displayed within seconds of completing the brachial artery scan.
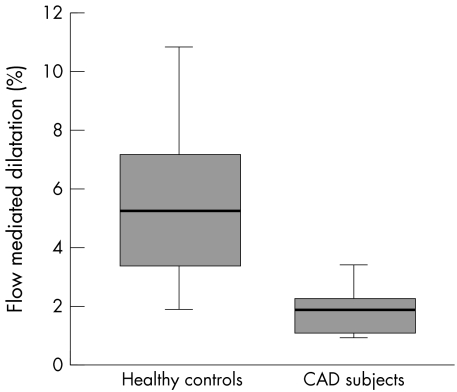
The mean resting brachial artery diameter was 4.3 (0.93) mm (range 2.23–5.90 mm). Analysis of resting brachial artery diameter measurements showed a day to day variability of 0.18 (0.15) mm. The mean FMD from repeated studies in the healthy controls was significantly higher than in CAD subjects (5.38 (2.60)% v 1.80 (0.79)%, p < 0.001) (fig 4).
Figure 4.
Flow mediated dilatation in healthy controls and in patients with coronary artery disease (CAD). Median (bold horizontal line), interquartile range (box), and extreme values (whiskers) are shown.
The overall mean day to day variability in FMD was 0.90 (0.48)% (range 0.21–2%). In subgroup analysis, the mean day to day variability did not differ significantly between healthy controls (0.83 (0.52)%) and subjects with CAD (0.96 (0.46)%).
In the 12 patients with CAD, the endothelium independent dilatation after sublingual glyceryl trinitrate was 8.0 (2.3)% with a mean day to day difference of 1.7 (1.5)%.
DISCUSSION
Our study shows the advantages of an on line technique to determine endothelial function as compared with current methods. On line image analysis and continuous display of vessel diameter allow wall tracking to be optimised throughout the study, avoiding loss of data because of poor image quality. Other techniques require vessel images to be stored in a storage media, such as videotape or computer disk, for later off line analysis. Image degradation can result from video recording and during the image processing steps undertaken to normalise images in retrospective analysis. No image storage or processing is necessary using the new method. Off line analysis also increases the total analysis time. Using VIA software, the FMD is calculated and displayed within seconds of completing the study. In contrast, current personal computer based techniques require at least 10 minutes of data analysis time after vessel imaging is completed to ascertain FMD in one subject.9 This time saving may be particularly important in relation to studies involving screening of large numbers of patients for endothelial dysfunction.
We have shown that this new technique minimises variability of measurement. The mean day to day variability of FMD measurements was 0.9 (0.5)% in subjects with a wide range of measured FMD and baseline arterial diameters. This compares favourably with the lowest reported variability using current methods.9 A major source of variation for studies measuring vascular function is the postscanning analysis of images, which requires further operator intervention. Using VIA completely abolishes the need for off line analysis, which results in reduced variability. The role of the operator is solely to maintain image quality within a defined region of interest. Real time wall detection may also help reduce variability. VIA allows wall tracking to be optimised during the test, unlike other retrospective methods where the study must be completed before wall tracking quality can be assessed. Using a reference two dimensional image of the artery for comparison in repeat studies also assists the operator in ensuring that the same section of artery is being scanned. Minimising measurement variability means that fewer patients will be required in clinical trials examining the effects of interventions on endothelial function. Our data suggest that the new method will probably be able to detect an improvement in FMD of only 1.8% (twice the day to day variability) with statistical confidence. In our study there was slightly greater variability in measured endothelium independent dilatation than in FMD (0.90 (0.48)% v 1.70 (1.5)%). This may reflect increased day to day subject variability in bioavailability and vascular smooth muscle responses to sublingual glyceryl trinitrate compared with flow mediated, nitric oxide induced dilatation. As expected our data show that patients with CAD have reduced FMD compared with healthy subjects, albeit the healthy subjects were younger.
Our important preliminary data, obtained from 24 subjects, need to be confirmed in a larger number of subjects.
In summary, we have shown that this new system for measuring endothelial function has several advantages over current methods. Using this method may have important implications for the number of patients required in clinical trials to assess the effects of interventions on endothelial function. The technique will facilitate the screening of larger numbers of subjects for endothelial dysfunction.
Acknowledgments
JSS is supported by a research grant from GlaxoSmithKline.
REFERENCES
- 1.Ross R. The pathogenesis of atherosclerosis: a perspective for the 1990s. Nature 1993;362:801–9. [DOI] [PubMed] [Google Scholar]
- 2.Biegelsen EB, Loscalzo J. Endothelial function and atherosclerosis. Coron Artery Dis 1999;10:241–56. [PubMed] [Google Scholar]
- 3.Schachinger V, Britten MB, Zeiher AM. Prognostic impact of coronary vasodilator dysfunction on adverse long-term outcome of coronary heart disease. Circulation 2000;101:1899–906. [DOI] [PubMed] [Google Scholar]
- 4.Suwaidi JA, Hamasaki S, Higano ST, et al. Long-term follow up of patients with mild coronary artery diesase and endothelial dysfunction. Circulation 2000;101:948–54. [DOI] [PubMed] [Google Scholar]
- 5.Vane JR, Anggard EE, Botting RM. Regulatory functions of the vascular endothelium. N Engl J Med 1990;323:27–36. [DOI] [PubMed] [Google Scholar]
- 6.Anderson TJ. Assessment and treatment of endothelial dysfunction in humans. J Am Coll Cardiol 1999;34:631–8. [DOI] [PubMed] [Google Scholar]
- 7.Anderson TJ, Uehata A, Gerhard MD, et al. Close relation of endothelial function in the human coronary artery and peripheral circulations. J Am Coll Cardiol 1995;26:1235–41. [DOI] [PubMed] [Google Scholar]
- 8.Drexler H. Endothelial dysfunction: clinical implications. Prog Cardiovasc Dis 1997;39:287–324. [DOI] [PubMed] [Google Scholar]
- 9.Preik M, Lauer T, Heiss C, et al. Automated ultrasonic measurement of human arteries for the determination of endothelial function. Ultraschall Med 2000;21:195–8. [DOI] [PubMed] [Google Scholar]
- 10.Newey VR, Nassiri DK. Online artery diameter measurement in ultrasound images using artificial neural networks. Ultrasound Med Biol 2002;28:209–16. [DOI] [PubMed] [Google Scholar]
- 11.Celermajer DS. Testing endothelial function using ultrasound. J Cardiovasc Pharmacol 1998;32(suppl 3):S29–32. [PubMed] [Google Scholar]


