

Abstract
Objective: To study postnatal cardiac differentiation in the mouse.
Hypothesis: There might be mechanisms or factors in cardiac differentiation that could be identified by systematic gene expression analysis during postnatal cardiac development.
Methods: Expression of 6144 genes was examined in mouse heart, from the newborn period (day 0), through day 7 and day 14 day, to adulthood, using the cDNA microarray approach. Northern blotting and immunohistochemical techniques were used to confirm the microarray results.
Results: Various cardiac development related genes involving the cell cycle (cyclin B1, proliferating cell nuclear antigen (PCNA), and Ki67), growth factors (IGF-II, pleiotrophin (PTN), and midkine (MK)), and transcriptional regulation, cytoskeleton, and detoxification enzymes were identified by microarray analysis. Some of these genes were also confirmed by Northern blotting and immunohistochemistry of their RNA and protein content. In vivo treatment with PTN (20 ng/g) increased bromodeoxyuridine incorporation (by 2.24-fold) and PCNA expression (by 1.71-fold) during day 7 to day 14, indicating that PTN induces cell proliferation in mouse heart.
Conclusions: Global gene expression analysis in the whole heart may be useful in understanding the orchestrated process of postnatal development or terminal differentiation in the cardiac environment. These data are likely to be helpful in studying developmental anomalies of the heart in neonates.
Keywords: developmental biology, gene expression, growth factors, microarray, pleiotrophin
Cardiac muscle cells show two related but distinct modes of growth that are highly regulated during development and disease. Cardiomyocytes proliferate rapidly during fetal life but exit the cell cycle soon after birth, after which the predominant form of growth shifts from hyperplasia to hypertrophy.1,2 During postnatal development, cardiac growth in the human, the mouse, and the rat undergoes this shift, such that further increases in myocardial mass are not typically accompanied by cardiomyocyte proliferation.3 In humans, the capability to undergo mitosis and hyperplasia is lost 3–6 months postnatally.4 Previous studies suggested that most cardiac cells in the rat and mouse gradually cease to undergo DNA replication, which is a prerequisite for proliferation, within the first two weeks after birth.5–7 For this reason, further response to growth, injury, and increased workload is restricted to increasing the mass of existing myocytes, mainly by hypertrophy of mature cardiomyocytes.8,9
Differentiated mature myocytes are permanently withdrawn from the cell cycle and represent an irreversible commitment to the differentiated phenotype. The dogma was introduced that adult cardiomyocytes are terminally differentiated cells.4,10 However, the view that myocytes cannot re-enter the cell cycle in the adult heart has been challenged.11 Several factors including cell cycle regulators (cyclins, cyclin dependent kinases, and proliferating cell nuclear antigen) and oncogenes (c-myc and Rb) are reportedly involved in cardiac muscle cell cycle progression.1 However, the molecular mechanisms responsible for terminal differentiation in cardiomyocytes—in particular the cell cycle arrest—are still unclear. Furthermore, it is also controversial whether or not adult cardiomyocytes retain a limited capacity for cell cycle re-entry.10,11 The factors that drive the proliferative growth of embryonic myocardium in vivo and the mechanisms whereby adult cardiomyocytes hypertrophy in vivo are less clear.
If we could understand the molecular mechanisms involved in the blocking of mitosis in cardiomyocytes during postnatal life, this might facilitate the development of new treatment for cardiovascular injury or disease, based on enhancing the regeneration of the adult myocardium. To achieve this goal, it is essential to identify and characterise key molecules participating in the growth of the newborn heart.
Systematic studies of gene expression patterns using cDNA microarray analysis provide a powerful approach to the molecular dissection of cells and tissues by comparing expression levels of thousands of genes at one time.12–14 In the present study, we initiated a project to profile the gene expression in various postnatal cardiac developmental states using mouse cDNA microarray (6144 genes, including known regulatory genes and mouse expressed sequence tags (ESTs)), employing a colorimetric detection system.13,15 We identified many genes where expression was upregulated or downregulated during postnatal heart development. Some of these candidate genes may be involved in the control of proliferation, differentiation, and hypertrophy of the myocardium. An in vivo study showed the role of pleiotrophin (PTN) in cell growth regulation during postnatal development. Further studies are underway to characterise the exact function of the genes regulating cardiac development.
METHODS
Experimental animals and RNA preparation
The study was approved by the institutional review board and the animal care and use committee of our hospital (National Taiwan University Hospital (NTUH), Taiwan), and was performed in adherence to the guidelines established in the Guide for the care and use of laboratory animals as adopted and promulgated by the National Health Research Institutes (NHRI), Taiwan.
ICR mice (Harlan Sprague-Dawley, Indianapolis, Indiana, USA) were studied as neonates (day 0), pups (day 7 and day 14), and adults (2–3 months). As it is difficult to avoid non-cardiomyocyte contamination or to obtain large enough quantities of working cardiomyocytes, we used whole hearts to analyse global gene expression profiles, though cell–cell interactions between cardiomyocytes and other cardiac cells (endothelium and fibroblasts) are inevitable. In order to reduce the individual differences in differentiation, hearts from 87 mice on day 0 (neonatal), 85 mice on day 7, 77 on day 14, and 34 adult mice were used. Each group included about 700 mg of tissue from several hearts for mRNA extraction.
Microarray system
Preparation of mice cDNA microarray
Mouse EST clones with a putative gene name were obtained from the IMAGE consortium libraries through its distributor (Research Genetics, Huntsville, Alabama, USA).16 These gene clones were derived from various tissues and in different library constructs. Most of the clones have been partially sequenced, and the sequence information is available as EST from dbEST of GeneBank.17
The cDNA microarray (measuring 18 × 27 mm) carrying 6144 PCR amplified cDNA fragments (length 0.5–3.0 kb, averaging around 1.0 kb) was prepared using an arraying machine (Wittech, Taipei, Taiwan).
Preparation of cDNA targets and microarray hybridisation
Five micrograms of the mRNAs derived from four groups of hearts (day 0, day 7, day 14, and adult) were labelled with biotin during reverse transcription as described in our previous report.13 All hybridisation experiments were carried out in triplicate. Details of target preparation, hybridisation, and colour development have been described before.13,15
Image processing and digitisation
After colour development, cDNA molecules labelled with biotin yield a blue chromogen.13,18 The microarray images were scanned and digitised using flatted scanner (PowerLook 3000, UMAX, Taipei, Taiwan). The scanner provided 3000 dpi resolution and was suitable for larger arrays, such as arrays of 6144 elements. The microarray was processed by commercial image processing programs to convert the true colour images into grey scale images; image analysis and spot quantification were then carried out using GenePix 3.0 (Axon, Union City, California, USA) or the MuCDA program, which was written in-house and is available on-line (http://w3.mc.ntu.edu.tw/department/genechip/supplement.htm).
Northern hybridisation
To confirm the results of the microarray analysis, 10 differentially expressed clones were selected from cluster analysis of the array data, and the entire inserts of the clones were individually amplified by polymerase chain reaction (PCR) to serve as probes for Northern blotting. The amplified cDNA fragments were labelled with digoxigenin-11-dUTP by random primed labelling, as in our previous reports.13,18
Immunohistochemistry
Mice hearts from four different stages were dissected, fixed, and then prepared for immunohistochemistry as previously reported.19 The slides were incubated with the primary antibody, 1:100, for proliferating cell nuclear antigen (PCNA), cyclin B1, insulin-like growth factor II (IGF-II), mitogen activated protein kinase 4 (MEK4/SEK1), and heat shock protein 70 (Hsp70) (Santa Cruz, Biotech Inc, California, USA). The slides were then incubated with the biotinylated secondary antibody and peroxidase labelled streptavidin (ABC kit, Vector Laboratories, Burlingame, California, USA). Negative control slides in the absence of primary antibody were included for each staining. Finally, 3,3′-diamino-benzidine (DAB) was used to develop the colour, and haematoxylin was used for counterstaining.
Bromodeoxyuridine incorporation
To study the effects of PTN and IGF-II on cell proliferation of mouse heart during postnatal development, rhPTN and rmIGF-II (20 ng/g body weight/day, R&D Systems Inc, Minneapolis, Minnesota, USA) were given to the mice from day 7 to day 14. Bromodeoxyuridine (BrdU) is a thymidine analogue that becomes incorporated into the DNA of dividing cells. To identify proliferating cells, mice were given a single dose of BrdU (in situ cell proliferation kit, FLUOS, Roche, Mannheim, Germany; 100 μg/g body weight intraperitoneally), as previously described.19 After 12–24 hours of incorporation, the mice were killed. The hearts were fixed and processed for paraffin embedding.
Immunostaining of BrdU/PCNA and myosin heavy chain
The antimonoclonal mouse antibody anti-BrdU (Roche, Mannheim, Germany, FITC conjugated) or PCNA (Santa Cruz, Biotech Inc) was employed for this study. The antibody, diluted 1:50 with phosphate buffered saline (PBS), and 1% bovine serum albumin, was applied for 60 minutes at room temperature. Sections were then subjected to two step incubations of 30 minutes each with biotinylated rabbit anti-mouse IgG, followed by peroxidase labelled streptavidin (ABC kit, Vector Laboratories). The peroxidase reaction was developed with 0.05% 3–3′ diaminobenzidine (DAB) in 0.05 M tris-HCl buffer, pH 7.6, containing 0.01% H2O2. The sections were then incubated for 30 minutes with polyclonal anti-goat myosin heavy chain (MHC) antibody (Santa Cruz, Biotech Inc) diluted 1:50, followed by alkaline phosphatase labelled streptavidin (Santa Cruz, Biotech Inc) or rodamin conjugated donkey anti-goat IgG (Santa Cruz, Biotech Inc). As a chromogen, Fast Red (Vector Laboratories) was used.
PCNA or BrdU labelled nuclei showed as brownish (PCNA) or green fluorescence (BrdU); MHC staining of the cytoplasm appeared reddish in colorimetric or fluorescence staining in cardiomyocytes. The sections were lightly counterstained with Mayer’s haematoxylin for colorimetric staining and DAPI for fluorescence staining; the sections were then mounted. Myocardial sections in which the primary antiserum was replaced by PBS during the staining procedure were used as negative controls.
Statistical analysis
The cluster analysis method was used to identify postnatal development associated genes on the microarray. Gene expression data obtained from the microarray experiments were processed and normalised, using a protocol and program that has been described previously.20 Genes were clustered into groups on the basis of expression profiles by the SOMs (self organising maps) algorithm, as described.21 After cluster analysis by the SOMs method, we identified genes with expression profiles correlating either positively or negatively with postnatal cardiac development. These genes were also grouped into categories by their putative function on the basis of published reports. Genes with multiple roles were included in more than one category. A repeated measures analysis of variance (ANOVA) was done to determine any significant difference between the developmental stages of the mouse heart. Where appropriate, the data are expressed as mean (SEM).
RESULTS
Gene expression profiles by cDNA microarray
The array signal intensities of day 0 neonatal hearts were compared with those of subsequent samples (day 7, day 14, and adult). Figure 1A illustrates a collection of cropped microarray images (5 × 5 spots) showing the gene expression patterns for a series of postnatal developing hearts. As shown in the figure, most of the spots had the same signal intensities from the neonatal period to adulthood; however, some of the spots showed different signal intensities (close up views of the cDNA microarray). In fig 1A, the expression levels of cyclin B1 and MEK4/SEK1 were correlated negatively, and those of the caeruloplasmin gene positively, with postnatal heart development.
Figure 1.
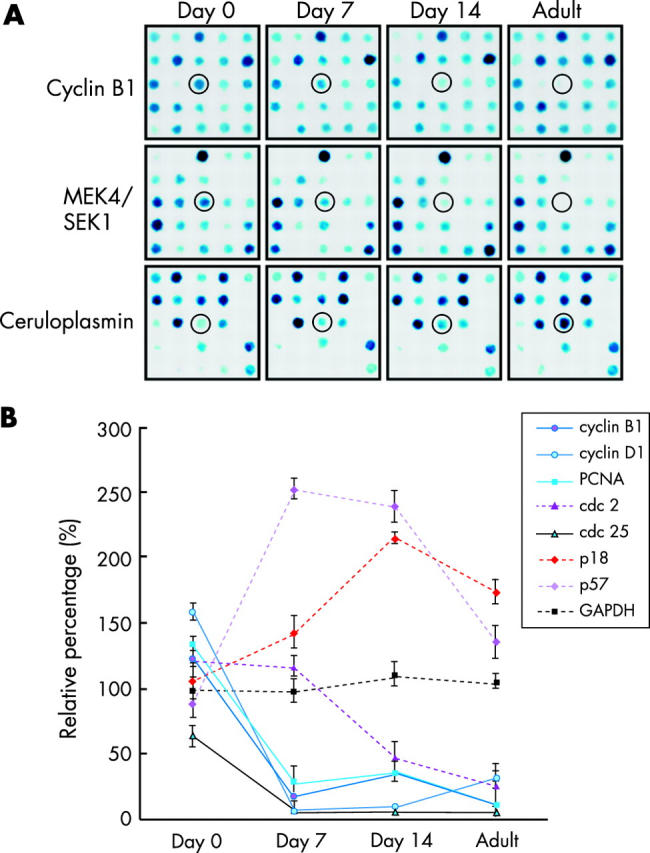
(A) Close up views of microarray images showing different gene expression patterns of day 0 (neonatal), day 7, day 14, and adult (2–3 month old) hearts. The single colour dot in the open circles indicates the mRNA expression level of cyclin B1 (upper panel), MEK4/SEK1 (middle panel), and caeruloplasmin (lower panel). Similar results were obtained from three different independent experiments. (B) Dynamic expression levels of cell cycle related genes in cardiac development from neonatal to adult life. The housekeeping gene, GAPDH, is an internal control and its relative expression is designated as 100.0%. The cell cycle activators (cyclin B1, D1, cdc2, cdc25, and PCNA) decrease after birth, while the cell cycle inhibitors (p18 and p57) increase after birth and decrease again after two weeks. Data are expressed as mean with SEM (n = 3).
Several cell cycle regulators are reported to be downregulated during postnatal cardiac development.22 We collected data on the genes associated with cell cycle regulation in microarray images. The housekeeping gene, GAPDH, is an internal control and its relative percentage (mean (SEM)) is 100 (9.2)% (n = 3). Figure 1B shows that the relative expression levels of cell cycle activators (cyclin B1, cyclin D1, cdc2, cdc25, and cdc42) and cell proliferating marker (PCNA and Ki67) were downregulated postnatally, and the inhibitors of cyclin dependent kinases (p18 and p57) were upregulated.
According to the maturity of the mice (day 0, day 7, day 14, and adult), 13 genes showed a sustained increased after birth (fig 2A-a), 104 were dramatically increased on day 7 (fig 2A-b), and 55 showed a sustained increase between day 7 and day 14 (fig 2A-c). In addition, 114 genes were reduced on day 7 and then increased on day 14 and in adulthood (fig 2A-d), 57 were dramatically decreased after birth (fig 2A-e), and 39 were reduced in adulthood (fig 2A-f). All the gene expression profiles in fig 2A were rearranged by hierarchical cluster analysis using the average linkage method.12 The expression levels were grey density encoded as shown in fig 2B, which gives the levels of gene expression from black (low) to white (high).
Figure 2.
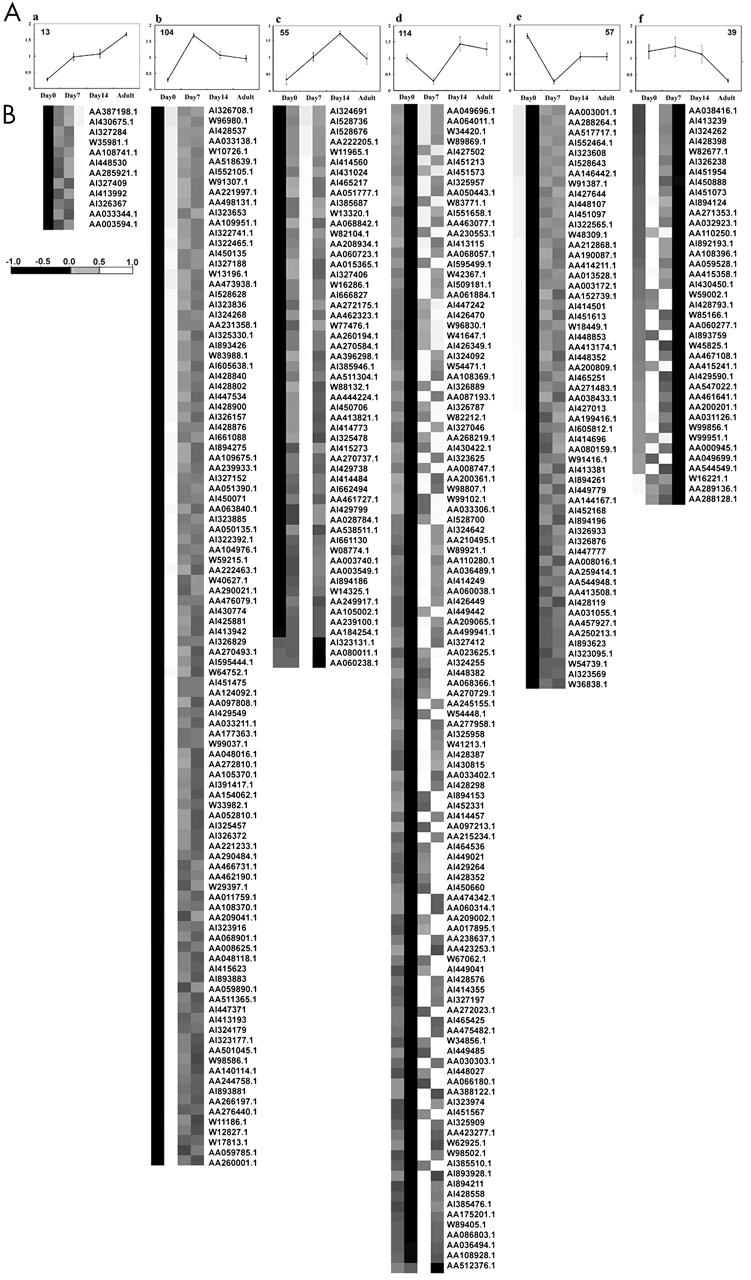
Cluster analysis of expression profiles of mouse hearts on day 0 (neonatal), day 7, day 14, and in adulthood. (A) Self organising map clustering. Expression profiles with descending trends (66 genes, left upper panel) and ascending trends (51 genes, right upper panel) were selected from 36 clusters and represented by the centroid. (B) Hierarchical clustering. All the genes derived from (A) were clustered by the average linkage method and the cluster image shows the trend of gene expression in cardiac development after birth by grey level.
The genes clustered in fig 2 were grouped into nine categories on the basis of their cellular functions. These are shown in fig 3, and include cell cycle regulators, growth factors or apoptotic factors, signal transduction molecules, transcription factors, ion channels, cytoskeleton/extracellular matrix, stress response proteins, metabolic enzymes, and anonymous genes correlating negatively or positively with terminal differentiation of cardiomyocytes (marked as EST).
Figure 3.
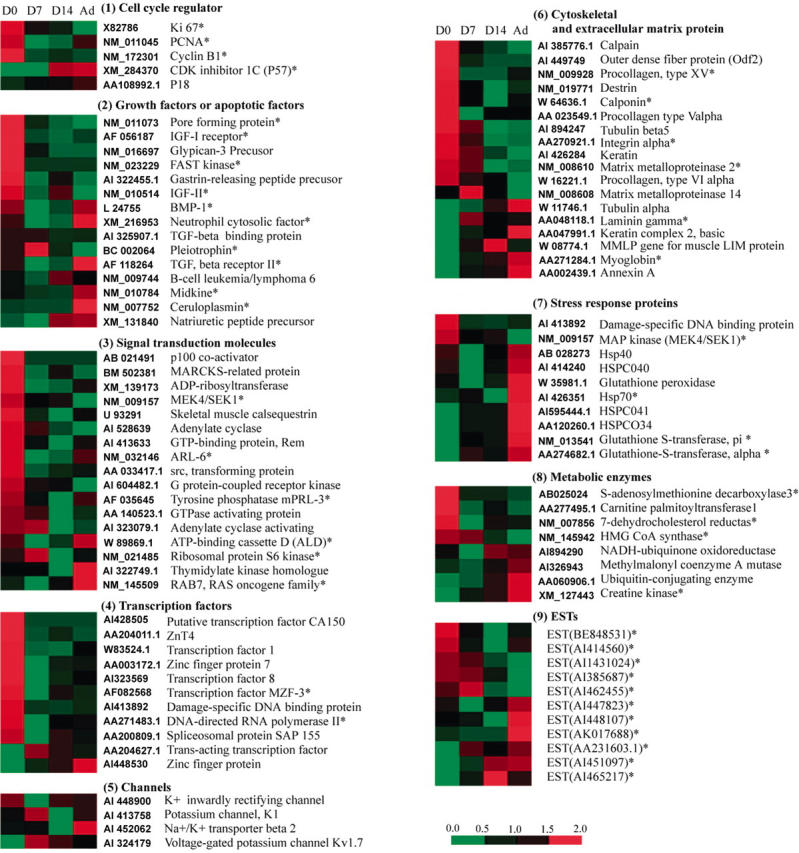
Grouping of genes associated with terminal differentiation. The genes with descending or ascending trends clustered in fig 2 were grouped into nine categories on the basis of their cellular roles. The grey level panel beside the name of gene shows the trend of gene expression levels at different stages of postnatal cardiac development.
Northern hybridisation analysis
To confirm the results of the microarray studies, Northern blotting analysis was undertaken. Seven genes of descending expression (PCNA, cyclin B1, IGF-II, MEK4/SEK1, ARL-6, S-adenosylmethionine decarboxylase 3, and HMGCoA synthase) and three genes of ascending expression (neuronal protein 3, TB2-like protein, and caeruloplasmin) were selected, based on the microarray data. Figure 4 shows that the mRNA levels of these seven descending genes were downregulated during postnatal cardiac development.
Figure 4.

Northern blot analysis for the change in mRNA in postnatal myocardium. Seven genes (cyclin B1, PCNA, IGF-II, MEK4/SEK1, HMGCoA synthase, ARL-6, and S-adenosylmethionine decarboxylase 3) with descending expression profiles and three genes (caeruloplasmin, TB2 protein-like 1, and neuronal protein 3) with ascending profiles were used to demonstrate the validity of the microarray results. GAPDH and 18S/28S were used as the internal control and for RNA quantitation. Each gene has been sequence verified. Similar results were obtained in three independent experiments.
Immunohistochemical analysis of protein expressions
To demonstrate that protein expression by the identified gene was also consistent with the microarray analysis, five antibodies (cyclin B1, PCNA, IGF-II, MEK4/SEK1, and Hsp70) were used to carry out immunohistochemical analyses across the differentiation stages of the hearts after birth. Figure 5 shows that the protein levels of PCNA, cyclin B1, IGF-II, and MEK4/SEK1 were downregulated during cardiac development from neonatal (day 0) to adulthood, whereas Hsp70 was upregulated.
Figure 5.
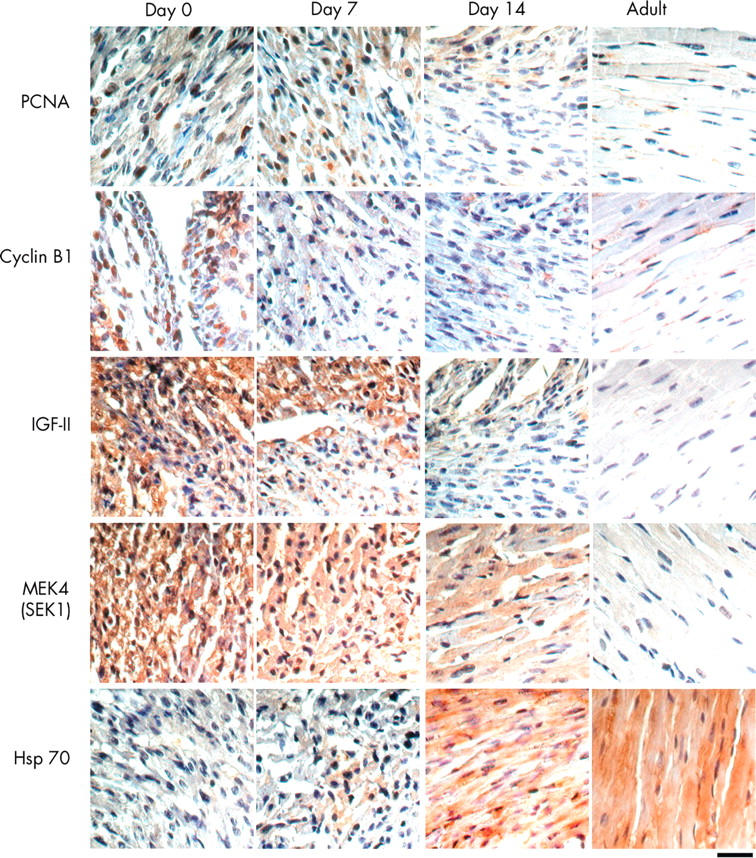
Immunohistochemical staining for protein expression and localisation. The expression of cyclin B1, PCNA, IGF-II, MEK4/SEK1, and Hsp70 in mouse cardiac tissues on day 0 (neonatal), day 7, day 14, and in adulthood (2–3 months old) is shown. Specific antibodies against cyclin B1, PCNA, IGF-II, MEK4/SEK1, and Hsp70 were used, followed by the biotinylated secondary antibody, peroxidase labelled streptavidin, and development by 3,3′-diamino-benzidine (giving a brown colour). Haematoxylin was used for counterstaining (blue colour in the nuclei). Magnification × 400; bar = 100 m. Arrows indicate strong immunoreactivity of proteins. Similar results were obtained in at least three independent experiments.
Exogenous PTN and IGF-II induces DNA synthesis in postnatal cardiomyocytes
To determine whether PTN or IGF-II can stimulate cell proliferation in neonatal cardiomyocytes, the effects of stimulation with exogenous PTN and IGF-II on DNA synthesis were determined in vivo (fig 6). Mice on day 7 were divided into four groups with four pups in each group. The first control group was injected with normal saline, the second was treated with 20 ng/g/day of recombinant human PTN, the third group with 20 ng/g/day of recombinant mice IGF-II, and the fourth group with both PTN and IGF-II. This treatment was continued to day 14. Incorporation of BrdU and immunostaining of PCNA were used to monitor DNA synthesis. The ratio of heart weight (mg) to body weight (g) was significantly increased following PTN treatment (an increase of 125.4 (5.3)% compared with untreated controls, p < 0.05, n = 4). In fig 6A, BrdU positive staining is shown to be localised in the cell nuclei by co-localisation with DAPI staining. Ventricular myocytes were distinguished from other cardiac cells by staining with cardiac myosin heavy chain (MyHC, red fluorescence). The yellow arrows in fig 6A show that some BrdU positive cells were also MyHC positive. This result indicated that PTN induced cell proliferation could occur in cardiomyocytes. The PCNA positive cells were also found in cardiomyocytes by double staining with PCNA and MyHC (fig 6B). Quantification of these BrdU or PCNA positive cardiomyocytes is shown in fig 6C. Both BrdU and PCNA were significantly increased in the PTN treated group (p < 0.05 v untreated control, fig 6C); the IGF-II treated group showed only a minor response that did not achieve statistical significance. The effects of PTN seem to be reduced by co-incubation with IGF-II, though the difference between PTN alone and co-administered with IGF-II did not achieve significance (p > 0.05) (fig 6). Thus IGF-II could have a slight influence on the effects of PTN on cardiomyocyte proliferation, but the interactive effects of PTN and IGF-II need further study.
Figure 6.

The effects of exogenous pleiotrophin (PTN) and insulin-like growth factor II (IGF-II) on DNA synthesis in postnatal myocardium. Mice on day 7 were divided into four groups. The first (control) group was injected with normal saline, the second group was treated with 20 ng/g/day of recombinant human PTN, the third group was treated with 20 ng/g/day of recombinant mice IGF-II, and the fourth group was treated with both PTN and IGF-II. DNA synthesis was monitored by measuring the incorporation of bromodeoxyuridine (BrdU), which was added 24 hours before termination of growth factor stimulation. Immunofluorescence staining was done at the end of the seven day period of stimulation with PTN and IGF-II. (A) Triple staining with BrdU (FITC conjugated), myosin heavy chains (MyHC, rodamine conjugated), and DAPI (counterstaining for cell nuclei) was done to assess the proliferative effect of PTN in mice heart. Yellow arrows indicate the BrdU positive cells and also cells staining positive for myosin heavy chains; these were counted as proliferative cardiomyocytes. Similar results were obtained in at least three independent experiments. (B) Triple staining with proliferating cell nuclear antigen (PCNA; brown colour), myosin heavy chains (MyHC, red colour), and haematoxylin (counterstaining for cell nuclei, blue colour) was done to assess the proliferative effect of PTN. Yellow arrows indicate the PCNA positive nuclei and also cells that stained positive for myosin heavy chains in the cytosol; these were counted as PCNA positive cardiomyocytes. Similar results were obtained in at least three independent experiments. (C) Quantitation of BrdU or PCNA positive cardiomyocytes as a percentage of the total cell number. Positive cells were counted in a single field of ×400 magnification (n = 5) Error bars = SEM. *p < 0.05; †p > 0.05.
The supplement data are posted on our website: (http://w3.mc.ntu.edu.tw/department/genechip/supplement.htm).
DISCUSSION
For the first time it has been possible to distinguish the expression profiles and dynamic changes in the genes associated with postnatal development in the mouse heart. Using the powerful cDNA microarray technique, thousands of genes can be assigned to developmental pathways known to be active or inactivate during myocardial differentiation, while others can be assigned to pathways not previously associated with postnatal development. Unfortunately, the RNA samples used in this study were obtained from the entire myocardial tissue. As this mRNA was collected from both myocytes and non-myocytes, the data are not straightforward to interpret. However, information from the tissues shows a global view of the environmental changes in the whole heart during postnatal development.
According to our microarray analysis, the genes related to cell cycle progression and growth factors were reduced, while the structural proteins and stress response factors were relatively increased. As in previous studies,22–24 PCNA, Ki67, MEK4/SEK1, BMP-1, and IGFs—which have been reported to be associated with postnatal development—were also found to be regulated during postnatal cardiac development in our present study. Another study, by Sehl and colleagues,25 using the rat cDNA microarray (with 86 known genes and 989 anonymous genes), has shown the differentially expressed patterns of genes in 13 day embryos, neonatal rats, and adult rats, confirming the importance of studying gene expression profiles in clarifying the process of cardiac development.25 To determine the roles of these differentially expressed genes, they are discussed by their putative function in regulating cell growth, development, and differentiation.
Cell cycle regulators in postnatal cardiac development
Previous reports indicated that the cyclin B1/cdc2 complex plays an important role in the S-G2 phase of cell cycle.22 Interestingly, gene expression levels of cyclin D1 and cdc2 were also found to be downregulated during terminal differentiation in skeletal myoblasts in vitro.26 Additionally, the degradation of cyclin B1 and the cells exiting the M phase might connect with binuclear or tetranuclear formation in Drosophila spermatids.27 We suggest that the downregulation of cyclin B1 may be related to the binuclear formation of cardiomyocytes during postnatal cardiac development between day 7 and day 14.
Growth factors in postnatal cardiac development
The insulin-like growth factor family has been studied in many tissues and appears to be involved in the development and regeneration of skeletal muscle myofibres and spinal motor neurones.28–30 In the present study, IGF-II was found to be dramatically reduced after birth, while IGF receptors did not change significantly, indicating that IGF-II could be related to the postnatal development of cardiac cells. A previous study showed that IGF-II could induce cell proliferation in fetal ventricular myocytes, while no change in BrdU or [3H] thymidine incorporation was observed in the neonatal period.31 Our results also showed that in vivo treatment with IGF-II did not induce significant cell proliferation in the postnatal heart. The role of IGF-II seems to be to induce hypertrophy in neonatal ventricular myocytes.31
The other group of growth factors, PTN and midkine—a family of mitogenic and angiogenic heparin binding growth and differentiation factors32,33—was also downregulated during postnatal differentiation of the myocardium in our study. These have also been found to be downregulated during postnatal development in the kidney, using microarray analysis.34 Our in vivo study showed that the postnatal proliferation of cardiomyocytes could be maintained in PTN treated mice. A previous study also showed that PTN and other neurotrophic factors might be necessary for the formation of new neuromuscular junctions during skeletal muscle regeneration.28 These results suggest the use of PTN as a form of treatment to induce cardiomyocyte regeneration in the adult myocardium in cardiac diseases that result in cardiomyocyte loss. Further studies are underway to determine the detailed mechanisms of PTN in myocardial development and regeneration.
Conclusions
We report a global analysis of dynamic gene expression in postnatal cardiac development from the neonatal period to adulthood. Although we could not show which genes were differentially expressed between cardiomyocyte and non-myocytes at each stage of development, we were able to identify some candidate genes that may be related to postnatal cardiac differentiation (PTN is an example). Further studies are underway to characterise the exact function of these candidate genes in the regulation of cardiac development.
Acknowledgments
This investigation was supported by grants from the National Science Council, the Department of Health and the National Taiwan University Hospital, Taiwan (NTUH90A07 and NTUH91A11). Preliminary results of this study were presented at 14th World Congress of Cardiology, Sidney, Australia, May 5–9, 2002.
Abbreviations
EST, expressed sequence tag
PCNA, proliferating cell nuclear antigen
PTN, pleiotrophin
REFERENCES
- 1.MacLellan WR, Schneider MD. Genetic dissection of cardiac growth control pathways. Annu Rev Physiol 2000;62:289–319. [DOI] [PubMed] [Google Scholar]
- 2.Rumayantsev PP. Interrelations of the proliferation and differentiation processes during cardiac myogenesis and regeneration. Int Rev Cytol 1977;51:187–273. [PubMed] [Google Scholar]
- 3.Soonpaa MH, Field LJ. Survey of studies examining mammalian cardiomyocyte DNA synthesis. Circ Res 1998;83:15–26. [DOI] [PubMed] [Google Scholar]
- 4.Tam SKC, Gu W, Mahdavi V, et al. Cardiac myocyte terminal differentiation-potential for cardiac regeneration. Ann NY Acad Sci 1995;752:72–9. [DOI] [PubMed] [Google Scholar]
- 5.Li F , Wang X, Capasso JM, et al. Rapid transition of cardiac myocytes from hyperplasia to hypertrophy during postnatal development. J Mol Cell Cardiol 1996;28:1737–46. [DOI] [PubMed] [Google Scholar]
- 6.Machida N , Brisse N, Sreenan C, et al. Inhibition of cardiac myocyte division in c-myc transgenic mice. J Mol Cell Cardiol 1997;29:1895–902. [DOI] [PubMed] [Google Scholar]
- 7.Soonpaa MH, Field LJ. Assessment of cardiomyocyte DNA synthesis in normal and injured adult mouse hearts. Am J Physiol 1997;272:H220–6. [DOI] [PubMed] [Google Scholar]
- 8.Johnatty SE, Dyck JR, Michael LH, et al. Identification of genes regulated during mechanical load-induced cardiac hypertrophy. J Mol Cell Cardiol 2000;32:805–15. [DOI] [PubMed] [Google Scholar]
- 9.Oparil S . Pathogenesis of ventricular hypertrophy. J Am Coll Cardiol 1985;5:57–65B. [DOI] [PubMed] [Google Scholar]
- 10.Endo T , Nadal-Ginard B. Transcriptional and posttranscriptional control of c-myc during myogenesis: its mRNA remains inducible in differentiated cells and does not suppress the differentiated phenotype. Mol Cell Biol 1986;6:1412–21. [DOI] [PMC free article] [PubMed] [Google Scholar]
- 11.Anversa P , Kajstura J. Ventricular myocytes are not terminally differentiated in the adult mammalian heart. Circ Res 1998;83:1–14. [DOI] [PubMed] [Google Scholar]
- 12.Abdellatif M . Leading the way using microarray: a more comprehensive approach for discovery of gene expression patterns. Circulation 2000;86:919–20. [DOI] [PubMed] [Google Scholar]
- 13.Chen JJW, Wu R, Yang PC, et al. Profiling expression patterns and isolating differentially expressed genes by cDNA microarray system with colorimetry detection. Genomics 1998;51:313–24. [DOI] [PubMed] [Google Scholar]
- 14.Lockhart DJ, Winzeler EA. Genomics, gene expression and DNA arrays. Nature 2000;405:827–35. [DOI] [PubMed] [Google Scholar]
- 15.Hong TM, Yang PC, Peck K, et al. Profiling the down stream genes of tumor suppressor PTEN in lung cancer cells by cDNA microarray. Am J Respir Cell Mol Biol 2000;23:355–63. [DOI] [PubMed] [Google Scholar]
- 16.Lennon G , Auffray C, Polymeropoulos M, et al. The I.M.A.G.E. Consortium: an integrated molecular analysis of genomes and their expression, Genomics 1996;33:151–2. [DOI] [PubMed] [Google Scholar]
- 17.Boguski MS, Tolstoshev CM, Bassett DE. Gene discovery in db EST. Science 1994;265:1993–94. [DOI] [PubMed] [Google Scholar]
- 18.Chen JJW, Peck K, Hong TM, et al. Global analysis of gene expression in invasion by a lung cancer model. Cancer Res 2001;61:5223–30. [PubMed] [Google Scholar]
- 19.Fernandez E , Siddiquee Z, Shohet RV. Apoptosis and proliferation in the neonatal murine heart. Dev Dynam 2001;221:302–10. [DOI] [PubMed] [Google Scholar]
- 20.Iyer VR, Eisen MB, Ross DT, et al. The transcriptional program in the response of human fibroblasts to serum. Science 1999;75:83–7. [DOI] [PubMed] [Google Scholar]
- 21.Tamayo P , Slonim D, Mesirov J, et al. Interpreting patterns of gene expression with self-organizing maps: methods and application to hematopoietic differentiation. Proc Natl Acad Sci USA 1999;96:2907–12. [DOI] [PMC free article] [PubMed] [Google Scholar]
- 22.McGill CJ, Brooks G. Cell cycle control mechanisms and their role in cardiac growth. Cardiovasc Res 1995;30:557–69. [PubMed] [Google Scholar]
- 23.Scott IC, Blitz IL, Pappano WN, et al. Mammalian BMP-1/Tolloid-related metalloproteinases, including novel family member mammalian Tolloid-like 2, have differential enzymatic activities and distributions of expression relevant to patterning and skeletogenesis. Dev Biol (Orlando) 1999;213:283–300. [DOI] [PubMed] [Google Scholar]
- 24.Ward NL, Hagg T. SEK1/MKK4, c-Jun and NFKappaB are differentially activated in forebrain neurons during postnatal development and injury in both control and p75NGFR-deficient mice. Eur J Neurosci 2000;12:1867–81. [DOI] [PubMed] [Google Scholar]
- 25.Sehl PD, Tai JTN, Hillan KJ, et al. Application of cDNA microarrays in determining molecular phenotype in cardiac growth, development, and response to injury. Circulation 2000;101:1990–99. [DOI] [PubMed] [Google Scholar]
- 26.Jahn L , Sadoshima J, Izumo S. Cyclins and cyclin-dependent kinases are differentially regulated during terminal differentiation of C2C12 muscle cells. Exp Cell Res 1994;212:297–307. [DOI] [PubMed] [Google Scholar]
- 27.Carmena M , Riparbelli MG, Minestrini G. Drosophila polo kinase is required for cytokinesis. J Cell Biol 1998;143:659–71. [DOI] [PMC free article] [PubMed] [Google Scholar]
- 28.Husmann I , Soulet L, Gautron J, et al. Growth factors in skeletal muscle regeneration. Cytokine Growth Factor Rev 1996;7:249–58. [DOI] [PubMed] [Google Scholar]
- 29.Pu SF, Zhuang HX, Marsh DJ, et al. Insulin-like growth factor-II increases and IGF is required for postnatal rat spinal motoneuron survival following sciatic nerve axotomy. J Neurosci Res 1999;55:9–16. [DOI] [PubMed] [Google Scholar]
- 30.Wood TL, Richert MM, Stull MA, et al. The insulin-like growth factors (IGFs) and IGF binding proteins in postnatal development of murine mammary glands. J Mammary Gland Biol Neoplasia 2000;5:31–42. [DOI] [PubMed] [Google Scholar]
- 31.Liu Q , Yan H, Dawes NJ, et al. Insulin-like growth factor II induces DNA synthesis in fetal ventricular myocytes in vitro. Circ Res 1996;79:716–26. [DOI] [PubMed] [Google Scholar]
- 32.Deuel TF, Zhang N, Yeh HJ, et al. Pleiotrophin: a cytokine with diverse functions and a novel signaling pathway. Arch Biochem Biophys 2002;397:162–71. [DOI] [PubMed] [Google Scholar]
- 33.Zhang N , Deuel TF. Pleiotrophin and midkine, a family of mitogenic and angiogenic heparin-binding growth and differentiation factors. Curr Opin Hematol 1999;6:44–50. [DOI] [PubMed] [Google Scholar]
- 34.Stuart RO, Bush KT, Nigam SK. Changes in global gene expression patterns during development and maturation of the rat kidney. Proc Natl Acad Sci USA 2001;98:5649–54. [DOI] [PMC free article] [PubMed] [Google Scholar]