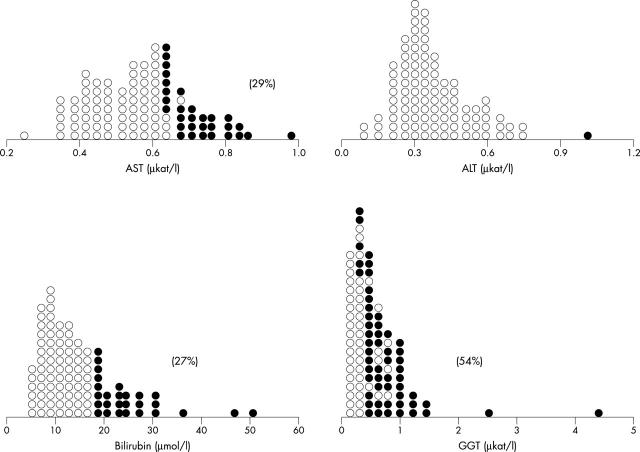
Figure 1.
Dot-density plot of the liver tests. Abnormal values (Z value > 2.0 or ⩽ 2.0) are represented by solid circles. The percentages of abnormal values are in parentheses. The overlap of normal and abnormal values is caused by different age related control values. ALT, alanine aminotransferase; AST, aspartate aminotransferase; GGT, γ glutamyltransferase.

