

Abstract
Measurements of drug levels in the fluids of the inner ear are required to establish kinetic parameters and to determine the influence of specific local delivery protocols. For most substances, this requires cochlear fluids samples to be obtained for analysis. When auditory function is of primary interest, the drug level in the perilymph of scala tympani (ST) is most relevant, since drug in this scala has ready access to the auditory sensory cells. In many prior studies, ST perilymph samples have been obtained from the basal turn, either by aspiration through the round window membrane (RWM) or through an opening in the bony wall. A number of studies have demonstrated that such samples are likely to be contaminated with cerebrospinal fluid (CSF). CSF enters the basal turn of ST through the cochlear aqueduct when the bony capsule is perforated or when fluid is aspirated. The degree of sample contamination has, however, not been widely appreciated. Recent studies have shown that perilymph samples taken through the round window membrane are highly contaminated with CSF, with samples greater than 2 μL in volume containing more CSF than perilymph. In spite of this knowledge, many groups continue to sample from the base of the cochlea, as it is a well-established method.
We have developed an alternative, technically simple method to increase the proportion of ST perilymph in a fluid sample. The sample is taken from the apex of the cochlea, a site that is distant from the cochlear aqueduct. A previous problem with sampling through a perforation in the bone was that the native perilymph rapidly leaked out driven by CSF pressure and was lost to the middle ear space. We therefore developed a procedure to collect all the fluid that emerged from the perforated apex after perforation. We evaluated the method using a marker ion trimethylphenylammonium (TMPA). TMPA was applied to the perilymph of guinea pigs either by RW irrigation or by microinjection into the apical turn. The TMPA concentration of the fluid sample was compared with that measured in perilymph prior to taking the sample using a TMPA-selective microelectrode sealed into ST. Data were interpreted with a finite element model of the cochlear fluids that was used to simulate each aspect of the experiment. The correction of sample concentration back to the perilymph concentration prior to sampling can be performed based on the known ST volume (4.7 μL in the guinea pig) and the sample volume. A more precise correction requires some knowledge of the profile of drug distribution along the cochlear prior to sampling. This method of sampling from the apex is technically simple and provides a larger sample volume with a greater proportion of perilymph compared to sampling through the RW.
Keywords: Perilymph, Perilymph sampling, Perilymph kinetics, Pharmacokinetics, Round window membrane, Cochlea
1. Introduction
There is increasing interest in the possibility of treating disorders of the inner ear by applying drugs directly to the cochlea. Clinically, local applications of gentamicin or glucocorticoids to the round window membrane of the cochlea are gaining widespread acceptance as appropriate treatments for Meniere’s disease and sudden hearing loss, respectively (Lalwani and McGuire, 2005; Rauch, 2004; Carey, 2004). Many other agents are being considered for clinical application and others are in widespread use in animal research.
A difficulty facing the development of local therapeutic protocols is a lack of confidence with regard to drug levels achieved in the cochlear fluids following specific local delivery protocols. The number of studies in which drug pharmacokinetics have been documented based on perilymph measurements is very limited. Many of the pharmacokinetic studies have used methods in which a perilymph sample was aspirated from the basal turn of scala tympani (ST) (e.g. Parnes et al., 1999; Hoffer et al., 2001; Laurell et al., 2002; Arnold et al., 2005). Problems with such measurements arise due to the small volume of perilymph in experimental animals. The total cochlear perilymph volume is less than 10 μL in guinea pigs, rats and gerbils (Thorne et al., 1999; Shinomori et al., 2001). This is compounded by the proximity of the cochlear aqueduct, which connects the perilymphatic compartment with the cerebrospinal fluid (CSF) of the cranium and which opens into the basal turn of ST. As fluid is withdrawn from the cochlea it is replaced by CSF entering through the cochlear aqueduct. A number of studies have shown that samples taken from the basal turn of ST are highly contaminated with CSF and do not represent pure “perilymph” samples (Scheibe et al., 1984; Hara et al., 1989; Salt et al., 2003). Published studies describing the kinetics of a drug in perilymph are obviously not meaningful if the fluid withdrawn from the cochlea and analyzed is not perilymph. The extent of this problem was clearly demonstrated in a study using the marker ion trimethylphenylammonium (TMPA) (Salt et al., 2003). In this study, the perilymph concentration of TMPA was monitored with a TMPA-selective microelectrode sealed into scala tympani. The measured perilymph concentration was compared with the TMPA concentration of a fluid sample aspirated through the RWM or through a fenestration on the bony wall of ST. The study confirmed that fluid samples taken from the basal turn of ST were highly contaminated with CSF. It was estimated that 1 uL samples taken through the round window contained approximately 80% perilymph, but 10 μL samples taken in this way contained less than 20% perilymph. The data in a number of pharmacokinetic studies have been based on 10 μL samples taken from the basal turn of ST (Parnes et al., 1999; Arnold et al., 2005), with one of these studies (Parnes et al., 1999) taking four samples of this volume over a period of time. A detailed analysis of this study showed that the perilymph drug concentration could have been an order of magnitude (10×) higher than that indicated by the sample concentration (Plontke and Salt, 2003).
Additional technical problems occur when sampling perilymph through the bony otic capsule. As perilymph is held under a positive hydrostatic pressure due to the connection with CSF, it immediately leaks as soon as the bony otic capsule is perforated. The rate of leakage has been estimated in guinea pigs to be 0.2-1.0 μL/min (Salt and Stopp, 1979; Salt et al., 1991) and can be higher with larger perforations. Depending on the site and the size of the perforation, this means that within a few minutes (or less for species with lower perilymph volumes such as mice or rats) the perilymph may be lost into the middle ear space and replaced in the cochlea by CSF. This problem makes it extremely difficult to collect pure perilymph samples from ST. As a result of this uncontrolled leakage problem, perilymph sampling through the round window membrane (RWM) is often regarded as “safer” and more consistent. Thus, for experiments in which auditory function is the main interest and where it is important to establish the drug level in perilymph of ST, the investigator has a major technical difficulty to deal with. At present, there is no satisfactory method to collect ST perilymph without the risk of a high degree of CSF contamination.
In the present study, we have evaluated a novel method for sampling the perilymph from scala tympani, which makes use of the observation that when the cochlea is perforated, the perilymph leaks out driven by CSF pressure. The method involves treating the apical regions of the cochlea to make the outer surface hydrophobic. When the cochlea is then perforated, the native perilymph is no longer lost to the middle ear space, but is available to be collected in a capillary tube. When the volume taken is larger than the total ST perilymph volume, we can be sure that the sample contains virtually all the ST perilymph, with an additional volume of CSF that has “rinsed” through the perilymphatic compartment.
2. Methods
The experiments involved sealing a TMPA-selective microelectrode into the basal turn of ST so that the marker concentration could be monitored continuously with time. With the electrode in place, perilymph was loaded with TMPA, either by irrigating TMPA containing solution across the RWM, or by injecting it into the cochlear apex. After an equilibration period, a single fluid sample was obtained from the cochlear apex. TMPA concentration changes in the basal turn were monitored during the sampling procedure. The TMPA content of the fluid samples was determined in vitro using TMPA-selective microelectrodes. The experiments were interpreted using detailed simulations of the experiment performed with our established finite-element cochlear fluids simulation program (http://oto.wustl.edu/cochlea/model.htm). This program permits simulation of the major aspects of the experiment, including marker loading through the RWM or by injection, marker spread through the cochlea by diffusion, and all the fluid movements associated with sampling. The concentration time course measured from the electrode in the basal turn was used to quantify the rate of TMPA entry and its spread along ST, and then to document the fluid flows associated with sampling. The sample concentration predicted by the simulator was compared with the measured concentration of the fluid sample taken from the apex.
2.1. Animal preparation
The studies used 17 pigmented, NIH strain guinea pigs, anesthetized with 100 mg/kg sodium thiobutabarbital (Inactin). Anesthetic supplements were given regularly through an intravenous line in the external jugular vein. The trachea was cannulated and the animal was artificially respired, maintaining an end-tidal CO2 level near 38 mmHg (5%). A thermistorcontrolled DC powered heating blanket was used to maintain a rectal temperature of 38 °C. The animal was mounted in a headholder and the cochlea exposed by the ventrolateral approach. Prior to the placement of electrodes, animals were give pancuronium bromide as a muscle relaxant. Experimental studies were performed under protocols approved by the Animal Studies Committee of Washington University, protocol numbers 20020010 and 20040209.
2.2. Ion selective electrodes
Double-barreled glass pipettes (one barrel with fiber and one without fiber) were pulled and stored in a humidity cabinet at 40 °C, 70% humidity overnight. The barrel without fiber was silanized by exposure to dimethyldichlorosilane vapor (Sigma, St. Louis) followed by baking at 140 °C for 1 h. Electrodes were beveled to a tip diameter of 2-4 μm. The silanized, ion barrel was filled with 500 mM KCl and the reference barrel was filled with 500 mM NaCl. A small column of TMPA-selective ion exchanger was drawn into the tip by suction. The ion exchanger was made as 5% potassium tetrakis(4-chlorophenyl)borate in 2-nitrophenyloctylether (Fluke/Sigma, NY) and was pre-equilibrated with aqueous TMPA solution prior to use. For in vivo measurements, electrodes were calibrated in standards containing 0, 2, 20, 200 and 2000 μM TMPA in a background of artificial perilymph (see below) at 37 °C. To measure the TMPA content of samples taken from the cochlea, both samples and standards were held in wells made by drilling a Teflon block and measurements were made at room temperature.
2.3. Sealing ion electrodes into perilymph
To seal the TMPA-selective electrode into the perilymphatic space, the bone overlying ST in the basal turn was first shaved thin with a flap knife (Mueller AU13400). Before perforating the bone, the shaved area was first coated with thin cyanoacrylate (CA) glue, followed by a thin layer of two-part silicone adhesive (WPI Kwik-Cast silicone elastomer sealant). The CA glue was used to ensure the silicone was well attached to the bone. Using a fine 30° pick (Storz N170580), a small 30-50 μm fenestra was made into ST through the glue and bone. After the electrode was inserted into ST through the fenestra, it was possible to dry the site completely by touching it with a wick of paper tissue, while simultaneously applying a small droplet of thin CA to the site. When it was verified that there was no perilymph leak, the entire site was covered with an additional layer of silicone adhesive. The mean distance from the electrode insertion site to the lip of the round window measured along the bony wall of ST was 2.03 mm (S.D. 0.29, n = 17). The electrode insertion procedure did result in small loss of perilymph, which was replaced by CSF but this loss occurred before any TMPA was applied. Typically, electrodes were sealed in place for at least 15 min before TMPA application was initiated. This perforation is only required for the specific measurements in this study and is not required for most applications of the apical sampling procedure.
2.4. TMPA loading of perilymph
When the TMPA-selective electrode was sealed in place, TMPA was applied to perilymph. In one group of 12 animals TMPA was applied by irrigating solution containing 2 mM TMPACl across the RWM at 5 μl/min. The background medium for this solution was an artificial perilymph containing (in mM)—NaCl: 125; KCl: 3.5; NaHCO3: 25; MgCl2: 1.2; CaCl2: 1.3; NaH2PO4: 0.75; C6H12O6: 5.0. In a second group of five animals, a 1 mM TMPA solution was injected directly into the apical turn of scala vestibuli at 0.8 μl/min for 15 min (total volume injected: 12 μl). In these experiments, the injection pipette was sealed into the apex using similar methods to those for sealing the recording electrode into the basal turn (section iii above).
2.5. Sampling from the cochlear apex
For experiments with TMPA loaded via the RWM, the auditory bulla and RW niche were dried with tissue wicks prior to sampling, and the sampling region was rinsed twice with artificial perilymph. These procedures took 5-8 min. For experiments in which TMPA loading was performed by apical injection, there was some concern that because the total volume injected was greater than the volume of ST, the CSF in the vicinity of the cochlear aqueduct could be contaminated with TMPA-containing fluid. We therefore waited for a 10 min period before sampling, to allow any TMPA in CSF to be dispersed.
Collection of all the fluid emerging from the cochlear apex after perforation was made possible by constructing a silcone “cup” around the apex, using the procedure summarized in Fig. 1. The cup was constructed prior to the TMPA loading experiment. First, the mucosa was removed from the cochlear apex with a cotton swab and the bone was allowed to dry (Fig. 1A). A small drop of thin CA adhesive was then applied to the apex and spread thinly over the bone (Fig. 1B). Layers of two-part silicone adhesive (WPI Kwik-Cast) were then built up around the apex, filling the auditory bulla medial to the apex but applying only a thin layer over the part of scala vestibuli in the apical turn that was to be perforated. Each layer was allowed to harden slightly before adding more. Up to five layers of silicone were added to the outer regions, until a complete cup was formed around the cochlear apex (Fig. 1C). At the time of sampling, a 30° pick (Storz N170580, 1/3 mm 30° oval window pick) was used to make a 50-100 μm diameter perforation of the bone overlying scala vestibuli in the middle of the silicone cup. Fluid immediately started emerging, driven by CSF pressure, and formed a droplet in the middle of the hydrophobic silicone cup. A calibrated capillary sample tube (VWR #53432-728 10 μL micropipet) was held by hand to contact with the fluid at the apex, so that the fluid was drawn into the capillary (Fig. 1D). The rate of fluid accumulation in the capillary was about 1-2 μL/min. In the present study, it took an average of 6.5 min (S.D. 1.8 min, n = 17) to collect a 10 μL fluid sample.
Fig. 1.
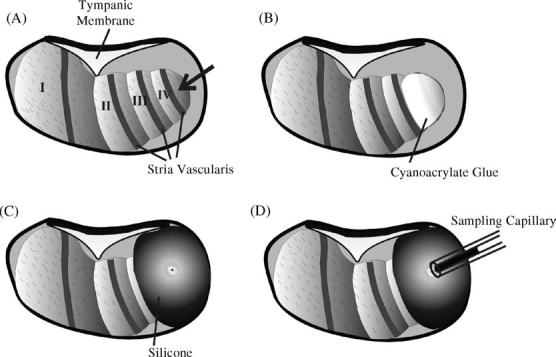
Summary of the apical perilymph sampling procedure. (A) With the cochlea exposed by a ventral approach, the mucosa on the apical turns is removed and the bone is allowed to dry. (B) A thin layer of cyanoacrylate glue is applied to the bone over the apical turns. (C) A “cup” is constructed around the cochlear apex using two-part silicone, applying the silicone only thinly over the region to be perforated. When the sample is required, the apex is perforated with a fine pick. (D) All fluid efflux from the apical perforation is collected into a calibrated capillary tube.
2.6. Simulation of each experiment
The data from each experiment was interpreted by simulation of the precise experimental conditions, including the electrode locations and the timing of events. This was performed with a finite-element cochlear fluids simulation program, version 1.6e, developed by our group and made available at http://oto.wustl.edu/cochlea/. The program incorporates the anatomic dimensions of the cochlear scalae and round window membrane of the guinea pig. The diffusion coefficient used for TMPA was 1.01 × 10⁻⁹ m2/s. The initial loading of ST was accomplished by simulating TMPA entry across the RW membrane, varying the numeric values for RW permeability and clearance from ST until the calculated curve best fit the time course measured by the basal turn electrode (as detailed in Salt and Ma, 2001). Based on this analysis the concentration gradient of TMPA along ST was calculated so that the ST perilymph concentration (summed across the entire volume of ST) could be established. The procedure of fluid sampling was incorporated into the model by simulating volume removal from the sampling site and flow from the cochlear aqueduct towards the sampling site at a rate and with duration based on those used in each individual experiment. The TMPA concentration of the volume entering at the site of the aqueduct was assumed to be zero. By accumulating the total amount of solute and the total volume removed from the site, the final sample concentration could be calculated. Parameters for the sampling procedure (rate and duration of collection) were based on the sample collection in each individual experiment. The location of ion-selective electrodes in the basal turn of ST was established by measurement along the outer wall of the scala from the bony margin of the RW. A correction of 0.13 mm was added to distance measurements along the bony wall, to allow for the region of ST basal to this measurement point.
3. Results
In order to validate the apical perilymph sampling method we designed the studies to first load scala tympani with TMPA as a marker, while monitoring TMPA concentration in perilymph. A fluid sample was then taken from the cochlear apex and its TMPA concentration was measured in vitro. As the TMPA measured in perilymph only represents the concentration at a single, specific location, we used our cochlear fluids simulation model to fit the measured time course and hence to define the amount and rate of spread of TMPA along the scala. From this simulation, the concentration profile along the length of scala tympani was defined which, combined with the known flow of fluid along the scala during sampling, allowed us to predict the concentration of the sample.
An example of the results obtained with local application of TMPA to the RWM is shown in Fig. 2. The left panels show recorded and calculated concentration changes as a function of time and the right panels show the inferred concentration distributions along the length of scala tympani at specific time points. In this experiment, the TMPA concentration changes were measured by a TMPA-selective electrode 2.18 mm from the base of ST and are shown in Fig. 2A. Concentration increases progressively during the 90 min period with solution containing 2 mM TMPA irrigated across the RWM. Simulation of the loading of ST was comparable with the recorded curve when a RWM permeability of 11 × 10-8 m/s and a ST clearance half-time of 900 min was used. During the period when the RWM is rinsed with TMPA-free solution and the RW niche dried, the measured concentration was noisy, due to movements of the experimenter interfering with the high-impedance TMPA-selective electrode. Nevertheless, a downward trend in the measured concentration was apparent, which is demonstrated in the simulation when TMPA influx through the RWM is terminated. When the cochlear apex was perforated and sample collection commenced, the measured concentration showed a transient increase, followed by a rapid decrease towards zero. The calculated concentration profile along ST prior to sampling is shown in Fig. 2D and is based on the known rate of TMPA diffusion and TMPA losses due to clearance from perilymph. It is apparent that a substantial concentration gradient exists along the scala, with the location of the TMPA-selective electrode at an intermediate point on the profile. The overall ST concentration of TMPA, estimated by summing the solute and volume amounts over the entire ST, was 141.6 μM. The initial spike in concentration seen at the start of sampling can be seen to occur because solution of higher TMPA concentration is present in the scala basal to the measurement site. As the apically-directed flow of perilymph carries this higher concentration solution past the measurement location, the measured concentration transiently increases. The subsequent TMPA concentration decrease occurs as perilymph is replaced by TMPA-free CSF. Simulation of the sample, by accumulating the solute and volume exiting at the apex in this animal indicated the 10 μl sample would be expected to contain 54.7 μM TMPA. The measured TMPA concentration of the sample taken in this experiment was 78.9 μM.
Fig. 2.
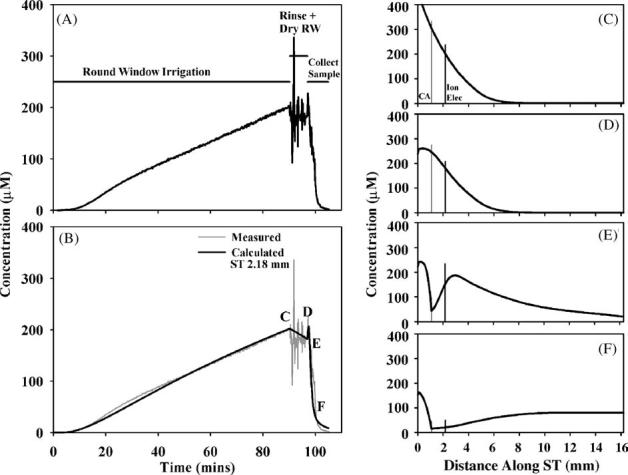
Interpretation of an experiment in which TMPA was loaded into perilymph by round window membrane (RWM) application of a 2 mM solution. (A) Concentration measured in the basal turn of scala tympani during RW irrigation of TMPA, rinsing and drying the RW niche, and during sample collection after perforation of the cochlear apex. (B) Simulation of the concentration measured at the cochlear location where the ion electrode was located. The measured curve is shown pale gray for comparison. (C-F) Calculated longitudinal distribution of TMPA along ST at the four time points indicated in panel (B). The locations of the cochlear aqueduct (CA) and of the TMPA-selective measurement electrode (Ion Elec) are indicated by vertical lines.
An experiment with TMPA loaded into perilymph by injection is shown in Fig. 3. In this experiment TMPA was measured in the basal turn, 2.16 mm from the base, while 1 mM TMPA solution was injected into SV at the cochlear apex for 15 min at 0.8 μl/min. With this injection protocol, the outlet for the injection is the cochlear aqueduct so that the injected solution flows along ST from the apex towards the basal turn. When injection stopped, the preparation was left for a 10 min period before the apex was perforated and the perilymph sample collected. During the perilymph sampling period, the TMPA concentration at the measurement point in ST rapidly declined. Simulation of this experiment required a TMPA clearance half-time from scala tympani of 19 min, and the presence of a parallel compartment to ST with 0.19 mm2 cross sectional area and an accessibility factor of 17% with respect to free diffusion. With these parameters, the concentration time course at the basal measurement location was close to the measured time course. The concentration profile prior to sampling (Fig. 3D) shows a more uniform distribution of marker with distance with this application protocol. The summed TMPA concentration for all of ST was calculated to be 649.9 μM. The calculated concentration of a 10 μL sample from the apex from this preparation was 437.7 μM, while the TMPA concentration of the sample measured in vitro was 463.7 μM.
Fig. 3.
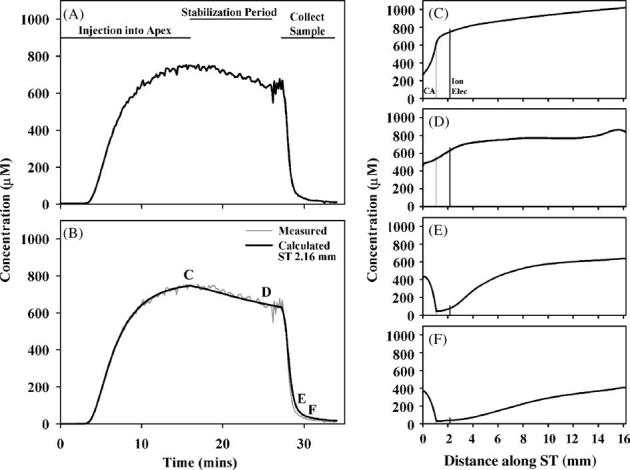
Interpretation of an experiment in which TMPA was loaded into perilymph by injection of a 1 mM at the apex of the cochlea. (A) Concentration measured in the basal turn of scala tympani during the injection, during a stabilization period with no injection and then during perilymph sampling from the apex. (B) Simulation of the concentration measured at the cochlear location where the ion electrode was located. The measured curve is shown pale gray for comparison. (C-F) Calculated longitudinal distribution of TMPA along ST at the four time points indicated in panel (B).
For both application protocols the TMPA concentrations of samples taken from the cochlear apex were compared with sample concentrations predicted by simulation of the individual experiment. For RW application of TMPA, the slope of a best-fit line fitted to the predicted versus measured samples was 1.059 which was not significantly different from the theoretical expected slope of 1 (raw data not shown). With apical injection of TMPA, the line fitted to predicted versus measured samples had a slope 1.056 which was also not significantly different from 1 (raw data not shown). While these comparisons between the simulations and measured data serve to validate the simulation method, they are of limited value toward the goal of interpreting measured sample concentrations in terms of the ST concentration of substance. The comparison between measured and predicted values are therefore given in a more relevant format in Fig. 4, where the measured sample concentration is compared instead with the calculated ST concentration prior to sampling. This is in accordance with the ultimate goal of the analysis of samples, which is to infer from the perilymph concentration of the substance from the measured sample concentration using a correction factor. Interpretation of this figure requires consideration of the basis of the correction process. At the simplest level, the correction of concentration measured in a 10 μL fluid sample (Cs) to the concentration in scala tympani prior to sampling (CST) can be performed by allowance for the volumes involved. The volume of ST perilymph in the guinea pig has been estimated to be 4.7 μL (Thorne et al., 1999). Assuming that the sample taken from the apex contains all the solute in ST with the balance of the sample volume consisting of CSF that had washed through the scala, a correction can be performed as follows:
where the correction factor Fc = sample volume/ST volume = 10/4.7 = 2.32. Quantitative analysis of our data, however, suggests that the correction factor required depends on the experimental situation in the cochlea. The processes involved are demonstrated qualitatively in Fig. 5. In an experiment where drug is located primarily in the basal turn of the cochlea (Fig. 5; upper row) as the drug-containing perilymph moves towards the apex during the sampling process there will be a loss of drug to adjacent scalae that also have low drug concentrations. Thus, the sample would be expected to contain less drug than expected based in the ST concentration. In contrast, when the drug is dispersed throughout the cochlea (Fig. 5; lower row) the adjacent scalae will be loaded with drug. In this situation, as the sample is collected, drug from adjacent scalae will diffuse into ST as the sample is taken and the sample will contain more drug than expected, based on the ST concentration. In Fig. 4, the dotted lines indicate the simple, volume corrected relationship in which the ST concentration equals the sample concentration multiplied by 2.3. For the RW application protocol, the line fitted to the sample concentration data compared to the calculated ST concentration was indeed of higher slope (2.6) but not significantly so. This is consistent with the samples showing lower concentration than expected, as explained by Fig. 5. In comparison, for the apical injection protocol, samples were of significantly higher concentration than predicted based on the ST concentration, with the best-fit line for these data having a slope of 1.6. This analysis shows that as the perilymph interacts with adjacent compartments as the sample is taken, our ability to correct back to the ST drug concentration may be limited, unless the experiment is modeled in detail to account for these effects.
Fig. 4.
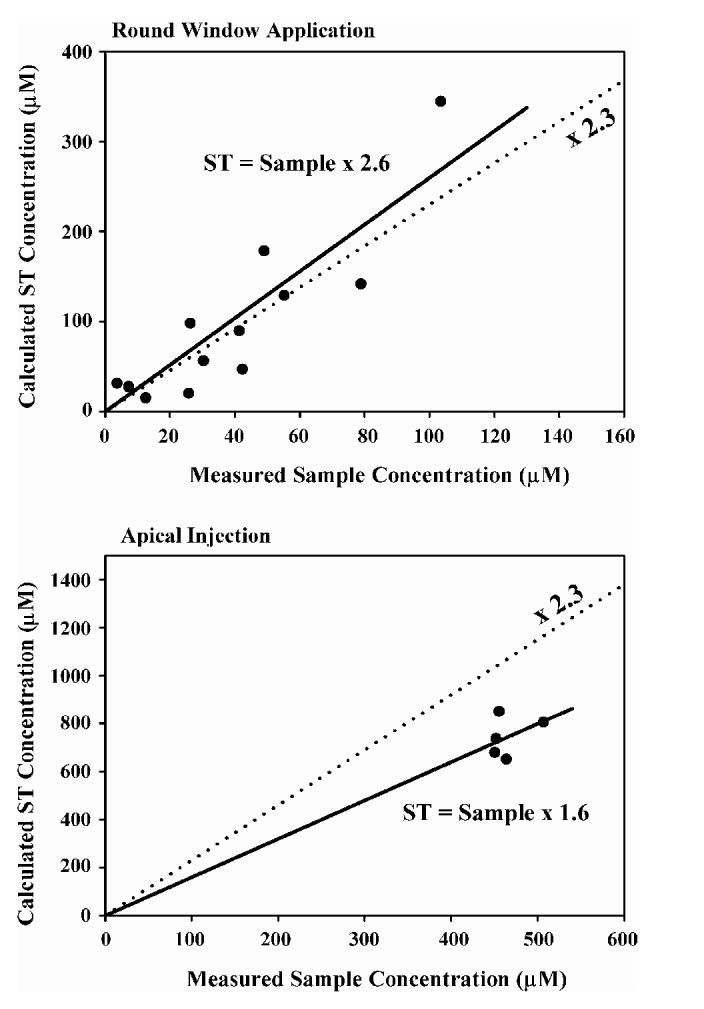
Correlation of the measured TMPA concentration of the fluid samples taken from the cochlear apex with the calculated scala tympani (ST) TMPA concentration prior to sampling. The slope of the line represents a “correction factor” whereby sample concentrations can be corrected back to the ST concentration prior to sampling. The upper panel shows data for TMPA applied to the round window membrane and the lower panel shows data with injections of marker into the cochlear apex. The dashed line shows the calculated relationship, based on the ST volume and the sample volumes. For round window application, the line which best fit the data had a slope of 2.6, while for apical injection experiments the best-fit slope was 1.6.
Fig. 5.
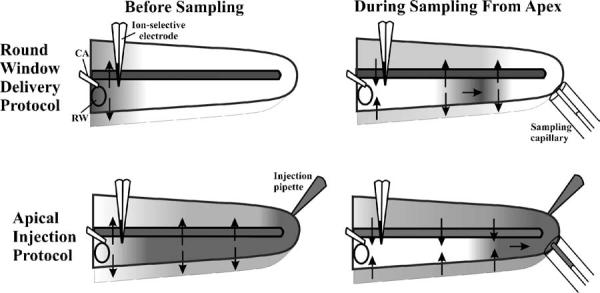
Explanation for differences in the relationship between sample concentration and ST concentration with different drug delivery protocols. For RW delivery, drug is at high concentration in the basal turn, and a lower concentration elsewhere. As ST perilymph moves apicalwards during sampling, drug will be lost to adjacent compartments with low drug levels, so the sample may have a lower amount of drug than expected. In contrast, when the entire cochlea is loaded with drug, such as by apical injection, all compartments become loaded with drug. As the sample is taken, will diffuse from adjacent compartments into the lower concentration fluid, some of which will be included in the sample. The sample will therefore contain more drug than expected.
In Fig. 4, it is apparent that there is considerable variability in the calculated ST concentration of TMPA in different animals, reflecting a wide variation of the amount of TMPA measured. This variability appears to originate from a substantial variation in RWM permeability to TMPA entry from the RW niche into ST perilymph. Our analysis found the RWM permeability used to best fit the scala concentration data averaged 13.7×10⁻⁸ m/s (S.D. 21.7 × 10⁻⁸ m/s, n = 12). While the variability in permeability of the RWM to TMPA is comparable to that reported in prior studies, the mean permeability value in the present study was considerably lower than the permeability found in guinea pigs presented as a previous study (mean 53.7×10⁻⁸ m/s; n =8; Salt et al., 2003). One substantial difference between these two studies was the method used to seal the ion-selective electrodes into ST. In the previous study, sealing to the bone at the electrode insertion site was accomplished by blowing desiccated air onto the insertion site while cyanoacrylate glue was simultaneously applied. In the present study, a method was utilized in which the bone was coated with silicone adhesive before the bone was perforated so that the use of desiccated air was not required. We therefore evaluated whether desiccation of the membrane could influence the RWM permeability to TMPA. In the experiment shown in Fig. 6, the TMPA-selective electrode was first sealed into the basal turn of ST without the use of desiccated air. TMPA marker was applied to the RWM for 60 min during which the concentration increase was monitored in ST. Simulation of this experiment (Fig. 6, lower panel) required a RWM permeability value of 2.4 × 10⁻⁸ m/s to best fit the initial time course of TMPA entry into perilymph. At time point A, the delivery pump was checked and verified to be running, as the rate of TMPA entry in this animal was slow. At time point B, all TMPA solution was removed from the middle ear space using wicks that did not touch the RWM. Desiccated air was then briefly blown into the bulla (for a 30 s period, similar to that previously required to seal electrodes in place). The TMPA marker solution was then reapplied to the round window niche at the same concentration and delivery rate. Following this brief procedure, the rate of TMPA concentration increase in ST became substantially faster, consistent with an increased permeability of the RWM to TMPA caused by the desiccation procedure. Simulation of the experiment required a sustained increase in the RWM permeability throughout the subsequent application procedure to 8.2 × 10⁻⁸ m/s in order for the calculated TMPA time course to fit the measured data. This demonstrates that a brief drying of the RWM by blowing desiccated air into the bulla in this case caused a 4 fold increase in RWM permeability to TMPA. The difference in permeability between the present and prior studies is approximately a factor of 4 and is likely to be accounted for by this methodological difference.
Fig. 6.
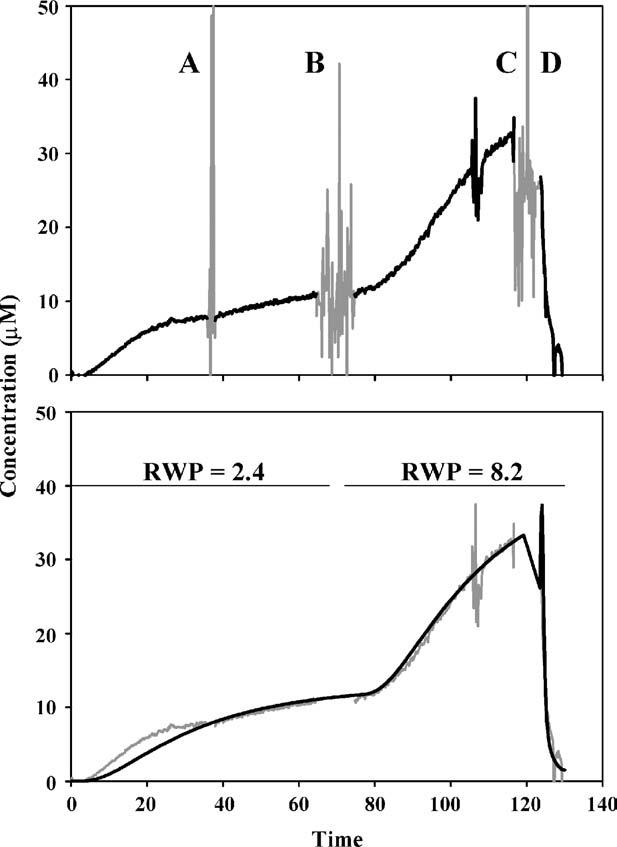
Demonstration of the sensitivity of round window membrane permeability (RWP) to manipulation. Upper panel: In this experiment marker was applied for 60 min during which the concentration was monitored in ST. At time point A, the delivery pump was verified to be running. At time point B, the middle ear was wicked dry and desiccated air was blown into the bulla for a 30 s period (similar to the drying previously required to seal electrodes in place). The TMPA marker solution was then reapplied to the round window niche. The rate of concentration increase was subsequently much higher, consistent with an increased RWP for TMPA. At time point C, the niche was dried and at time point D perilymph was sampled from the apex. Lower panel: Simulation of the experiment. During the initial 70 min, a RWP of 2.4 × 10⁻⁸ m/s accounted for the rate of tracer increase, while in the period after 80 min, a permeability of 8.2 × 10⁻⁸ m/s fitted the data. This suggests that brief drying with desiccated air induced a four-fold increase in RWP.
4. Discussion
This study presents a novel method for obtaining larger samples of perilymph from scala tympani of the cochlea, by collecting perilymph, without any loss, from the cochlear apex. This approach could help resolve a serious problem that has confounded studies of perilymph kinetics for many years. Even though a number of studies have shown that perilymph sampled from the basal turn of scala tympani is highly contaminated with CSF (Scheibe et al., 1984; Hara et al., 1989; Salt et al., 2003), the lack of an alternative methodology has led many groups to continue using basal turn sampling methods (Parnes et al., 1999; Hoffer et al., 2001; Laurell et al., 2002; Arnold et al., 2005). The published values from these studies are commonly thought to represent the perilymph drug concentration, when the sample may contain a concentration of drug that may be up to an order of magnitude lower than the original perilymph concentration (Salt et al., 2003). This represents a major source of error in our understanding of perilymph pharmacokinetics. Errors of this magnitude, which underestimate the amount of drug present in the cochlea, could have significant clinical consequences if the study is used to justify the presence of a “safe” drug level in the ear. It also adds to confusion and variability when comparing kinetic studies, and has been shown to account to major differences between experimental studies published by different groups (Plontke and Salt, 2003).
The content of samples taken from the apex will vary depending on the total volume taken. For very small volumes, the sample will be dominated by perilymph of the apical turns. As volume is increased, the sample will contain increasing amounts of perilymph from the basal turns and of CSF. The samples taken from the apex in the present study can be regarded as being comprised of virtually all the ST contents with an additional volume of CSF that has “rinsed” through the fluid space. In this respect, the method is efficient in making sure that the maximum amount of solute present in ST perilymph prior to sampling is accumulated in the sample pipette. Nevertheless, the study also demonstrates a number of technical issues that must be dealt with to establish the concentration of a substance in the cochlear fluids. In theory, if a very small sample (for example, a few hundred nanoliters) of perilymph is sufficient to perform analysis then such a small volume could be taken through the RWM or possibly aspirated within seconds of the bony wall of the cochlea being perforated. This would represent a “pure” sample of perilymph taken from the sampling location and interpretation would be straightforward. In practice, however, most assays for drugs within the therapeutic range require larger sample volumes for the drug to be detectable after the required sample dilution. Resolution is usually limited by the sample volume so there is often a need for as large a sample volume as possible. Correction of the sample concentration back to a presumed concentration in ST perilymph can be performed using a multiplier of 2.3, based on a 10 μL sample take from a guinea pig with 4.7 μL of ST perilymph. However, comparing our measurements with different delivery protocols (Fig. 4) shows that an accurate correction is only possible through detailed modeling of the experiment. The amount of drug accumulated in the sample depends on the longitudinal distribution of drug prior to sampling. This appears to be an unavoidable consequence of fluid movements through the narrow fluid-filled spaces of the inner ear, where inter-compartment differences in drug levels result in passive movements of drug driven by diffusion. The errors induced by such solute movements are sizeable and cannot be ignored. For example, in the apical injection condition, when the entire cochlea was loaded with TMPA, the results were better fit with a correction factor of 1.6 rather than the factor of 2.6 which best fit the RW delivery condition. Potential errors can be minimized, however, by the use of detailed simulations of the specific experimental conditions, in which the sample concentration for the specific application method is predicted. In the absence of a detailed analysis of this type the potential for errors in the interpretation of the composition of a single sample in terms of perilymph concentration appears unavoidable. Although significant, such errors are likely to be far smaller than those associated with sampling from the basal cochlear turn, where the amount of perilymph in the sample is low.
The present study found RWM permeability to be extremely variable between different animals. A similar high variability in permeability has been reported in other studies (Salt and Ma, 2001;Salt et al., 2003; Hahn et al., 2005). The sources of variability are uncertain at the present time but permeability appears to be influenced by the hydrostatic pressure difference across the membrane (Salt et al., 2003), whether the membrane is allowed to dry (this study), and on the chemical composition of the solution that contacts the RWM (Imamura and Adams, 2003). These observations may have clinical relevance as they demonstrate that small changes in experimental protocol may influence RWM permeability and thereby affect the amount of drug entering the perilymph.
Acknowledgment
This study was supported by research grant RO1 DC01368 from the National Institute on Deafness and Other Communication Disorders, National Institutes of Health.
Footnotes
- CSF
- cerebrospinal fluid
- RW
- round window
- RWM
- round window membrane
- TMPA
- trimethylphenylammonium
- ST
- scala tympani
References
- Arnold W, Senn P, Hennig M, Michaelis C, Deingruber K, Scheler R, Steinhoff H, Riphagen F, Lamm K. Novel slow- and fast-type drug release round-window microimplants for local drug application to the cochlea: an experimental study in guinea pigs. Audiol Neurotol. 2005;10:53–63. doi: 10.1159/000082575. [DOI] [PubMed] [Google Scholar]
- Carey J. Intratympanic gentamicin for the treatment of Meniere’s disease and other forms of peripheral vertigo. Otolaryngol Clin North Am. 2004;37:1075–90. doi: 10.1016/j.otc.2004.06.002. (Review) [DOI] [PubMed] [Google Scholar]
- Chelikh L, Teixeira M, Martin C, Sterkers O, Ferrary E, Couloigner V. High variability of perilymphatic entry of neutral molecules through the round window. Acta Otolaryngol. 2003;123:199–202. doi: 10.1080/00016480310001042. [DOI] [PubMed] [Google Scholar]
- Hara A, Salt AN, Thalmann R. Perilymph composition in scala tympani of the cochlea: influence of cerebrospinal fluid. Hear Res. 1989;42:265–71. doi: 10.1016/0378-5955(89)90150-0. [DOI] [PubMed] [Google Scholar]
- Hahn H, Kammerer A, DiMauro A, Zenner H-P, Salt AN, Plontke S. The use of microdialysis for quantification of dexamethasone and flourescein entry into scala tympani during round window application; 28th Midwinter Research Meeting of the ARO; 2005; p. 306. (Abstract) [DOI] [PMC free article] [PubMed] [Google Scholar]
- Hoffer ME, Allen K, Kopke RD, Weisskopf P, Gottshall K, Wester D. Transtympanic versus sustained-release administration of gentamicin: kinetics, morphology, and function. Laryngoscope. 2001;111:1343–57. doi: 10.1097/00005537-200108000-00007. [DOI] [PubMed] [Google Scholar]
- Imamura S, Adams JC. Distribution of gentamicin in the guinea pig inner ear after local or systemic application. J Assoc Res Otolaryngol. 2003;4:176–95. doi: 10.1007/s10162-002-2036-8. [DOI] [PMC free article] [PubMed] [Google Scholar]
- Lalwani AK, McGuire JF. Pharmacologic treatment of the cochlea and labyrinth. In: Cummings CW, et al., editors. Otolaryngology Head and Neck Surgery. 4th ed. Elsevier Mosby; Philadelphia: 2005. pp. 2944–76. [Google Scholar]
- Laurell G, Teixeira M, Sterkers O, Bagger-Sjoback D, Eksborg S, Lidman O, Ferrary E. Local administration of antioxidants to the inner ear. Kinetics and distribution. Hear Res. 2002;173:198–209. doi: 10.1016/s0378-5955(02)00613-5. [DOI] [PubMed] [Google Scholar]
- Parnes LS, Sun AH, Freeman DJ. Corticosteroid pharmacokinetics in the inner ear fluids: an animal study followed by clinical application. Laryngoscope. 1999;109:1–17. doi: 10.1097/00005537-199907001-00001. [DOI] [PubMed] [Google Scholar]
- Plontke SKR, Salt AN. Quantitative interpretation of corticosteriod pharmacokinetics in inner ear fluids using computer simulations. Hear Res. 2003;182:34–42. doi: 10.1016/s0378-5955(03)00138-2. [DOI] [PubMed] [Google Scholar]
- Rauch SD. Intratympanic steroids for sensorineural hearing loss. Otolaryngol Clin North Am. 2004;37:1061–74. doi: 10.1016/j.otc.2004.04.004. (Review) [DOI] [PubMed] [Google Scholar]
- Salt AN, Stopp PE. The effect of cerebrospinal fluid pressure on perilymphatic flow in the opened cochlea. Acta Otolaryngol. 1979;88(198):202. doi: 10.3109/00016487909137160. [DOI] [PubMed] [Google Scholar]
- Salt AN, Inamura N, Thalmann R, Vora AR. Evaluation of procedures to reduce fluid flow in the fistulized guinea pig cochlea. Acta Otolaryngol. 1991;111(899):907. doi: 10.3109/00016489109138428. [DOI] [PubMed] [Google Scholar]
- Salt AN, Ma Y. Quantification of solute entry into cochlear perilymph through the round window membrane. Hear Res. 2001;154:88–97. doi: 10.1016/s0378-5955(01)00223-4. [DOI] [PubMed] [Google Scholar]
- Salt AN, Kellner C, Hale S. Contamination of perilymph sampled from the basal cochlear turn with cerebrospinal fluid. Hear Res. 2003;182:24–33. doi: 10.1016/s0378-5955(03)00137-0. [DOI] [PubMed] [Google Scholar]
- Scheibe F, Haupt H, Bergmann K. On sources of error in the biochemical study of perilymph (guinea pig) Arch Otorhinolaryngol. 1984;240:43–8. doi: 10.1007/BF00464343. [DOI] [PubMed] [Google Scholar]
- Shinomori Y, Spack DS, Jones DD, Kimura RS. Volumetric and dimensional analysis of the guinea pig inner ear. Ann Otol Rhinol Laryngol. 2001;110:91–8. doi: 10.1177/000348940111000117. [DOI] [PubMed] [Google Scholar]
- Thorne M, Salt AN, DeMott JE, Henson MM, Henson OW, Gewalt SL. Cochlear fluid space dimensions for six species derived from reconstructions of three-dimensional magnetic resonance images. Laryngoscope. 1999;109:1661–8. doi: 10.1097/00005537-199910000-00021. [DOI] [PubMed] [Google Scholar]