

Abstract
Little is known about the neural mechanisms that control attentional modulation of deviance detection in the auditory modality. In this study, we manipulated the difficulty of a primary task to test the relation between task difficulty and the detection of infrequent, task-irrelevant deviant (D) tones (1300 Hz) presented among repetitive standard (S) tones (1000 Hz). Simultaneous functional magnetic resonance imaging (fMRI)/event-related potentials (ERPs) were recorded from 21 subjects performing a two-alternative forced-choice duration discrimination task (short and long tones of equal probability). The duration of the short tone was always 50 msec. The duration of the long tone was 100 msec in the easy task and 60 msec in the difficult task. As expected, response accuracy decreased and response time (RT) increased in the difficult compared with the easy task. Performance was also poorer for D than for S tones, indicating distraction by task-irrelevant frequency information on trials involving D tones. In the difficult task, an amplitude increase was observed in the difference waves for N1 and P3a, ERP components associated with increased attention to deviant sounds. The mismatch negativity (MMN) response, associated with passive deviant detection, was larger in the easy task, demonstrating the susceptibility of this component to attentional manipulations. The fMRI contrast D > S in the difficult task revealed activation on the right superior temporal gyrus (STG) and extending ventrally into the superior temporal sulcus, suggesting this region’s involvement in involuntary attention shifting toward unattended, infrequent sounds. Conversely, passive deviance detection, as reflected by the MMN, was associated with more dorsal activation on the STG. These results are consistent with the view that the dorsal STG region is responsive to mismatches between the memory trace of the standard and the incoming deviant sound, whereas the ventral STG region is activated by involuntary shifts of attention to task-irrelevant auditory features.
INTRODUCTION
Processing of unattended auditory information has been the subject of numerous electrophysiological studies, yet the neural correlates of this processing remain elusive. A relatively automatic electrophysiological response, termed the mismatch negativity (MMN) (Näätänen, 1992), is elicited in the auditory modality following irregularities in an otherwise repetitive train of auditory stimuli. The MMN is considered automatic because it is elicited even when subjects direct their attention elsewhere (i.e., to a primary task) (Näätänen, 1992). Nevertheless, several lines of evidence suggest that this component is susceptible to attentional manipulation. For example, the MMN is attenuated in amplitude when subjects are engaged in a more demanding task compared with a control task (e.g., Alain & Woods, 1997; Trejo, Ryan-Jones, & Kramer, 1995; Woldorff, Hackley, & Hillyard, 1991).
The MMN can be elicited by a variety of auditory irregularities, including tone frequency, intensity, duration, and interstimulus interval. When the irregularity is large in magnitude, or otherwise novel, the MMN may be followed by a positive component, the P3a, which is thought to represent involuntary attention switching to a salient or novel event (Escera, Alho, Winkler, & Näätänen, 1998; Näätänen, 1990; Sams, Paavilainen, Alho, & Näätänen, 1985). The relationship between the passive detection of irrelevant auditory irregularity and the involuntary switching of attention is not straightforward. According to the variable threshold model (Schröger, 1997; Näätänen, 1992), the P3a elicitation depends on whether the comparative mismatch between the physical characteristics of the deviant stimulus and a memory trace to the preceding repetitive stimuli exceeds a certain threshold. Nonetheless, the P3a can also be elicited independently of the MMN (e.g., Katayama & Polich, 1998).
The magnitude of the P3a component seems to depend on both the salience of the deviance and the effective difference (in terms of spatial and perceptual separation) between task-relevant and task-irrelevant information (i.e., channel separation). Channel separation between task-relevant and task-irrelevant stimulation appears to determine the extent to which an irrelevant auditory deviant will be processed. In a two-channel paradigm, where task-relevant information is presented in a different modality (e.g., visual) than the irrelevant auditory information, effects of deviant distraction were found to be relatively small (e.g., Alho, Woods, & Algazi, 1992; Woods, Alho, & Algazi, 1992). Deviant distraction effects were larger in a one-channel paradigm, where task-relevant and task-irrelevant information is embedded within the same stimulus (e.g., Alain & Woods, 1993). In the one-channel distraction paradigm that Schröger and colleagues developed to evoke greater deviant interference (e.g., Berti & Schröger, 2003; Schröger, Giard, & Wolff, 2000; Schröger & Wolff, 1998), subjects were required to discriminate the duration of equiprobable short or long tones, which could be of either high-probability auditory frequency (standards) or of low-probability auditory frequency (deviants). Both task-relevant information (duration) and task-irrelevant information (i.e., frequency) were delivered through the same sensory channel. The current study used a similar paradigm to heighten the effects of deviant distraction.
In the visual modality, it has been shown that more demanding tasks lead to greater distraction when target and distractor are delivered through the same channel (Lavie, 2005). For example, Stroop interference increases when the task (judgments of the print color of color words) is more difficult, most likely due to heightened attention to the task-relevant (print color) information, which in turn facilitates processing of the distractor (word meaning) information (Chen, 2003). By contrast, task difficulty decreases distractor processing when target and distractor are delivered through separate channels (Alain & Woods, 1993; Driver and Baylis, 1991), perhaps due to limitations on attentional resources when these are divided between channels (Lavie, 1995).
The neural correlates underlying the MMN and P3a are under continuing investigation. Dipole-source modeling of event-related potential (ERP) and magneto-encephalography (MEG) data in humans, as well as positron emission tomography (PET) and functional magnetic resonance imaging (fMRI) studies, reliably implicate auditory cortex sources on the supratemporal plane, bilaterally, in generating the MMN response to tone frequency deviance (e.g., Sabri, Kareken, Dzemidzic, Lowe, & Melara, 2004; Liebenthal, Ellingson, Spanaki, & Prieto, 2003; Müller, Jüptner, Jentzen, & Müller, 2002; Opitz, Rinne, Mecklinger, von Cramon, & Schröger, 2002; Downar, Crawley, Mikulis, & Davis, 2000; Celsis et al., 1999; Opitz, Mecklinger, von Cramon, & Kruggel, 1999; Levänen, Ahonen, Hari, McEvoy, & Sams, 1996; Alho, 1995; Scherg, Vajsar, & Picton, 1989). The MMN is thought to arise mainly from neural generators ~7–10 mm anterior to the N1 generators on the supratemporal plane (Tiitinen, May, Reinikainen, & Näätänen, 1994; Hari, Rif, Tiihonen, & Sams, 1992). Evidence for a frontal contribution to the MMN generation is inconsistent (Sabri et al., 2004; Liebenthal et al., 2003; Müller et al., 2002; Opitz et al., 2002; Downar, Crawley, Mikulis, & Davis, 2001, 2002; Yago, Corral, & Escera, 2001; Rinne, Alho, Ilmoniemi, Virtanen & Näätänen, 2000; Levänen et al., 1996; Giard, Perrin, Pernier, & Bouchet, 1990). Intracranial recordings suggest that the sources of the P3a component include the dorsolateral prefrontal cortex, supramarginal gyrus, and cingulate gyrus (see Halgren, Marinkovic, & Chauvel, 1998, for a summary). A combined single-photon emission computerized tomography (SPECT)–ERP study reported correlations between P3a amplitude and blood flow in medial frontal regions (Ebmeier et al., 1995). Despite these recent findings, however, little is known about how attention modulates the neural correlates of deviance detection in the auditory modality. This question has been investigated in several fMRI studies of visual deviance (e.g., Beck, Rees, Frith, & Lavie, 2001; Rees, Frith, & Lavie, 1997).
In the present study, we employed simultaneous recordings of ERP and fMRI signals to study the spatio-temporal characteristics of neural substrates implicated in irrelevant auditory deviance detection. A one-channel selective attention paradigm was employed, which involved discrimination of tone duration in predetermined easy and difficult task conditions (Berti & Schröger, 2003; Schröger et al., 2000; Schröger & Wolff, 1998). As expected, behavioral performance (reaction time [RT], accuracy) was poorer in the difficult task than in the easy task. We examined whether and how task difficulty affected ERP components and blood oxygen level dependent (BOLD) signal changes arising from processing task-irrelevant deviance. Because relevant and irrelevant information was delivered within the same sensory channel (i.e., same stimulus), we hypothesized that task-irrelevant change in the difficult state would be poorly filtered, therefore causing more frequent attentional shifts to the task-irrelevant frequency information. We thus expected the P3a component to be larger in the difficult condition compared with the easy condition, and the MMN component, which occasionally exhibits susceptibility to attentional manipulations, to be smaller or unchanged.
RESULTS
Behavioral Performance
The RTs for each stimulus type and task difficulty condition are graphed with standard error bars in Figure 1 (top). An analysis of variance (ANOVA) on RT scores, with Task Difficulty (easy, difficult) and Stimulus Type (standard, deviant) as factors, revealed a main effect of Task Difficulty, F(1,20) = 47.38, p < .0001, MSE = 2274.26, with RT significantly greater in the difficult task (651 msec) than in the easy task (580 msec), and a main effect of Stimulus Type, F(1,20) = 40.65, p < .0001, MSE = 1310.65, with RT significantly greater for deviants (641 msec) than for standards (590 msec). The interaction was not significant ( p > .05).
Figure 1.
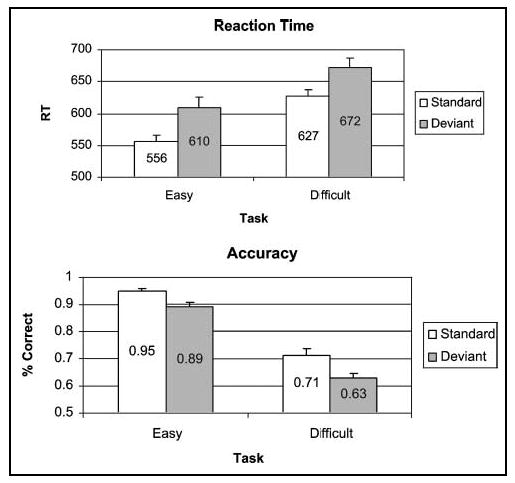
Average reaction time (RT, top) and accuracy (bottom) with standard errors in the easy and difficult task conditions for standards and deviants.
The accuracy for each stimulus type and task difficulty condition is graphed with standard error bars in Figure 1 (bottom). An ANOVA on accuracy scores revealed a main effect of Task Difficulty, F(1,20) = 428.34, p < .0001, MSE = .003, with accuracy significantly greater in the easy task (.92) than in the difficult task (.67), and a main effect of Stimulus Type, F(1,20) = 30.84, p < .0001, MSE = .003, with accuracy significantly greater for standards (.83) than for deviants (.76). The interaction was not significant ( p > .05).
Event-related Potentials
Figure 2 depicts the grand-averaged ERPs superimposed in the easy and difficult task conditions for standard (top left) and deviant (top right) stimuli at electrode Fz, and for the corresponding difference waveforms (deviant–standard; bottom) at all electrode sites. Inspection of the difference waveforms in the easy task revealed a frontal negativity in the MMN time range (110–170 msec). An early negativity in the N1 time range (60–110 msec) was apparent in the difference waveforms of the difficult task, followed by frontocentral positivity in the P3a time range (230–280 msec).
Figure 2.
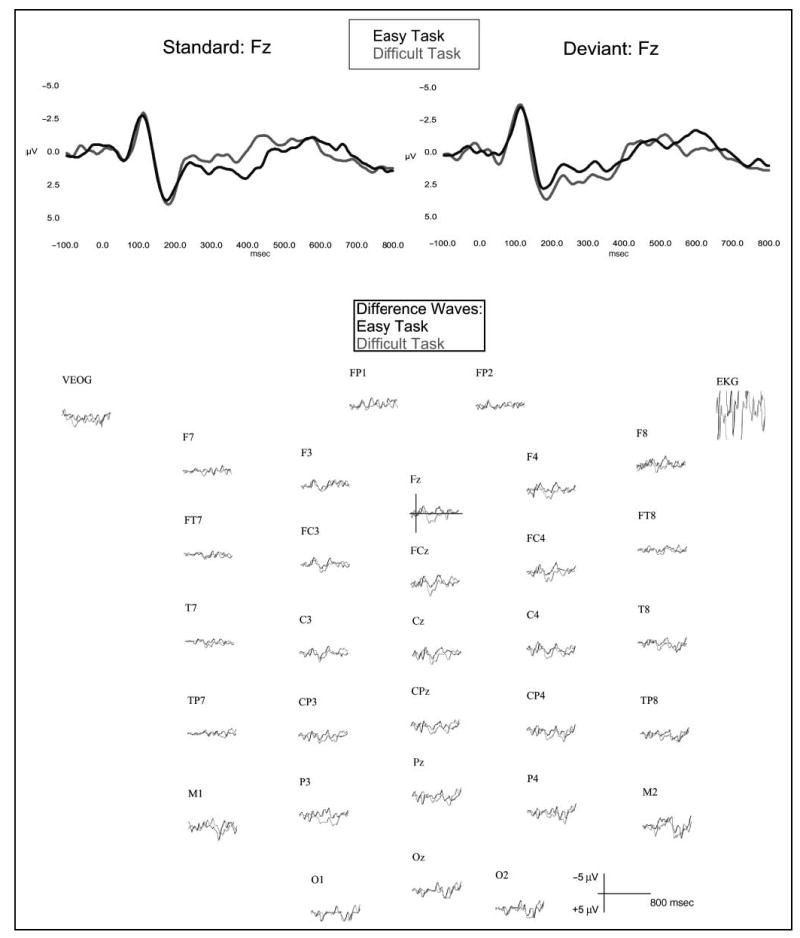
Group average ERP waveforms superimposed for the standard stimuli (1000 Hz) and the deviant stimuli (1300 Hz) in the easy (black trace) and difficult (gray trace) task conditions at the frontal electrode site, Fz (top). Grand average difference waveforms (deviant–standard) superimposed for the easy (black trace) and difficult (gray trace) task conditions at 32 electrode sites (bottom).
A three-way ANOVA was performed on the mean difference waveforms, with Electrode (Fz, FCz, Pz), Task (easy, difficult), and Time Interval (e.g., … 130–160, 140–170, … 250–280, 260–290 …) as repeated measures factors. The analysis revealed a main effect of Interval, F(38,570) = 2.31; MSE = 12.33, p < .05, an Electrode × Time Interval interaction, F(76,1140) = 2.30; MSE = 1.62, p < .05, and a Task × Time Interval interaction, F(38,570) = 2.84; MSE = 5.73, p < .05. No other effects were significant ( p > .05). More importantly, the interaction between Task and Time Interval ( p < .05) revealed greater early negativity in the 60- to 90-msec range (N1) and greater overall positivity in the 240- to 340-msec time range (P3a) in the difficult task. Greater negativity in the 130- to 160-msec range (MMN) was apparent in the easy task. The MMN mean amplitude, as measured in the difference waveforms at Fz, was significantly different from zero in the intervals 110 to 170 msec in the easy task (t > 2.28, p < .05). The N1 and P3a amplitudes were significantly different from zero in the intervals 60 to 110 and 210 to 340 msec, respectively, in the difficult task (N1: t > 2.4, p < .05; P3a: t > 1.8, p < .05). (See the Appendix for the mean amplitudes at Fz in the various intervals and corresponding statistics.) ANOVA of MMN mean amplitudes (measured at 110–170 msec) across electrode sites Fz, FCz, and M2 revealed an interaction between Electrode and Task, F(2,30) = 3.42; MSE = 1.04, p < .05, demonstrating the expected inversion in polarity at the mastoid site relative to the frontal sites in the easy task ( p < .05), where a significant MMN was elicited. This result suggests that the deviant-related negativity did not receive substantial contributions from the N2b component, which displays a more central scalp distribution and does not invert in polarity at the mastoids (Sams et al., 1985).
Figure 3 depicts the scalp distribution of voltage differences (deviant minus standard) in the easy (top) and difficult (bottom) task conditions. The negativity associated with the N1 and MMN components (peaking around 100 and 140 msec in the difficult and easy tasks, respectively) and the positivity associated with the P3a (peaking around 255 msec in the difficult task) are prominent over frontocentral regions, bilateral for N1/ MMN and right lateralized for P3a.
Figure 3.
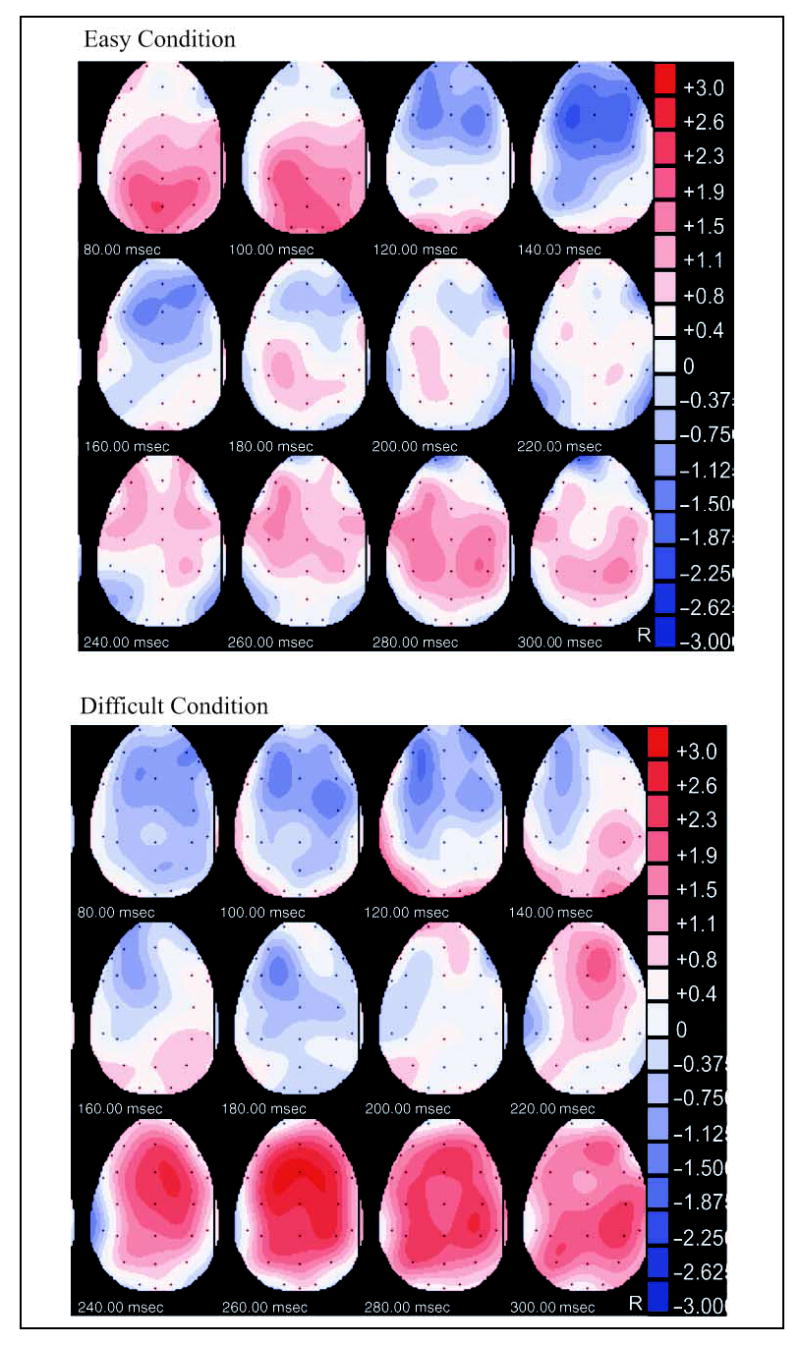
Deviant minus standard voltage distribution over the scalp during the N1, MMN, and P3a time windows, in the easy (top) and difficult (bottom) task conditions. R = right.
Functional Magnetic Resonance Imaging
Region of Interest Analyses
Deviant > standard contrasts in each task condition are presented in Figure 4A (top, easy task; bottom, difficult task). Deviant-induced activation in the easy condition was confined to the superior temporal planes bilaterally, including Heschl’s gyrus and the planum temporale (PT) (Table 1). Deviant-induced activation in the difficult condition was more widespread and included the right Heschl’s gyrus, the right PT, and more ventral areas in the right superior temporal gyrus (STG). Smaller activation foci were observed in the left Heschl’s gyrus and left anterior STG (Table 2).
Figure 4A.
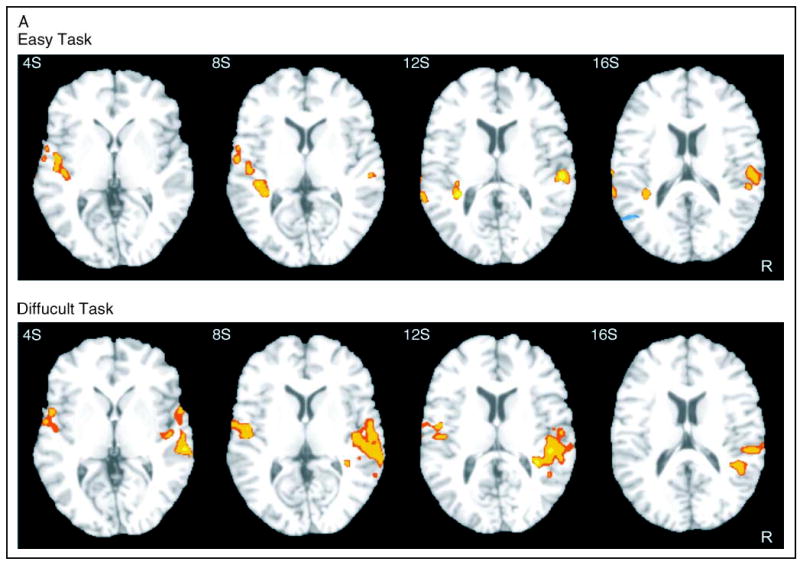
Statistical parametric maps of activation ( p < .05, corrected) in the contrast D–S, in the easy (top) and difficult (bottom) condition. R = right. Slice position appears in the upper left corner (S = superior).
Table 1.
Location of fMRI Activation Peaks for the Contrast: Easy Task (D–S)
|
Talairach coordinates (mm) |
|||
|---|---|---|---|
| x | y | z | Anatomical location |
| 55 | −26 | 15 | R STG |
| −46 | −15 | 4 | L STG/TTG |
| −35 | −33 | 10 | L STG/TTG |
| −40 | −21 | 1 | L TTG |
| −61 | −40 | 13 | Posterior L STG |
| −57 | −4 | 6 | Anterior L STG |
p < .05, corrected.
R = right; L = left; STG = superior temporal gyrus; TTG = transverse temporal gyri (Heschl’s gyri).
Table 2.
Location of fMRI Activation Peaks for the Contrast: Difficult Task (D–S)
|
Talairach coordinates (mm) |
|||
|---|---|---|---|
| x | y | z | Anatomical location |
| 55 | −25 | 8 | R STG/TTG |
| 64 | −43 | 6 | Posterior R MTG |
| 51 | 0 | −1 | Anterior R STG |
| 45 | −44 | 18 | R STG |
| −54 | −6 | 7 | L STG/TTG |
p < .05, corrected.
R = right; L = left; STG = superior temporal gyrus; TTG = transverse temporal gyri (Heschl’s gyri); MTG = medial temporal gyrus.
The difficult (D–S) > easy (D–S) contrast is presented in Figure 4B. This direct contrast between the deviant-induced activations in the two conditions revealed relatively greater activation in the difficult task ventrally in the right STG/superior temporal sulcus (STS) (Table 3). No suprathreshold clusters were found on the left side or for the reverse contrast.
Figure 4B.
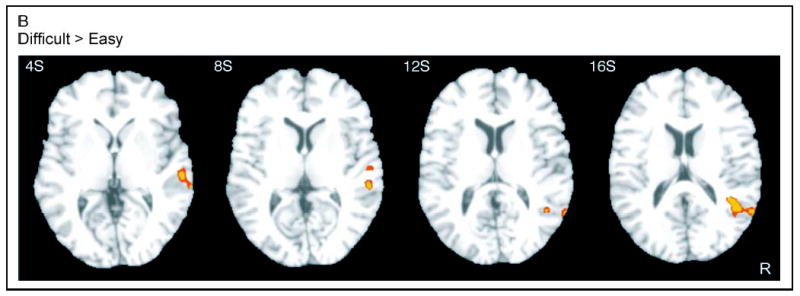
Statistical parametric maps of activation ( p < .05, corrected) in the contrast difficult (D–S) > easy (D–S). R = right.
Table 3.
Location of fMRI Activation Peaks for the Contrast: Difficult (D–S) > Easy (D–S)
|
Talairach coordinates (mm) |
|||
|---|---|---|---|
| x | y | z | Anatomical location |
| 59 | −23 | −1 | R STG/STS |
| 46 | −51 | 20 | Posterior R STG/STS |
| 48 | −4 | −6 | Middle R STG/STS |
| 52 | 14 | −17 | Anterior R STG/STS |
| 62 | −27 | 3 | R STG/STS |
p < .05, corrected.
R = right; L = left; STG = superior temporal gyrus; STS = superior temporal sulcus.
Whole-brain Analyses
Whole-brain analyses using a corrected threshold of p < .05 revealed no significant activation for the difficult (D–S) > easy (D–S) comparison. To investigate the possibility that small differences in activation between the easy and the difficult conditions might have been missed, a lenient voxelwise threshold ( p < .001, uncorrected) without any cluster threshold was applied. In this analysis, the difficult (D–S) > easy (D–S) contrast showed stronger deviant-induced activation for the difficult condition in the right STG, middle frontal gyrus (MFG) bilaterally, the medial aspect of the right superior frontal gyrus, and the insula.
DISCUSSION
Results of the current study suggest that the processing of unattended auditory features depends on the attentional demands involved in processing relevant features. We manipulated attentional demand by varying the difficulty of discrimination across two tasks. RT was slower and accuracy lower in the difficult task compared with the easy task, confirming the validity of our manipulation. Performance was relatively poor on trials that contained frequency change (deviants) under both task conditions, suggesting that distraction may have occurred even in the easy task (but see below). More important, we found that task difficulty modulated several critical ERP components: The MMN was relatively larger in the easy task, whereas the N1 and P3a components were relatively larger in the difficult task. Brain activations associated with the passive detection of auditory deviance, as reflected by the MMN, and involuntary attention shifting, as reflected by the P3a, were observed in the dorsal and ventral parts of the superior temporal cortex, respectively.
Our finding of a relatively smaller MMN response in the difficult task is consistent with previous accounts of this component’s susceptibility to attentional manipulation (Alain & Woods, 1997; Trejo et al., 1995; Woldorff et al., 1991). Our findings of enhanced N1 and P3a components with higher task difficulty also fit with previous attention research. The magnitude of the N1 component is larger in response to attended than unattended stimuli (Hillyard, Hink, Schwent, & Picton, 1973), and in difficult compared with easy tasks (Schröger et al., 2000). Similarly, several studies have reported a larger P3a in difficult compared with easy tasks. For example, Katayama and Polich (1998), employing a one-channel, three-tone, oddball paradigm with target and nontarget deviants found a larger P3a to the nontarget deviants in a demanding low-discriminability condition compared with an easy discrimination condition. These authors reasoned that the nontarget stimulus in this context recruited attention in a manner similar to that reported for novel stimuli. Schröger et al. (2000), employing a paradigm akin to that used in the current study, also observed a larger P3a to deviants in a distraction condition, in which duration judgments were made between short and long tones that changed infrequently in pitch, compared with an ignore condition in which all auditory stimulation was ignored (subjects read a book).
The threshold model (Schröger, 1997) states that elicitation of the P3a component depends on the mismatch response. Instead, we found that P3a occurred in the presence of a small (statistically insignificant) MMN when task difficulty was high (difficult task), and that the MMN occurred in the absence of statistically significant P3a when task difficulty was low (easy task). The threshold model also predicts that increased task difficulty should elevate the threshold, resulting in a reduction of the P3a, again inconsistent with the current results. The model’s predictions are in line with recent findings of Berti and Schröger (2003) using a paradigm that also involved a task-load manipulation: In their study, the P3a component was preceded by an MMN, and the amplitude of the P3a was reduced with an increase in task load. However, their two (n-back) tasks manipulated working memory load, with short or long tones fixed in duration in each condition. By contrast, our study manipulated perceptual load by making discrimination between the short and long tones either easy or difficult. The two studies therefore differ in terms of the task parameter used to manipulate attentional load (working memory vs. perceptual discriminability). In the visual modality, the effects of load on processing of irrelevant information have been shown to depend on the degree and type of mental processing required by the task (Lavie, 2005), a variable that is not accommodated by the threshold model (e.g., perceptual vs. working memory task). It is possible, then, that differences in load characteristics account for the discrepancies between the current results and those of Berti and Schröger (2003), although the exact mechanisms underlying these interactions are unclear at present.
Under both easy and difficult conditions, the BOLD maps implicated areas of the STG in the detection of deviance, consistent with previous neuroimaging studies (e.g., Sabri et al., 2004; Liebenthal et al., 2003; Müller et al., 2002; Opitz et al., 2002). Inspection of the topographical voltage maps revealed frontocentral negativity in both conditions. However, in the difficult task, the statistically significant negativity was observed 60–110 msec after stimulus onset—the latency of the N1 component—whereas in the easy task it was observed 110–170 msec after stimulus onset—the latency of the MMN component. Strong frontocentral positivity was observed at 210–340 msec in the difficult task. Thus, the activation maps in the easy and difficult conditions might represent different bioelectric components, namely, the MMN and N1-P3a, respectively. Bottom-up deviance detection, as measured by the MMN, was associated with more dorsal activation on the supratemporal plane. On the other hand, shifts of attention to the deviant were associated [by the interaction difficult (D–S) > easy (D–S)] with activation ventrally on the right STG/ STS, and (with a reduced threshold) in bilateral MFG, the medial aspect of the right superior frontal gyrus, and the insula. This activation most likely represents the P3a, which was the dominating ERP component in the difficult condition. BOLD activation related to the N1 (which was more prominent in the difficult condition) or to the MMN (which was more prominent in the easy condition) is less likely to be represented in this contrast [difficult (D–S) > easy (D–S)] due to the spatial proximity of the neural generators of these components. Indeed, dorsal STG regions previously associated with N1 or MMN generators (Tiitinen et al., 1994; Hari et al., 1992) were not observed in this contrast.
The lack of a significant P3a in the easy task is somewhat surprising given that RT and accuracy were adversely affected by the deviant tones (Figure 1), suggesting a “distraction” effect even in the easy task. This adverse effect of irrelevant information on performance, however, is not necessarily indicative of an attentional switch. Irrelevant sensory information could slow RT and lower accuracy simply by adding “noise” at an early perceptual processing level (Bacon & Konrad, 1993; Emmerich, Fantini, & Ellermeier, 1989). We interpret the presence of an MMN response and absence of a P3a in the easy condition as indicating just such an effect on early perceptual processes without an accompanying switch of attention. In the difficult condition, on the other hand, the greater focusing of attention on the auditory stimuli seems to have amplified later processing of the deviant, producing an attentional switch and accompanying P3a.
The present results suggest that both dorsal and ventral auditory regions in the STG are modulated by ongoing attentional demands. We hypothesize that the dorsal region is activated primarily in response to the passive detection of a mismatch between the memory trace formed by the standards and the incoming deviant stimulus. The ventral region appears to be modulated by top-down processing of sensory deviance determined by the attentional demands of the task. In the difficult condition, resources were concentrated on the discrimination of task-relevant changes, which we believe amplified the perception of deviance, prompting additional deviance analysis. Conversely, the irrelevant dimension was preattentively processed in the easy condition, thus requiring only superficial deviance analysis.
METHODS
Subjects
Simultaneous ERP/fMRI data were recorded from 21 right-handed, healthy volunteers (7 women; mean age = 26.8 years, SD = 5.8 years) with no history of hearing, neurological, or psychiatric disorders. ERP data were excluded from five subjects due to excessive movement artifacts (<150 ERP responses available per deviant condition; final N = 16, mean age = 28.3 years). fMRI data were excluded from 5 other subjects due to scanner artifacts (final N = 16, mean age = 26.9 years). Eleven subjects had both fMRI and ERP data. Informed consent was obtained from each participant prior to the experiment, in accordance with the Medical College of Wisconsin Institutional Review Board.
Stimuli
Stimuli consisted of short and long pure sine-wave tones of repetitive 1000 Hz standards and infrequent 1300 Hz deviants at a sound pressure level of ~90 dB/SPL. Auditory stimulation was delivered binaurally through plastic tubing attached to foam earplugs by using a commercial system (Avotec, Jensen Beach, FL) that is MRI and electroencephalogram (EEG) compatible. This system provides a flat frequency response in the range used in this study. Tone presentation was controlled by a personal computer running PsyScope (Cohen, MacWhinney, Flatt, & Provost, 1993).
Task Design and Procedure
Short and long sinusoidal tones with equal probability were presented every 1400 msec in a sequence of nine stimuli during the “quiet” periods between image acquisitions (see Figure 5). The stimulus sequence started approximately 500 msec after the end of each image acquisition and ended approximately 1400 msec before the start of the next image acquisition. Subjects performed a two-alternative forced-choice easy or difficult duration discrimination task, indicating whether the tone was short or long in duration by pressing one of two keys after each tone (Berti & Schröger, 2003; Schröger et al., 2000). In two thirds of randomized sequences, two of the nine tones consisted of frequency deviants ( pDeviant = .22); in the remaining one third of sequences, all nine tones were standards. Subjects were instructed to ignore the frequency changes and to attend only to the duration of the stimuli. To hold the difficulty of the primary task fixed across subjects, the task was tailored for each individual. In both easy and difficult tasks, the short tone was 50 msec in duration (including rise-and-fall time of 5 msec). Prior to scanning, each participant was tested by use of an adaptive staircase method to determine the duration of the long tone in each task condition. The desired level of accuracy was approximately 60% in the difficult task condition and 90% in the easy task condition. The duration of the long tone was determined to be 60 and 100 msec in duration (including rise-and-fall time of 5 msec) in the difficult and easy task, respectively, for the majority of subjects (55 msec was used as difficult for one subject and 65 msec for two others). The deviants occurred in positions 4 and 8 or 5 and 8 in the sequence (thus separated by at least two standard stimuli) in order to maximize deviant-elicited BOLD signal at image acquisition (peaking after 4–5 sec). Three hundred and twenty sequences were presented over 10 separate runs, bringing the total number of deviants presented throughout the experiment to 480. Thus, 160 images and 240 ERP deviant responses were collected per experimental task condition, separated into five easy and five difficult runs. The runs alternated between the two conditions and the order was counterbalanced across subjects.
Figure 5.
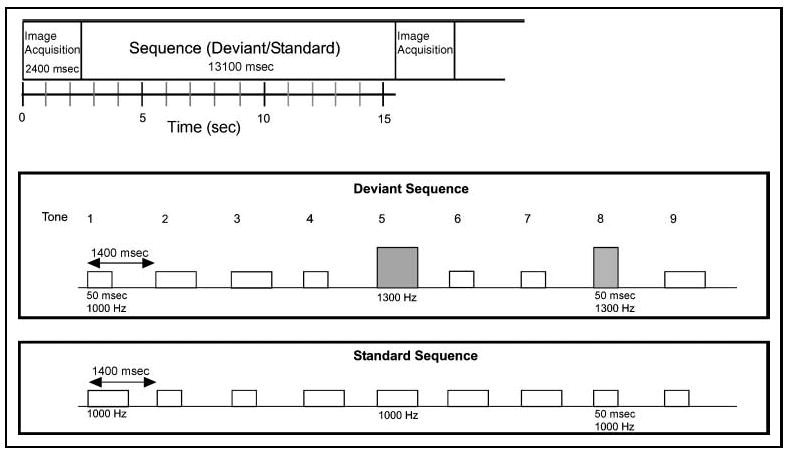
Experimental parameters in the duration discrimination task in a clustered image acquisition paradigm. An image was acquired after every sequence (top). The stimulus sequence started approximately 500 msec after the end of each image acquisition and ended approximately 1400 msec before the start of the next image acquisition. A sequence was either a standard or a deviant sequence (middle and bottom). Within each sequence, short (50 msec) and long (~60 msec in the difficult task and 100 msec in the easy task) sinusoidal tones were presented every 1400 msec in sequences of nine. In standard sequences, all tones were of the same frequency (1000 Hz; white bars). In deviant sequences, two of the tones consisted of task-irrelevant frequency deviants (1300 Hz; gray bars), whereas seven tones were of standard frequency (1000 Hz). Subjects were instructed to judge every tone for its duration only (short or long).
ERP Data Acquisition
Thirty-channel EEG activity was acquired by using the fMRI-compatible Optilink acquisition system (Neuroscan, Inc., El Paso, TX) in a continuous mode, and the Quik-Cap electrode positioning system (Neuroscan, Inc.). Electrode sites conformed to the International 10-20 System. Potentials recorded at each site were referenced to the tip of the nose. Vertical eye movements were monitored with bipolar recordings between sites above and below the left eye. Electrocardiographic activity (ECG) was recorded to obtain timing information for ballistocardiogram artifact (BA) reduction (Ellingson et al., 2004). Interelectrode resistance was kept below 5 kΩ. Activity was recorded at full bandwidth and digitally sampled at 500 Hz per channel. Synchronization between the ERP and fMRI acquisition was achieved by a scanner-initiated trigger to the stimulus delivery system at the onset of every image acquisition. The stimulus delivery system, in turn, sent pulses to the Optilink system to tag the EEG of each stimulus event with millisecond accuracy.
Structural and fMRI Data Acquisition
Images were acquired on a 1.5-T GE Signa scanner (GE Medical Systems, Milwaukee, WI). Functional data consisted of T2*-weighted, gradient-echo, echo-planar images (TE = 40 msec, flip angle = 90, NEX = 1, acquisition time = 2400 msec), obtained using clustered acquisition at 15,500-msec intervals (i.e., TR) to avoid perceptual masking of the sound sequences (approximately 13,100 msec long) or contamination of the brain activation data to the stimuli by the activation to the acoustic noise of the scanner (Edmister, Talavage, Ledden, & Weisskoff, 1999; see Figure 5). The images were reconstructed from 22 axially oriented contiguous slices with 3.75 × 3.75 × 4.00-mm voxel dimensions. Slice coverage was centered obliquely around the temporal lobes and included most of the brain (missing only the most dorsal portions of the superior frontal gyri and parietal lobe, and the most anterior and ventral part of the middle temporal gyrus). High-resolution anatomical images of the entire brain were obtained with a 3-D spoiled gradient-echo sequence (SPGR) with 0.94 × 0.94 × 1.2-mm voxel dimensions.
STATISTICAL PROCEDURES
Behavioral Analysis
Mean correct RTs and overall percentage of correct responses were computed separately for standard and deviant trials in the easy and difficult task conditions. A two-way ANOVA with factors of Task Difficulty (easy, difficult) and Stimulus Type (standard, deviant) were computed to test the effects of Task Difficulty on deviant responses.
ERP Analysis
In the first phase of analysis, the ballistocardiogram artifact was removed from the ongoing EEG by using a method previously described by Ellingson et al. (2004). This artifact is introduced by motion of closed electrical loops (formed by the scalp electrodes, leads, and skin) in a nonuniform magnetic field and is time-locked to the heartbeat (Schomer et al., 2000). The BA can reach amplitudes 100 times larger than those of the ERPs and therefore must be removed from the EEG.
Initial within-subject analysis consisted of (a) creating epochs of −100 to +800 msec from each tone onset, (b) band-pass filtering the data at 1–30 Hz, (c) baseline correcting each epoch by removing the mean voltage value of the whole sweep, and (d) rejecting epochs with voltage values exceeding ±100 μV. The remaining epochs were then sorted and averaged according to Stimulus Type (standard, deviant) and Condition (easy, difficult). Equal numbers of standard and deviant responses were subjected to averaging: Responses to standard tones were restricted to those in which the standard occupied the same serial position as a deviant in a deviant sequence (i.e., positions 4, 5, and 8). This procedure also eliminated stimulus order confounds. Data from subjects with fewer than 150 artifact-free ERP deviant responses per condition were excluded from the ERP analysis. This criterion ensured an adequate signal-to-noise ratio for averaging of the small MMN component (Lang et al., 1995). Each waveform was corrected by subtracting the mean voltage of the prestimulus period from the average. Difference waveforms for each participant were computed by subtracting the average response to the deviant stimuli in a condition from the average response to the standard stimuli in that condition.
Grand-average waveforms were computed for the standard, deviant, and deviant minus standard in each condition. A moving window analysis was performed on the amplitudes of the difference waveforms averaged over 30-msec intervals and 10-msec steps (e.g., 0–30, 10–40, 20–50, and up to 400 msec) at Fz, FCz, and Pz. Statistical analysis on the difference scores was carried out by using ANOVA. All statistically significant effects were subjected to Greenhouse–Geisser correction when appropriate.
fMRI Analysis
Image analysis was conducted by using the AFNI software package (Cox, 1996; afni.nimh.nih.gov/afni/). Within-subject analysis consisted of spatial coregistration of each functional volume to the last steady-state functional volume acquired before the anatomical scan, using an iterative voxelwise least squares approach (Cox & Jesmanowicz, 1999) to minimize head motion artifacts. All coregistered volumes in each experimental condition were subsequently used to create individual statistical parametric maps. The first and last images were discarded, leaving a total of 32 images per run. Voxelwise multiple linear regression was applied to analyze individual time series, with reference functions representing the sequences containing deviant stimuli (compared to only standards sequences as baseline) in each task condition (easy, difficult). A general linear model tested for effects of task condition on size of the deviant response, using the interaction contrast difficult (D–S) > easy (D–S). Motion indices were included as covariates in these regressions. Individual anatomical scans and statistical maps were projected into standard stereotaxic space (Talairach & Tournoux, 1988) and smoothed with a Gaussian filter measuring 6 mm full-width half-maximum to compensate for individual variation in anatomy across subjects. In random effects analyses, individual t maps were contrasted against a constant value of zero to create group t maps.
Regions of Interest Analysis
Based on the theory and a priori hypotheses, unilateral masks were created that included the superior temporal and Heschl’s gyri, using the AFNI Talairach Daemon database. A cluster size threshold (956 μl, p < .05, corrected) was then applied to the masked group t maps based on Monte Carlo simulation by using the AlphaSim module in AFNI. Activation peaks, separated by at least 15 mm, were computed by using 3dExtrema in AFNI.
Acknowledgments
This study was supported by NRSA 2203373 (M. Sabri) and R01-DC 006287-01 (E. Liebenthal). The authors thank R. Melara for valuable comments, and M. Ellingson, R. Desai, S. Durgerian, and C. Humphries for technical assistance.
APPENDIX
Results of ERP Moving Window Analysis on the Fz Difference Scores
| Interval (msec) | Mean (μV) | t | p | |
|---|---|---|---|---|
| Easy condition | ||||
| 110 | 140 | −1.1853 | 2.3913 | .0152 |
| 120 | 150 | −1.4147 | 2.8565 | .006 |
| 130 | 160 | −1.4144 | 2.7831 | .007 |
| 140 | 170 | −1.2242 | 2.2796 | .0188 |
| Difficult condition | ||||
| 60 | 90 | −0.8462 | 2.383 | .0154 |
| 70 | 100 | −1.0969 | 3.1425 | .0034 |
| 80 | 110 | −1.0518 | 2.548 | .0111 |
| 210 | 240 | 1.0265 | 1.7611 | .0493 |
| 220 | 250 | 1.2604 | 1.7679 | .0487 |
| 230 | 260 | 1.491 | 1.8046 | .0456 |
| 240 | 270 | 1.6584 | 1.893 | .0389 |
| 250 | 280 | 1.7144 | 2.0303 | .0302 |
| 260 | 290 | 1.6836 | 2.1909 | .0223 |
| 270 | 300 | 1.6094 | 2.2804 | .0188 |
| 280 | 310 | 1.5082 | 2.2389 | .0204 |
| 290 | 320 | 1.3902 | 2.0938 | .0268 |
| 300 | 330 | 1.3004 | 1.9061 | .038 |
| 310 | 340 | 1.2615 | 1.7567 | .0497 |
Only periods where significant differences between standard and deviant waveforms were observed are shown.
Footnotes
The data reported in this experiment have been deposited in the fMRI Data Center (www.fmridc.org). The accession number is 2-2005-120JH.
References
- Alain C, Woods DL. Distractor clustering enhances detection speed and accuracy during selective listening. Perception and Psychophysics. 1993;54:509–514. doi: 10.3758/bf03211773. [DOI] [PubMed] [Google Scholar]
- Alain C, Woods DL. Attention modulates auditory pattern memory as indexed by event-related brain potentials. Psychophysiology. 1997;34:534–546. doi: 10.1111/j.1469-8986.1997.tb01740.x. [DOI] [PubMed] [Google Scholar]
- Alho K. Cerebral generators of mismatch negativity (MMN) and its magnetic counterpart (MMNm) elicited by sound change. Ear and Hearing. 1995;16:38–51. doi: 10.1097/00003446-199502000-00004. [DOI] [PubMed] [Google Scholar]
- Alho K, Woods DL, Algazi A. Processing of auditory stimuli during auditory and visual attention as revealed by event-related potentials. Psychophysiology. 1992;31:469–479. doi: 10.1111/j.1469-8986.1994.tb01050.x. [DOI] [PubMed] [Google Scholar]
- Bacon SP, Konrad DL. Modulation detection interference under conditions favoring within- or across-channel processing. The Journal of the Acoustical Society of America. 1993;93:1012–1022. doi: 10.1121/1.405549. [DOI] [PubMed] [Google Scholar]
- Beck DM, Rees G, Frith CD, Lavie N. Neural correlates of change detection and change blindness. Nature. 2001;4:645–650. doi: 10.1038/88477. [DOI] [PubMed] [Google Scholar]
- Berti S, Schröger E. Working memory controls involuntary attention switching: Evidence from an auditory distraction paradigm. European Journal of Neuroscience. 2003;17:1119–1122. doi: 10.1046/j.1460-9568.2003.02527.x. [DOI] [PubMed] [Google Scholar]
- Celsis P, Boulanouar K, Doyon B, Ranjeva JP, Berry I, Nespoulous JL, Chollet F. Differential fMRI responses in the left posterior superior temporal gyrus and left supramarginal gyrus to habituation and change detection in syllables and tones. Neuroimage. 1999;9:135–144. doi: 10.1006/nimg.1998.0389. [DOI] [PubMed] [Google Scholar]
- Chen Z. Attentional focus, processing load, and Stroop interference. Perception and Psychophysics. 2003;65:888–900. doi: 10.3758/bf03194822. [DOI] [PubMed] [Google Scholar]
- Cohen JD, MacWhinney B, Flatt MR, Provost J. PsyScope: A new graphic interactive environment for designing psychology experiments. Behavior Research Methods, Instruments, and Computers. 1993;25:257–271. [Google Scholar]
- Cox RW. AFNI: Software for analysis and visualization of functional magnetic resonances neuroimages. Computational Biomedical Research. 1996;29:162–173. doi: 10.1006/cbmr.1996.0014. [DOI] [PubMed] [Google Scholar]
- Cox RW, Jesmanovicz A. Real-time 3D image registration for functional MRI. Magnetic Resonance Medicine. 1999;42:1014–1018. doi: 10.1002/(sici)1522-2594(199912)42:6<1014::aid-mrm4>3.0.co;2-f. [DOI] [PubMed] [Google Scholar]
- Downar J, Crawley AP, Mikulis DJ, Davis KD. A multimodal cortical network for the detection of changes in the sensory environment. Nature Neuroscience. 2000;3:277–283. doi: 10.1038/72991. [DOI] [PubMed] [Google Scholar]
- Downar J, Crawley AP, Mikulis DJ, Davis KD. The effect of task relevance on the cortical response to changes in visual and auditory stimuli: An event-related fMRI study. Neuroimage. 2001;14:1256–1267. doi: 10.1006/nimg.2001.0946. [DOI] [PubMed] [Google Scholar]
- Downar J, Crawley AP, Mikulis DJ, Davis KD. A cortical network sensitive to stimulus salience in a neutral behavioral context across multiple sensory modalities. Journal of Neurophysiology. 2002;87:615–620. doi: 10.1152/jn.00636.2001. [DOI] [PubMed] [Google Scholar]
- Driver J, Baylis GC. Target–distractor separation and feature integration in visual attention to letters. Acta Psychologica. 1991;76:101–119. doi: 10.1016/0001-6918(91)90040-7. [DOI] [PubMed] [Google Scholar]
- Ebmeier KP, Steele JD, Mackenzie DM, O’Caroll RE, Kydd RR, Glabus MF, Blackwood DHR, Rugg MD, Goodwin GM. Cognitive brain potentials and regional cerebral blood flow equivalents during two- and three-sound auditory “oddball tasks. Electroencephalography and Clinical Neurophysiology. 1995;95:434–443. doi: 10.1016/0013-4694(95)00173-5. [DOI] [PubMed] [Google Scholar]
- Edmister WB, Talavage TM, Ledden PJ, Weisskoff RM. Improved auditory cortex imaging using clustered volume acquisitions. Human Brain Mapping. 1999;7:89–97. doi: 10.1002/(SICI)1097-0193(1999)7:2<89::AID-HBM2>3.0.CO;2-N. [DOI] [PMC free article] [PubMed] [Google Scholar]
- Ellingson ML, Liebenthal E, Spanaki MV, Prieto TE, Binder JR, Ropella KM. Reduction of ballistocardiogram artifact in the simultaneous acquisition of auditory event-related potentials and functional magnetic resonance images. Neuroimage. 2004;22:1534–1542. doi: 10.1016/j.neuroimage.2004.03.033. [DOI] [PubMed] [Google Scholar]
- Emmerich DS, Fantini DA, Ellermeier W. An investigation of the facilitation of simple auditory reaction time by predictable background stimuli. Perception & Psychophysics. 1989;45:66–70. doi: 10.3758/bf03208034. [DOI] [PubMed] [Google Scholar]
- Escera C, Alho K, Winkler I, Näätänen R. Neural mechanisms of involuntary attention to acoustic novelty and change. Journal of Cognitive Neuroscience. 1998;10:590–604. doi: 10.1162/089892998562997. [DOI] [PubMed] [Google Scholar]
- Giard MH, Perrin F, Pernier J, Bouchet P. Brain generators implicated in processing of auditory stimulus deviance: A topographic event-related potential study. Psychophysiology. 1990;27:627–640. doi: 10.1111/j.1469-8986.1990.tb03184.x. [DOI] [PubMed] [Google Scholar]
- Halgren E, Marinkovic K, Chauvel P. Generators of the late cognitive potentials in auditory and visual oddball tasks. Electroencephalography and Clinical Neurophysiology. 1998;106:156–164. doi: 10.1016/s0013-4694(97)00119-3. [DOI] [PubMed] [Google Scholar]
- Hari R, Rif J, Tiihonen J, Sams M. Neuromagnetic mismatch fields to single and paired tones. Electroencephalography and Clinical Neurophysiology. 1992;82:152–154. doi: 10.1016/0013-4694(92)90159-f. [DOI] [PubMed] [Google Scholar]
- Hillyard SA, Hink RF, Schwent VL, Picton TW. Electrical signs of selective attention in the human brain. Science. 1973;182:177–180. doi: 10.1126/science.182.4108.177. [DOI] [PubMed] [Google Scholar]
- Katayama J, Polich J. Stimulus context determines P3a and P3b. Psychophysiology. 1998;35:23–33. [PubMed] [Google Scholar]
- Lang AH, Eerola P, Korpilahti I, Holopainen I, Salo S, Aaltonen O. Practical issues in the clinical application of mismatch negativity. Ear and Hearing. 1995;16:118–130. doi: 10.1097/00003446-199502000-00009. [DOI] [PubMed] [Google Scholar]
- Lavie N. Distracted and confused? Selective attention under load. Trends in Cognitive Sciences. 1995;9:75–82. doi: 10.1016/j.tics.2004.12.004. [DOI] [PubMed] [Google Scholar]
- Lavie N. Distracted and confused? Selective attention under load. Trends in Cognitive Sciences. 2005;2:75–82. doi: 10.1016/j.tics.2004.12.004. [DOI] [PubMed] [Google Scholar]
- Levänen S, Ahonen A, Hari R, McEvoy L, Sams M. Deviant auditory stimuli activate human left and right auditory cortex differently. Cerebral Cortex. 1996;98:493–501. doi: 10.1093/cercor/6.2.288. [DOI] [PubMed] [Google Scholar]
- Liebenthal E, Ellingson ML, Spanaki MV, Prieto TE. Simultaneous ERP and fMRI of the auditory cortex in a passive oddball paradigm. Neuroimage. 2003;19:1395–1404. doi: 10.1016/s1053-8119(03)00228-3. [DOI] [PubMed] [Google Scholar]
- Müller BW, Jüptner M, Jentzen W, Müller SP. Cortical activation to auditory mismatch elicited by frequency deviant and complex novel sounds: A PET study. Neuroimage. 2002;17:231–239. doi: 10.1006/nimg.2002.1176. [DOI] [PubMed] [Google Scholar]
- Näätänen R. The role of attention in auditory information processing as revealed by event-related potentials and other brain measures of cognitive function. Behavioral and Brain Sciences. 1990;13:201–288. [Google Scholar]
- Näätänen R. Attention and brain function. Hillsdale, NJ: Erlbaum; 1992. [Google Scholar]
- Opitz B, Mecklinger A, von Cramon DY, Kruggel F. Combining electrophysiological and hemodynamic measures of the auditory oddball. Psychophysiology. 1999;36:142–147. doi: 10.1017/s0048577299980848. [DOI] [PubMed] [Google Scholar]
- Opitz B, Rinne T, Mecklinger A, von Cramon DY, Schröger E. Differential contribution of frontal and temporal cortices to auditory change detection: fMRI and ERP results. Neuroimage. 2002;15:167–174. doi: 10.1006/nimg.2001.0970. [DOI] [PubMed] [Google Scholar]
- Rees G, Frith CD, Lavie N. Modulating irrelevant motion perception by varying attentional load in an unrelated task. Science. 1997;278:1616–1619. doi: 10.1126/science.278.5343.1616. [DOI] [PubMed] [Google Scholar]
- Rinne T, Alho K, Ilmoniemi RJ, Virtanen J, Näätänen R. Separate time behaviors of the temporal and frontal mismatch negativity source. Neuroimage. 2000;12:14–19. doi: 10.1006/nimg.2000.0591. [DOI] [PubMed] [Google Scholar]
- Sabri M, Kareken DA, Dzemidzic M, Lowe MJ, Melara RD. Neural correlates of automatic auditory sensory memory and change detection. Neuroimage. 2004;21:69–74. doi: 10.1016/j.neuroimage.2003.08.033. [DOI] [PubMed] [Google Scholar]
- Sams M, Paavilainen P, Alho K, Näätänen R. Auditory frequency discrimination and event-related potentials. Electroencephalography and Clinical Neurophysiology. 1985;62:437–448. doi: 10.1016/0168-5597(85)90054-1. [DOI] [PubMed] [Google Scholar]
- Scherg M, Vajsar J, Picton TW. A source analysis of the late human auditory evoked potentials. Journal of Cognitive Neuroscience. 1989;1:336–355. doi: 10.1162/jocn.1989.1.4.336. [DOI] [PubMed] [Google Scholar]
- Schomer DL, Bonmassar G, Lazeyras F, Seeck M, Blum A, Anami K, Schwartz D, Belliveau JW, Ives J. EEG-linked functional magnetic resonance imaging in epilepsy and cognitive neurophysiology. Journal of Clinical Neurophysiology. 2000;17:43–58. doi: 10.1097/00004691-200001000-00005. [DOI] [PubMed] [Google Scholar]
- Schröger E. On the detection of auditory deviations: A pre-attentive activation model. Psychophysiology. 1997;34:245–257. doi: 10.1111/j.1469-8986.1997.tb02395.x. [DOI] [PubMed] [Google Scholar]
- Schröger E, Giard MH, Wolff C. Auditory distraction: Event-related potential and behavioural indices. Clinical Neurophysiology. 2000;111:1450–1460. doi: 10.1016/s1388-2457(00)00337-0. [DOI] [PubMed] [Google Scholar]
- Schröger E, Wolff C. Behavioral and electrophysiological effects of task-irrelevant sound change: A new distraction paradigm. Cognitive Brain Research. 1998;7:71–87. doi: 10.1016/s0926-6410(98)00013-5. [DOI] [PubMed] [Google Scholar]
- Talairach J, Tournoux P. Co-planar stereotaxic atlas of the human brain. Stuttgart: Thieme; 1988. [Google Scholar]
- Tiitinen H, May K, Reinikainen K, Näätänen R. Attentive novelty detection in humans is governed by pre-attentive sensory memory. Nature. 1994;372:90–92. doi: 10.1038/372090a0. [DOI] [PubMed] [Google Scholar]
- Trejo LJ, Ryan-Jones DL, Kramer AF. Attentional modulation of the mismatch negativity elicited by frequency differences between binaurally presented tone bursts. Psychophysiology. 1995;32:319–328. doi: 10.1111/j.1469-8986.1995.tb01214.x. [DOI] [PubMed] [Google Scholar]
- Woldorff M, Hackley SA, Hillyard SA. The effects of channel-selective attention on the mismatch negativity elicited by deviant tones. Psychophysiology. 1991;28:30–42. doi: 10.1111/j.1469-8986.1991.tb03384.x. [DOI] [PubMed] [Google Scholar]
- Woods DL, Alho K, Algazi A. Intermodal selective attention: I. Effects on event-related potentials to lateralized auditory and visual stimuli. Clinical Neurophysiology. 1992;82:341–355. doi: 10.1016/0013-4694(92)90004-2. [DOI] [PubMed] [Google Scholar]
- Yago E, Corral MJ, Escera C. Activation of brain mechanisms of attention switching as a function of auditory frequency change. NeuroReport. 2001;12:4093–4097. doi: 10.1097/00001756-200112210-00046. [DOI] [PubMed] [Google Scholar]