Abstract
Aims: To investigate the effect of a pneumatic tube system (PTS) on the results of samples sent for blood gas analysis to a central laboratory.
Methods: Blood gas samples were analysed immediately or sent via the PTS to the laboratory for analysis. In addition, samples sent via the PTS in a pressure sealed container were compared with those sent non-pressure sealed to the laboratory.
Results: Samples sent via the PTS had significant alterations in their pO2 values, which were not seen when samples were carried by hand to the laboratory. There was no effect on pCO2 and pH values. The use of a pressure sealed container abolished the alteration in pO2 values seen.
Conclusions: Samples for blood gas analysis should be transported via a PTS using a pressure sealed container to avoid artefacts in the pO2.
Keywords: pneumatic tube system, blood gas analysis, pressurised container, oxygen pressure
Rapid sample delivery systems, usually pneumatic tube systems (PTS), have been installed in hospitals to reduce delays in delivering samples from the patient to the core laboratory. The use of such rapid sample delivery systems, combined with electronic data links, would be expected to improve laboratory turnaround times (TATs). This would enable the laboratory to provide an analytical service with TATs comparable to that of a satellite “emergency” laboratory or point of care testing (POCT) facility at less cost.1 Studies have shown that there are no significant effects on analytes, particularly pO2, pCO2, and pH.2 However, a recent report has shown that there is perturbation of pO2 values when there is air contamination.3 We have examined the impact of an air tube delivery system (ASCOM GCT GmbH, Keven, Germany) on blood gas samples analysed immediately or sent via the pneumatic tube system to the laboratory for analysis.
“The use of rapid sample delivery systems, combined with electronic data links, would be expected to improve laboratory turnaround times”
METHODS
Arterial blood samples were drawn from patients in the intensive care unit (ICU) of a UK district general hospital. The ICU is located in a separate building from the pathology laboratory, but on the same geographical site. All of the hospital wards including the ICU are connected to the central pathology laboratory via a pneumatic air tube delivery system. The ICU is 520 metres from the laboratory, with a median delay from sampling to arrival at the laboratory of 19 minutes (interquartile range, 13 to 23). Ethical permission for our study was obtained from the local research ethics committee. Samples were taken into commercially supplied preheparinised syringes (Mieno Corp, Tokyo, Japan). Visible air bubbles were expelled and the samples capped and processed immediately.
A three stage study was performed, as follows:
Phase 1. Consecutive samples were drawn in duplicate from patients over a two week period. One sample was analysed immediately on the ICU by a member of the ICU staff. The second sample was capped and sealed in a gas tight plastic envelope and taken immediately, by hand, to the laboratory for analysis by a member of the laboratory staff.
Phase 2. Consecutive samples were drawn in duplicate from patients over a two week period. One sample was analysed immediately on the ICU by a member of the ICU staff. The second sample was capped, sealed in a gas tight plastic envelope, and sent to the laboratory via the PTS. Immediately on receipt by the laboratory the sample was analysed by a member of the laboratory staff. The time of sample draw and sample analysis were recorded for each sample.
Phase 3. Consecutive samples were drawn in triplicate from patients over a two week period. One sample was analysed immediately on the ICU by a member of the ICU staff. The remaining two samples were then capped and each sealed in a separate gas tight plastic envelope. One sample was then sent to the laboratory via the pneumatic tube system using the conventional canister. The second was sealed inside a pressure tight container and sent to the laboratory via the PTS inside the conventional canister. Immediately on receipt by the laboratory the samples were analysed by a member of the laboratory staff. The time of sample draw and sample analysis was recorded for each sample.
Blood gas analysis in the ICU was performed using ion sensitive electrodes on a Corning 850 blood gas analyser (Corning Instruments, Halstead, Essex, UK). Coefficients of variation (CVs) were—pH: 0.1% at 7.152, 0.3% at 7.429, 0.1% at 7.587; pCO2: 1.5% at 10.30 kPa, 3.1% at 5.56 kPa, 2.9% at 3.09 kPa; pO2: 1.1% at 8.05 kPa, 7.9% at 12.66 kPa, 2.3% at 17.46 kPa. Blood gas analysis in the laboratory was performed using ion sensitive electrodes on an ABL 50 blood gas analyser (Radiometer UK, Crawley, Sussex). CVs were—pH: 0.1% at 7.128, 0.1% at 7.384, 0.1% at 7.625; pCO2: 8.3% at 8.53 kPa, 1.9% at 5.19 kPa, 4.1% at 2.36 kPa; pO2: 2.5% at 8.50 kPa, 8.8% at 14.9 kPa, 2.5% at 23.9 kPa. The laboratory maintained both blood gas analysers with daily quality control measurements performed by a qualified laboratory technician.
Results of pH, pO2, and pCO2 measurements were compared by non-parametric statistical analysis, with calculation of the median difference and interquartile range (IQR) of differences. Passing and Bablock regression plots and Bland-Altman difference plots were constructed for each analyte and the results compared.
RESULTS
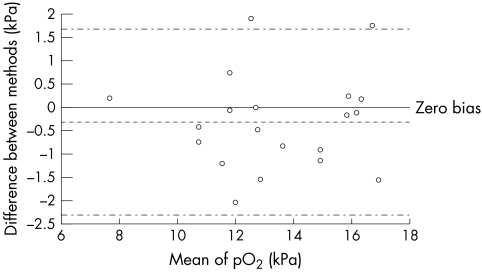
Twenty samples were analysed on the ICU and after being immediately transferred by hand carriage to the laboratory. There was no difference between the values for pH (median difference, 0.001; IQR, 0.015; p = 0.9461), pCO2 (median difference, 0.230; IQR, 0.408; p = 0.4487), or pO2 (median difference, 0.280; IQR, 1.27; p = 0.7150) by Mann Whitney U test. pH ICU = 0.942 pH lab + 0.432; pCO2 ICU = 1.079 pCO2 lab − 0.214; pO2 ICU = 0.998 pO2 lab + 0.312.
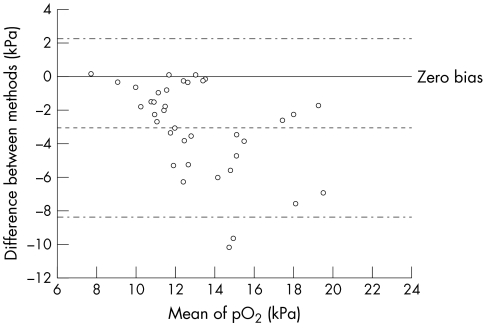
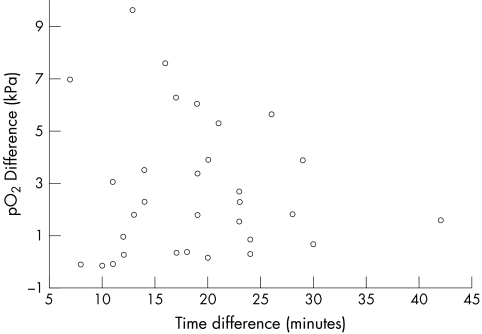
Thirty seven samples were analysed on the ICU and sent via the pneumatic tube system for analysis in the laboratory. In these samples there was good agreement for pH and pCO2 with pH ICU = 0.917 pH lab + 0.617; median difference between values, −0.01; IQR, 0.011; p = 0.9096 (not significant (NS)) and pCO2 ICU = 1.101 pCO2 lab – 0.018; median difference between values, −0.050; IQR, 0.27; p = 0.7011 (NS). However, there were substantial differences for pO2, pO2 ICU = 0.594 pO2 lab + 3.157; median difference, 2.31; IQR, 3.91; p < 0.0001. Comparative data for samples carried to the laboratory and those sent via the pneumatic tube are shown in figs 1 and 2. The discrepancies in pO2 showed no correlation with time from sampling to analysis (fig 3), rs = 0.085 (NS; Spearman).
Figure 1.
Altman and Bland plot for pO2 determined in samples carried by hand to the laboratory and assayed on the intensive care unit (ICU).
Figure 2.
Altman and Bland plot, for pO2 , determined in samples assayed in the intensive care unit (ICU) and carried to the laboratory via the pneumatic tube.
Figure 3.
Comparison of pO2 with time delay for samples sent via pneumatic tube. There was no correlation between time of sampling to analysis of pO2 (rs = 0.085; not significant; Spearman).
Forty samples were analysed on the ICU and sent via the PTS in the pressure sealed and non-pressure sealed system. As before, there was no difference between the pH and pCO2 values for all three samples. However, pO2 values in samples sent in the pressure sealed system were not significantly different from those measured on the ICU (median difference, 0.740; IQR, 1.643; p = 0.2987), whereas those sent in the non-pressure tight system showed significant differences from samples measured in the ICU (median difference, 1.540; IQR, 2.37; p = 0.0047) and those sent pressure sealed to and measured in the laboratory (median difference, 1.335; IQR, 2.895; p = 0.0286).
DISCUSSION
The determinants of TAT are: the time interval from blood draw to the time of delivery of the sample to the point of analysis, the analytical TAT, and the time taken to return results. Whole blood analytical systems and modern fast analytical systems can result in a reduction in analytical TAT to as little as five minutes. Electronic data links mean that results can be viewed remotely within seconds of analysis. Therefore, the limitation remains the time taken to deliver the sample to the point of analysis. The options therefore are to move analysis nearer to the patient, either by the use of satellite laboratories or POCT, or speed up the transport of samples. This is the rationale for the use of PTS for sample delivery. The case for the existence of satellite laboratories is the maintenance of laboratory quality. The use of POCT is based on the premise that the quality of results produced is clinically acceptable. The PTS option assumes that samples are unaffected by transport within the system. Most analytes would be expected to be unaffected by transport and most studies support this,2,4–6 although increased concentrations of lactate dehydrogenase were reported in samples allowed to clot before analysis.2 One recent study of 291 samples in routine clinical use in particular showed no increased incidence of haemolysis in the samples transported via PTS.7 However, samples transported by PTS may not be suitable for all applications.8 The samples most sensitive to transport changes would be expected to be those taken for blood gas analysis. Recently, a report suggested that the presence of air contamination resulted in significant interference in PTS transported samples.3 We confirmed that this was the case, but found that this relates to the pressure changes occurring within the system, because it was abolished by the use of pressure tight transport containers.
“In routine clinical use, samples sent via a pneumatic delivery system may show a large discrepancy when compared with samples analysed immediately”
Pressure changes as a possible cause of interference have not been investigated previously. It seems that the previous studies did not use pressure sealed containers. The lack of correlation between delay time and pO2 difference is in accordance with other studies. The changes in pO2 but not CO2 and pH are at first surprising, but are readily explained. Blood pH and pCO2 are tightly controlled and heavily buffered. The determination of pO2 is made solely from the oxygen dissolved in solution, in excess of that bound by the haemoglobin in erythrocytes. Thus, any minor changes in pressure will affect the dissolved oxygen content of the sample, especially if there are microbubbles, and hence change the pO2.
Take home messages.
The transport of samples for blood gas analysis by pneumatic tube system (PTS) does not alter pCO2 and pH values, but does have significant effects on pO2 values
Samples for blood gas analysis should be transported via PTS using a pressure sealed container to avoid artefacts in the pO2
In routine clinical use, samples sent via a pneumatic delivery system may show a large discrepancy when compared with samples analysed immediately. This most likely results from air bubbles in the samples, despite care being taken to expel any air bubbles, combined with pressure effects from the delivery system. Unless samples sent for blood gas analysis to the laboratory can be transported in a pressure tight system that can be conveniently used, samples should be hand carried or analysed by POCT. This needs to be incorporated into recommendations for the implementation of such systems.9
Acknowledgments
This project was supported in part by the UK NHS R&D Health Technology Assessment Program, Project number 93/06/04. The authors would like to thank the nursing staff on ICU, Mayday University Hospital for their assistance in taking blood samples and analysing the blood gases within ICU.
Abbreviations
CV, coefficient of variation
ICU, intensive care unit, IQR, interquartile range
NS, not significant
POCT, point of care testing
PTS, pneumatic tube system
TAT, turnaround time
REFERENCES
- 1.Winkelman JW, Wybenga DR. Quantification of medical and operational factors determining central versus satellite laboratory testing of blood gases. Am J Clin Pathol 1994;102:7–10. [DOI] [PubMed] [Google Scholar]
- 2.Poznanski W, Smith F, Bodley F. Implementation of a pneumatic-tube system for transport of blood specimens. Am J Clin Pathol 1978:70:291–5. [DOI] [PubMed] [Google Scholar]
- 3.Astles JR, Lubarsky D, Loun B, et al. Pneumatic transport exacerbates interference of room air contamination in blood gas samples. Arch Pathol Lab Med 1996;120:642–7. [PubMed] [Google Scholar]
- 4.Weaver DK, Miller D, Leventhal EA, et al. Evaluation of a computer-directed pneumatic-tube system for pneumatic transport of blood specimens. Am J Clin Pathol 1978;70:400–5. [DOI] [PubMed] [Google Scholar]
- 5.Pragay DA, Fan P, Brinkley S, et al. A computer directed pneumatic tube system: its effects on specimens. Clin Biochem 1980;13:259–61. [DOI] [PubMed] [Google Scholar]
- 6.Keshgegian AA, Bull GE. Evaluation of a soft-handling computerized pneumatic tube specimen delivery system. Effects on analytical results and turnaround time. Am J Clin Pathol 1992;97:535–40. [DOI] [PubMed] [Google Scholar]
- 7.Stair TO, Howell JM, Fitzgerald DJ, et al. Hemolysis of blood specimens transported from ED to laboratory by pneumatic tube. Am J Emerg Med 1995;13:484. [DOI] [PubMed] [Google Scholar]
- 8.Greendyke RM, Banzhaf JC, Pelysko S, et al. Immunologic studies of blood samples transported by a pneumatic tube system. Am J Clin Pathol 1977;68:508–10. [DOI] [PubMed] [Google Scholar]
- 9.Adelman H. Guidelines for use of pneumatic tube systems. American Journal of Hospital Pharmacy 1993;50:429–30. [PubMed] [Google Scholar]


