Abstract
Aims: Preliminary studies have suggested that there is an increase in adipocytic tissue in osteoporotic (OP) bone, supporting in vitro evidence for a switch in differentiation of stromal cells from the osteoblastic to the adipocytic lineage. To investigate this the variation of the ratio of adipose tissue to haemopoietic/stromal tissue in OP bone was measured.
Methods: The ratio of adipocytic to haemopoietic/stromal tissue (A/H) was measured by semi-automated image analysis in iliac crest biopsies from 127 patients with osteoporosis (84 female patients, 48 male patients; mean age, 55 years; range, 5–80). Fourteen patients with normal histomorphometric data (nine women; five men; mean age, 48 years; range 21–70) acted as controls.
Results: The ratio of A/H was higher in OP bone than in the normal controls (OP mean 43.06% v normal mean 22.4%; p < 0.001). Multiple regression analysis showed that 98.5% of the variability in the A/H ratio was the result of age and several measures of bone formation, including cancellous wall thickness, osteoid volume, cancellous thickness, cortical wall thickness, cancellous apposition rate, and bone formation rate, together with cancellous separation (each significant at p < 0.001). Those with the greatest effect on the A/H ratio (in decreasing order) were cancellous apposition rate, osteoid volume, and age.
Conclusions: Cancellous apposition rate, osteoid volume, and age were associated with the increase in the proportion of adipose tissue present in OP bone. Of these, cancellous apposition rate reflects osteoblast activity, indicating that the increase in the volume of adipose tissue in osteoporosis is associated with reduced bone formation, supporting the postulated switch in differentiation of stromal cells from the osteoblastic to the adipocytic pathway in osteoporosis.
Keywords: osteoporosis, histomorphometry, bone marrow stromal cell differentiation
The reduction in cancellous bone volume that occurs in osteoporosis (OP)1 also occurs, but to a lesser extent, as part of normal aging.2,3 It is associated with decreased bone marrow cellularity,4 and a parallel increase in bone marrow adiposity,5 which is thought to result from a reduction in the differentiation of osteoblasts from the stromal cell precursor pool in favour of adipocytic differentiation.6 This hypothesis is supported by a wealth of in vitro data demonstrating an inverse relation between osteoblastic and adipocytic differentiation of bone marrow stromal cell cultures,7–10 and is particularly relevant to the development of OP. Although the different culture conditions required to effect such switches in differentiation are well known,7 possible factors that may be responsible for such a switch in vivo are only now being suggested.11
“A switch to the adipocytic lineage would yield a greater volume of adipocytic tissue”
The clonal switch hypothesis has been investigated in vivo by histomorphometric measurements of the ratio of haemopoietic tissue to adipose tissue in osteoporosis,12 because a switch to the adipocytic lineage would yield a greater volume of adipocytic tissue. However, these studies were conducted over a narrow age range and may have been confounded by the effect of age on bone marrow cellularity, which falls with age, with a corresponding increase in adipose tissue.
To overcome this we used semi-automated image analysis to measure the ratio of adipocytic to haemopoietic tissue (A/H ratio) in iliac crest biopsies from male and female patients, with a wide age range, who had osteoporosis.
METHODS
Bicortical iliac crest biopsies from 127 patients with established osteoporosis (47 male, 80 female) were examined. The patients ranged in age from 5 to 80 years, with a mean age of 55 years; table 1 gives the numbers of patients in each age/sex cohort. Sixty seven patients had primary osteoporosis, whereas the remaining 60 cases of secondary OP included 36 cases of postmenopausal OP, 10 cases of steroid induced OP, 12 with other endocrine dysfunction, and two postgastrectomy cases. The control group consisted of 14 patients (nine female, five male), with an age range of 21 to 70 years (mean, 48). The patients in this group had been referred for investigation of non-specific back or joint pain, possibility of metastatic carcinoma, essential hypertension, and amenorrhoea. None had evidence of pathological fracture or of low bone density, and in all the histomorphometric parameters were within normal limits. All biopsies had been referred for diagnostic purposes and a full range of standard histomorphometric parameters13 (table 2) were measured in each at the time of referral by an independent observer unconnected with the measurement of the A/H ratio. The means and standard deviations for each of these in local practice have been established from local control cases.14 The biopsies were processed routinely,13 and histomorphometric parameters were measured using standard techniques15–17 defined according to internationally recommended terminology.18 The diagnosis of osteoporosis was determined radiologically by the presence of at least one non-traumatic vertebral crush fracture or a lumbar spine (L2–L4) bone mineral density more than 2 SD below the peak bone mass (assessed by dual x ray absorptiometry). Biopsies with no measurable histomorphometric abnormalities were selected as normal controls; because such biopsies were uncommon it was necessary to include some unicortical iliac crest biopsies. Specifically, these cases were obtained during investigation of haematological disease, were morphologically normal and none had clinical evidence of osteoporosis, including low bone mass.
Table 1.
Age and sex distribution of patients with osteoporosis included in our study
| Group | Age (years) | Number of patients (male/female) |
| 0 | 1–10 | 1 (0/1) |
| 1 | 10–20 | 0 |
| 2 | 21–30 | 8 (2/6) |
| 3 | 31–40 | 18 (8/10) |
| 4 | 41–50 | 29 (12/17) |
| 5 | 51–60 | 39 (18/21) |
| 6 | 61–70 | 23 (6/17) |
| 7 | 71–80 | 9 (1/8) |
Table 2.
Standard histomorphometric variables used in multiple regression analysis
| Variable type | Variable | Definition (units) |
| Static trabecular bone parameters | Cancellous bone volume (1) | BV/TVt (%) |
| Wall thickness (2) | (μm) | |
| Osteoid surface (3) | OS/B (%) | |
| Osteoid volume (4) | OV/BV (%) | |
| Osteoid thickness (5) | (μm) | |
| Osteoblast surface (6) | ObS/BS (%) | |
| Eroded surface (10) | ES/BS (%) | |
| Osteoclast surface (11) | OcS/BS (%) | |
| Osteoclast number (12) | Noc/TVt (/mm2 ×10−2) | |
| Cancellous thickness (13) | (μm) | |
| Cancellous number (14) | (/mm3) | |
| Cancellous separation (15) | (μm) | |
| Static cortical bone parameters | Cortical thickness (16) | (μm) |
| Cortical volume (17) | CV/TVc (%) | |
| Cortical wall thickness (18) | (μm) | |
| Osteoclast number (19) | Noc/TVc (/mm2 ×10−2) | |
| Subcortical osteoclasts (20) | Noc/BSs (/mm ×10−2) | |
| Dynamic parameters | Cancellous apposition rate | (μm/day) |
| Mineralising surface 1 (7) | MS/BS or dLS+1/2sLS (%) | |
| Mineralising surface 2 (8) | MS/OS or sLS+dLS (%) | |
| Mineralising surface (9) | dLS/sLS (%) | |
| Cortical apposition rate (21) | (u+C4m/day) | |
| Bone formation rate (22) | BFR/BVt [dLS+1/2sLS] (%/year) |
The variables were defined and measured according to the guidelines detailed in Parfitt et al.18 Histomorphometric parameters numbered in column 2 for reference to figs 5 and 6.
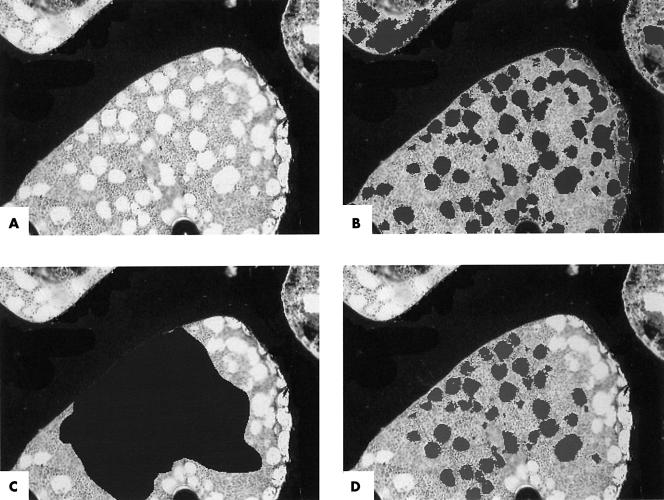
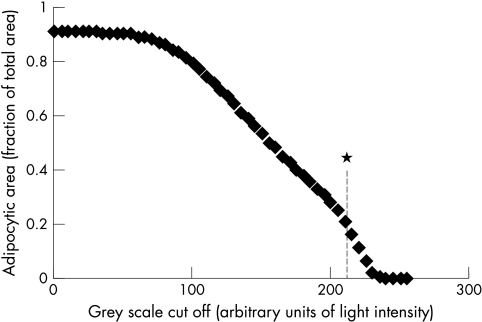
The proportion of the bone marrow space occupied by adipocytic tissue was measured, in von Kossa sections, by semi-automated image analysis using a Quantimet 600S system and the A/H ratio was calculated. Because the A/H ratio normally varies between paracortical and intercortical sites the ratio was calculated from the average of three fields in each biopsy, one adjacent to each cortical surface and one in the middle of the biopsy. For each of the three fields the live image was captured (fig 1A) and the amount of haemopoietic tissue within the field measured automatically by the selection of tissue above a preset grey scale cutoff. This represented stained nuclear and cytoplasmic tissue, whereas the optically clear adipocytic tissue was measured by subtraction from the total area (fig 1B). The area for measurement was selected with a cursor, omitting cancellous struts and artefacts, (fig 1C) and the A/H ratio was measured within this area (fig 1D). The method was validated as detailed below. The optimum grey scale cutoff value was established by replicate measurements across all grey scale cutoffs in the same fields in 10 biopsies and the optimum was set at the point at which the change in grey scale yielded the greatest change in measured area. This occurred at cutoffs between 200 and 210 arbitrary light intensity units (fig 2), indicating that the most sensitive discrimination lay within this range; the grey scale cutoff was thereafter set at 205 for all calculations. The intraobserver error was estimated by duplicate measurements of the ratio in six randomly selected biopsies, and the interobserver error by independent measurement of the ratio in six randomly selected biopsies by the principal investigator and two validators. Finally, the A/H ratio was calculated over the entire section for 20 randomly selected cases and compared with that over three fields to ensure that the values obtained over three fields were representative of the whole section.
Figure 1.
Image capture and calculation of the adipocytic ratio; all images von Kossa, original magnification, ×40; (A) Live image of representative field of bone marrow captured digitally; (B) adipocytic tissue (darker areas) highlighted by semi-automated selection of area above grey scale cutoff; (C) area for calculation of adipocytic ratio (large dark area) selected with cursor, omitting cancellous struts and artefacts; (d) adipocytic tissue (darker areas) highlighted by subtraction from grey/haemopoietic tissue within the area selected and the ratio of clear/adipocytic to grey/haemopoietic stromal tissue calculated.
Figure 2.
Variation in adipocytic area with alteration in grey scale cutoff value. The rate of change of the slope was greatest at 210 units (*), indicating that the greatest sensitivity and discrimination between clear and grey tissue lay around this value.
The data obtained were normally distributed and statistical comparison of the ratios was carried out using a two sample t test. Multiple regression analysis, using a Minitab statistical package, was used to identify factors that contribute to the variation of the sample ratio. All of the standard histomorphometric variables that had been recorded at the initial diagnostic assessment were used as factors (table 2). A stepwise approach was adopted and a series of multiple regression equations, accounting for the variability of the sample ratios, was generated.
RESULTS
Validation
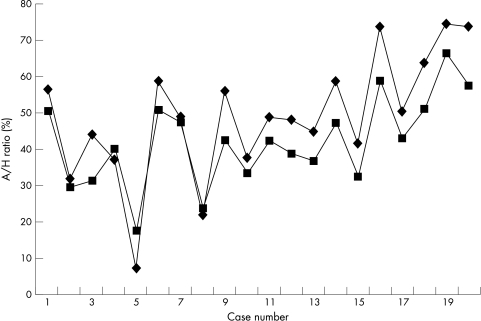
The interobserver correlation between the values generated by the principal investigator and those of the two validators were 0.90 and 0.78, respectively (principal investigator mean A/H ratio of 44.63% v 44.87% and 43.15% for the validators). The intraobserver correlation between the mean ratios generated by the principal investigator from the same cases on two separate occasions (44.63% and 47.42%) was 0.99. Comparison of the A/H ratio from the entire section with that from three fields demonstrated concordance, with a correlation coefficient of 0.95 (fig 3), confirming that three fields were representative of the entire section.
Figure 3.
Adipocytic/haemopoietic ratio measured across three fields (squares) and across the entire biopsy (diamonds) in 20 randomly selected cases, demonstrating close concordance of the ratios measured by the two methods.
A/H ratio of patients with OP
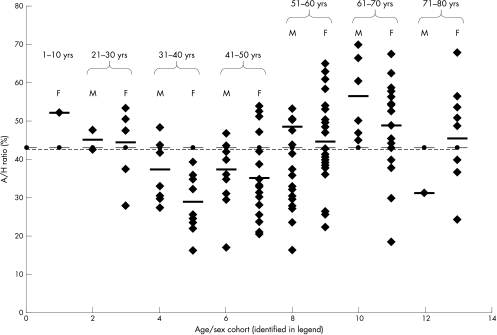
The overall A/H ratio was significantly greater in patients with OP (OP mean 43.06% v normal mean 21.07%; p < 0.001), with little difference between male and female patients with OP (male mean 44.42% (SD, 12.68) v female mean 42.29% (SD, 13.02)). The ratio for patients with OP was higher than the normal mean for all age/sex cohorts, with no age bias (fig 4). The A/H ratio varied across the different aetiological groups, but only those with steroid induced osteoporosis had a significantly higher A/H ratio compared with the other aetiological groups (p < 0.05) (table 3).
Figure 4.
Adipocytic/haemopoietic (A/H) ratios for patients in each of the age/sex cohorts, with mean of each cohort (thick horizontal bar), regression line for means of cohorts (y = 42.56 + 0.05x) (dotted line), and mean of all cases (thin horizontal bar), demonstrating the lack of age bias of cohort means compared with the overall mean for all cases. Age/sex cohorts: 1, females 1–10 years; 2, men 21–30 years; 3, women 21–30 years; 4 men 31–40 years; 5, women 31–40 years; 6, men 41–50 years; 7, women 41–50 years; 8, men 51–60 years; 9, women 51–60 years; 10, men 61–70 years; 11, women 61–70 years; 12, men 71–80 years; 13, women 71–80 years.
Table 3.
Mean and SD of adipocytic/haemopoietic (A/H) ratios in each of the aetiological groups
| Aetiological group | Number of cases | Mean A/H ratio | SD of A/H ratio |
| Primary | 67 | 43.15 | 11.7 |
| Secondary | |||
| Postmenopausal | 36 | 38.66 | 12.29 |
| Steroid induced | 10 | 51.27 | 16.5 |
| Other endocrine dysfunction | 12 | 45.12 | 14.08 |
| Other | 2 | 58.13 | 12.05 |
Relation between A/H ratio and histomorphometric parameters
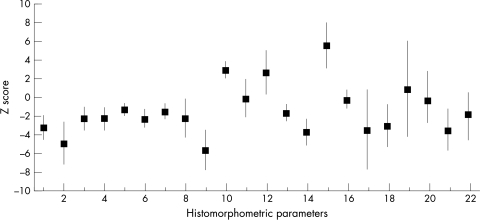
Figure 5 shows the mean values and 95% confidence limits of the Z scores for the histomorphometric parameters across all age/sex groups. The cancellous bone volume was more than 2 SD below the normal mean, confirming the presence of osteoporosis, as were other indices of bone formation, such as osteoid surface and volume, wall thickness, and osteoblast and mineralising surface (fig 5). Conversely, measures of bone resorption, including eroded surface, osteoclast number, and cancellous separation, were more than 2 SD above the normal mean (fig 5). Furthermore, the detailed pattern of mean Z scores for each of the histomorphometric parameters was similar for all the age/sex cohorts, indicating similarity of disease processes across the groups, thereby validating the use of histomorphometric data from the entire data set in regression analysis.
Figure 5.
Mean values (squares) and 95% confidence limits (vertical lines) of the Z scores of each of the histomorphometric parameters, each calculated across all cases included in the study; parameters numbered as indicated in table 2.
Multiple regression on the histomorphometry data for the patients generated the following equations, accounting for the variability of the data set. Each histomorphometric variable in table 1 was regressed individually with the sample A/H ratios, and the p values and unadjusted R2 values tabulated. From table 4, according to statistical convention, the variables that had p values < 0.05 (that is, < 5% chance that it does not contribute to the overall variation of the data set) were selected and included in linear multiple regression analysis. Table 5 shows the resultant p values for each of the selected parameters; the corresponding regression equation is included for completeness. By convention, variables with p values < 0.05 were retained and used to generate the final regression equation:
 |
 |
 |
 |
Table 4.
Significance of all parameters used as variables in first round of multiple regression analysis, with magnitude of contribution to variation in adipocytic/haemopoietic ratio (R2)
| Parameter | p Value | R2 Value |
| Age | <0.002* | 6.8 |
| Trabecular bone volume | <0.001* | 15.1 |
| Wall thickness | <0.001* | 18.4 |
| Osteoid surface | <0.148 | 1.6 |
| Osteoid volume | <0.002* | 7 |
| Osteoid thickness | <0.002* | 7.5 |
| Osteoblast surface | <0.042* | 3.2 |
| Mineralising surface 1 | <0.119 | 1.9 |
| Mineralising surface 2 | <0.25 | 1 |
| Mineralising surface | <0.051 | 2.9 |
| Eroded surface | <0.438 | 0.5 |
| Osteoclast surface | <0.731 | 0.1 |
| Osteoclast number | <0.596 | 0.2 |
| Trabecular thickness | <0.001* | 15.6 |
| Trabecular number | <0.086 | 2.2 |
| Trabecular separation | <0.015* | 4.5 |
| Cortical thickness | <0.002* | 7 |
| Cortical volume | <0.114 | 1.9 |
| Cortical wall thickness | <0.001* | 14.4 |
| Osteoclast number | <0.836 | 0 |
| Subcortical osteoclasts | <0.904 | 0 |
| Trabecular apposition rate | <0.004* | 6.3 |
| Cortical apposition rate | <0.518 | 0.3 |
| Bone formation rate | <0.002* | 6.9 |
*These parameters contributed significantly.
Table 5.
Variables contributing to the variation in the adipocytic/haemopoietic ratio (corresponding regression equation given below)
| Variable | p Value |
| Age | 0.001* |
| Trabecular bone volume | 0.137 |
| Wall thickness | 0.001* |
| Osteoid volume | 0.001* |
| Osteoid thickness | 0.476 |
| Osteoblast surface | 0.385 |
| Trabecular thickness | 0.001* |
| Trabecular separation | 0.001* |
| Cortical thickness | 0.059 |
| Cortical wall thickness | 0.001* |
| Trabecular apposition rate | 0.001* |
| Bone formation rate | 0.001* |
Ratio = 77.1 + (1.02 × age) − (0.0902 × trabecular bone volume) − (0.393 × wall thickness) − (0.949 × osteoid volume) + (0.0649 × osteoid thickness) − (0.0810 × osteoblast surface) − (0.109 × trabecular thickness) − (0.00426 × trabecular separation) + (0.00114 × cortical thickness) − (0.224 × cortical wall thickness) + (10.8 × trabecular apposition rate) + (0.0978 × bone formation rate).
*These variables contributed significantly.
A total R2 value of 98.5% was obtained using all the variables with p values of < 0.001, indicating that 98.5% of the variability of the A/H ratio could be accounted for by these factors. Of these, the greatest contribution to the variability of the ratio was made by the cancellous apposition rate, followed in descending order by osteiod volume, age, wall thickness, cortical wall thickness, cancellous thickness, bone formation rate, and cancellous separation.
DISCUSSION
Previous studies have shown an inverse relation between the amount of adipose tissue and cancellous bone in bone marrow,5 although these studies only used postmenopausal samples and may therefore have been confounded by the effect of age on the ratio of adipose to haemopoietic tissue. The cellularity of bone marrow also varies from field to field in individual biopsies, explaining the not infrequent clinical finding of discordance between the cellularity in bone marrow aspirate and trephine samples. To overcome these limitations, the adipocytic/haemopoeitic ratio was measured in three fields in each patient, the patients chosen had a wide age range, and age/sex matched controls were included.
The increase in adipocytic tissue found by others was confirmed, with a consequent parallel decrease in cellularity. Interestingly, no significant difference was present for sex, although the A/H ratio was significantly higher, compared with the other aetiological groups, in cases of steroid induced OP, perhaps reflecting the severity of this particular pathology compared with others. The validity of using the histomorphometric data for each patient in regression analysis was confirmed by analysis of the deviation of the histomorphometric parameters from the normal. This confirmed the presence of OP in the group as a whole and demonstrated similarity of involvement in each of the age/sex cohorts. Regression analysis demonstrated an association with age to a minor degree, although there was no significant bias towards a higher A/H ratio in the older age/sex cohorts. The minor association with age therefore reflects preservation of the normal effect of age present in the normal population within the test group, over and above which there was an additional increase in A/H caused by OP. The cancellous apposition rate, which is a direct correlate of osteoblast activity, contributed significantly to the variation in the A/H ratio. In addition, other measures of bone formation, namely—cancellous wall thickness, osteoid volume, cancellous thickness, cortical wall thickness, and bone formation rate—were also associated with the variation in the A/H ratio, albeit less significantly, confirming a relation between the A/H ratio and bone formation. Interestingly, an association between the amount of adipose tissue and bone formation has been shown previously, but in a smaller sample, which contained postmenopausal women only.12 Measures of bone resorption, namely osteoclast number and surface, were not associated with the variability in A/H ratio, and, paradoxically, the variability was not strongly associated with either osteoblast surface or mineralising surface, the last of which is generally a sensitive indicator of osteoblast function. This may reflect the fact that in many cases of OP it is the function rather than absolute number of osteoblasts that is reduced.19 Nonetheless, an association between the amount of adipose tissue in the intratrabecular bone marrow spaces and bone formation was still present, supporting the presence of a switch from the osteoblastic to the adipocytic lineage.
“No significant difference was present for sex, although the adipocytic to haemopoietic/stromal tissue ratio was significantly higher, compared with the other aetiological groups, in cases of steroid induced osteoporosis”
Osteoblasts are thought to arise from pluripotent bone marrow stromal cells,20 which are also capable of differentiation along adipocytic, chondrocytic, or myoblastic lineages, and there is accumulating in vitro evidence that an inverse relation exists between osteoblastic and adipocytic differentiation of marrow stromal cells.7–10 However, few studies have investigated the role of the bone marrow in bone formation using dynamic in vivo measurements.12 We have used the A/H ratio as a proxy for the assessment of the amount of stromal tissue present, and have shown a strong association between the ratio and cancellous apposition. This indicates a close functional link between the balance between adipocytic and haemopoietic/stromal tissue and osteoblastic activity, and supports the postulated existence of a clonal switch between the adipocytic and osteoblastic lineages in osteoporosis.1
Take home messages.
The cancellous apposition rate, which is a direct correlate of osteoblast activity, contributed significantly to the variation in the adipocytic to haemopoietic/stromal tissue (A/H) ratio
Other measures of bone formation, such as cancellous wall thickness, osteoid volume, cancellous thickness, cortical wall thickness, and bone formation rate, were also associated less significantly with the variation in the A/H ratio, confirming a relation between the A/H ratio and bone formation
This indicates a close functional link between the balance between adipocytic and haemopoietic/stromal tissue and osteoblastic activity, and supports the postulated existence of a clonal switch between the adipocytic and osteoblastic lineages in osteoporosis
Abbreviations
A/H ratio, adipocytic to haemopoietic/stromal tissue ratio
OP, osteoporosis/osteoporotic
REFERENCES
- 1.Newton-John HF, Morgan DB. The loss of bone with age, osteoporosis and fractures. Clin Orthop 1970;71:229–52. [PubMed] [Google Scholar]
- 2.Riggs BL, Wahner HW, Dunn WL. Differential changes in bone mineral density of the appendicular and axial skeleton with aging: relationship to spinal osteoporosis. J Clin Invest 1981;67:328–35. [DOI] [PMC free article] [PubMed] [Google Scholar]
- 3.Smith DM, Khairi MRA, Johnston CC. The loss of bone mineral with aging and its relationship to risk of fracture. J Clin Invest 1975;56:311–18. [DOI] [PMC free article] [PubMed] [Google Scholar]
- 4.Hartsock RJ, Smith EB, Petty CS. Normal variations with ageing of the amount of hematopoietic tissue in bone marrow from the anterior iliac crest; a study made from 177 cases of sudden death examined by necropsy. Am J Clin Pathol 1965;43:147–54. [DOI] [PubMed] [Google Scholar]
- 5.Meunier P, Aaron J, Edouard C, et al. Osteoporosis and the replacement of cell populations of the marrow by adipose tissue. A quantitative study of 84 iliac bone biopsies. Clin Orthop 1971;80:147–54. [DOI] [PubMed] [Google Scholar]
- 6.Uschiyama N, Takahashi N, Akatsu T, et al. Adipose conversion is accelerated in bone marrow cells of congenitally osteoporotic SAMP6 mice. J Bone Miner Res 1994;9(suppl 1):B365. [Google Scholar]
- 7.Bennett JH, Joyner JT, Triffitt JT, et al. Adipocytic cells cultured from marrow have osteogenic potential. J Cell Sci 1991;99:131–9. [DOI] [PubMed] [Google Scholar]
- 8.Beresford JN, Bennett JH, Devlin C, et al. Evidence of an inverse relationship between the differentiation of adipocytic and osteogenic cells in rat marrow stromal cell cultures. J Cell Sci 1992;102:341–51. [DOI] [PubMed] [Google Scholar]
- 9.Dorheim MA, Sullivan M, Dandapani V, et al. Osteoblastic gene expression during adipogenesis in hematopoietic supporting murine bone marrow stromal cells. J Cell Physiol 1993;154:317–28. [DOI] [PubMed] [Google Scholar]
- 10.Houghton A, Oyajobi BO, Foster GA, et al. Immortalization of human marrow stromal cells by retroviral transduction with a temperature sensitive oncogene. Identification of bipotential precursor cells capable of directed differentiation to either an osteoblast or adipocyte phenotype. Bone 1998;22:7–16. [DOI] [PubMed] [Google Scholar]
- 11.Seeman E, Tsalamandris C, Bass S, et al. Present and future of osteoporosis therapy. Bone 1995;17(suppl 2):23S–9S. [DOI] [PubMed] [Google Scholar]
- 12.Hirano T, Iwasaki K. Bone marrow plays a role in bone metabolism: histomorphometry of iliac bone in postmenopausal women. Calcif Tissue Int 1992;51:348–51. [DOI] [PubMed] [Google Scholar]
- 13.Rehman MTA, Hoyland JA, Denton J, et al. Histomorphometric classification of postmenopausal osteoporosis: implications for the management of osteoporosis. J Clin Pathol 1995;48:229–35. [DOI] [PMC free article] [PubMed] [Google Scholar]
- 14.Rehman MTA, Hoyland JA, Denton J, et al. Age related histomorphometric changes in bone in normal British men and women. J Clin Pathol 1994;47:529–34. [DOI] [PMC free article] [PubMed] [Google Scholar]
- 15.Compston JE, Mellish RWE, Croucher P, et al. Structural mechanisms of cancellous bone loss in man. Bone Miner 1989;6:339–50. [DOI] [PubMed] [Google Scholar]
- 16.Eriksen EF, Hodgson SF, Eastell R, et al. Cancellous bone remodelling in type I (postmenopausal) osteoporosis: quantitative assessment of rates of formation, resorption, and bone loss at tissue and cellular levels. J Bone Miner Res 1990;5:311–19. [DOI] [PubMed] [Google Scholar]
- 17.Parfitt AM, Mathews CHE, Villaneuva AR, et al. Relationships between surface volume and thickness of iliac cancellous bone in ageing and osteoporosis. J Clin Invest 1983;72:1396–409. [DOI] [PMC free article] [PubMed] [Google Scholar]
- 18.Parfitt AM, Drezner MK, Glorieux F, et al. Bone histomorphometry: standardisation of nomenclature, symbol, and units. J Bone Miner Res 1987;2:595–610. [DOI] [PubMed] [Google Scholar]
- 19.Byers RJ, Denton J, Hoyland JA, et al. Differential patterns of osteoblast dysfunction in cancellous bone in osteoporosis. J Clin Pathol 1997;50:760–4. [DOI] [PMC free article] [PubMed] [Google Scholar]
- 20.Aubin JE, Liu F, Malaval L, et al. Osteoblast and chondrocyte differentiation. Bone 1995;17(suppl 2):77S–83S. [DOI] [PubMed] [Google Scholar]


