Abstract
Aim: To investigate how effectively eye tracking devices can visualise the scanning patterns of pathologists, for application in studies on diagnostic decision making.
Methods: EyeCatcher, an eye tracking device, was used to visualise and compare the scanning patterns of five pathologists while they graded two projections of cervical intraepithelial neoplasia. Density cloud images were created from the scanning patterns. A questionnaire and interview provided information on the following steps in the diagnostic process.
Results: EyeCatcher successfully registered the scanning patterns of the pathologists. A “scanning style” and a “selective style” of visual search were distinguished. The scanning patterns, in addition to the interpretation and combination of the information ultimately leading to a diagnosis, varied between the various observers, resulting in a broad range of final diagnoses.
Conclusions: Eye gaze tracking devices provide an excellent basis for further discussion on the interpretation and grading criteria of lesions. As such, they may play an important role in studies on diagnostic decision making in pathology and in the development of training and quality control programmes for pathologists.
Keywords: visual search, eye tracking, diagnostic decision making, cervical intraepithelial neoplasia, observer variation
The study of images plays a crucial role in pathology. However, diagnoses based on images are often prone to interobserver variation. Interobserver variation may arise at three levels, which are not only influenced by previous knowledge and experience, but also depend on the applied diagnostic criteria. The first level concerns the visual search of the image, the second level involves the interpretation of the perceived visual information, and finally, the third level concerns the way the collected information is combined to reach a diagnosis. Investigation of each of these levels is necessary to study the origin of the interobserver variation.
“Eye tracking systems enable the visualisation of the eye points of gaze of a subject and provide possibilities to create computerised graphic representations of scanning patterns”
In radiology, earlier studies analysed the scanning patterns applied by physicians to detect and interpret breast and lung tumours.1–5 Recently, a study in this field was also performed in pathology, concentrating on the development of visual diagnostic expertise in breast pathology.6 In this study, the subjects’ search of a slide was captured on video through the microscope. However, in contrast to the radiology studies, no eye tracking systems were applied. Eye tracking systems enable the visualisation of the eye points of gaze of a subject and provide possibilities to create computerised graphic representations of scanning patterns.
We investigated whether eye gaze tracking devices could help to study diagnostic decision making in pathology and focused on the grading of cervical intraepithelial neoplasia (CIN), one of the fields within pathology often prone to interobserver variation.7–11 We combined eye gaze registration with a questionnaire and an interview to gain information on the influence of each criterion that contributes to the final diagnosis.
METHODS
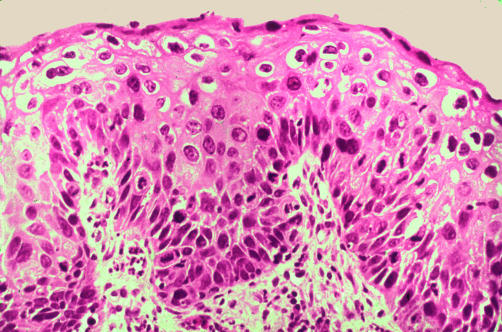
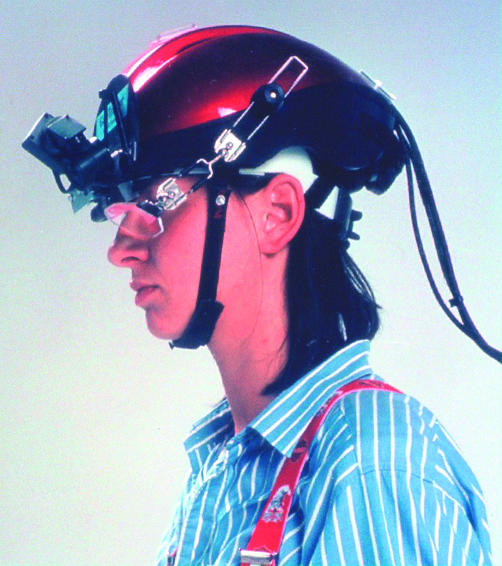
The eye gaze tracking system, EyeCatcher, used in our study uses infrared light reflections from the eye. Five pathologists experienced in the histopathological grading of CIN were asked to grade two CIN lesions while wearing a light weight helmet. The pathologists sat in front of a screen displaying successively two images of the CIN lesions (figs 1 and 2). The helmet was mounted with an infrared camera and an infrared light source, a mirror for reflection of the infrared light, and a miniature video camera (fig 3). The infrared light was reflected by the mirror on to the eye and consequently, by way of the eye and mirror, into the infrared camera. Given that infrared light is not visible to the human eye, the pathologists were unaware of the light beam.
Figure 1.
Cervical intraepithelial neoplasia lesion 1 with an atypical mitotic figure (arrow); haematoxylin and eosin staining.
Figure 2.
Cervical intraepithelial neoplasia lesion 2; haematoxylin and eosin staining.
Figure 3.
The EyeCatcher helmet.
This video image of the eye showed the position of the pupil and the location of the “hot spot”. The hot spot is the cornea’s reflection of the infrared light beam. From these two features, the computational part of the system determined the orientation of the eye in relation to the head. The miniature video camera was focused on the projection of the CIN lesion and the video image coming from the camera moved in synchronisation with the pathologist’s head.
The data representing the eye orientation were merged with the images from the miniature video camera. Thus, a video image of the CIN lesion was obtained with a pair of cross hairs indicating the points of gaze in time.
The video images and eye orientation data in digital form were used in a computer analysis to calculate the X and Y coordinates of the points of gaze of the pathologists. Using these coordinates, a graphic representation of the scanning pattern was created in which dots represented the points of gaze every 20 milliseconds. These graphics were blurred using a mathematical calculation to obtain density clouds representing the total amount of attention for each area. By use of colours, areas of high attention were highlighted.
In a briefing beforehand, the pathologists were presented with the Armed Forces Institute of Pathology (AFIP) criteria for the grading of CIN and were requested to grade only according to these descriptions.12
Each pathologist was assigned 45 seconds to grade the lesion and was requested to say “yes” as soon as he had reached a diagnosis. At 45 seconds, the CIN projection was covered and the pathologist was asked to answer several questions concerning the interpretation of the projected lesion. The same procedure was repeated for the second CIN lesion.
Afterwards, the pathologists were asked to comment on the test, criteria, and diagnoses during a structured interview.
With regard to the three levels in the diagnostic process, the EyeCatcher was used to register the first step, the scanning pattern, whereas the questionnaire and interview provided information on the next two steps, the interpretation and combination of the information, particularly with regard to the respective grading criteria.
RESULTS
Registration of the points of gaze
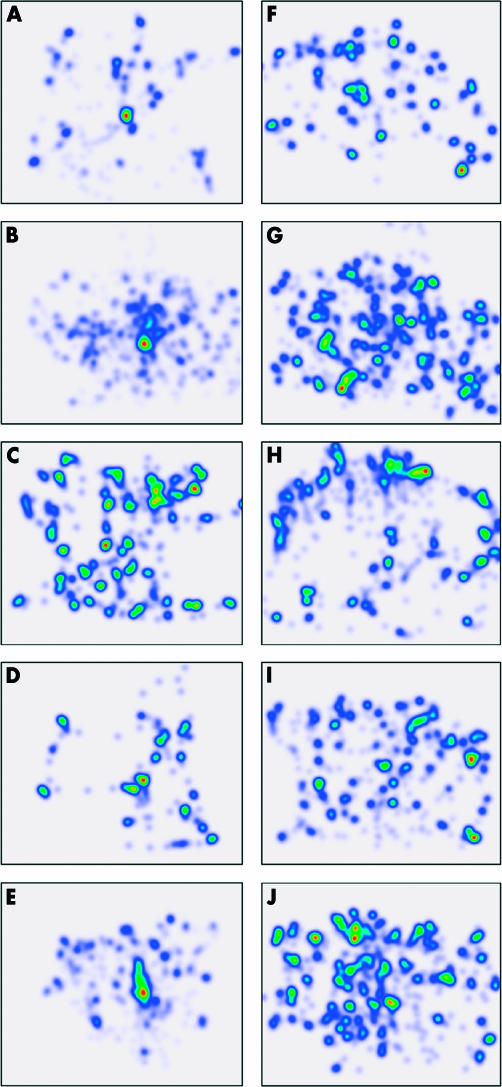
Figure 4 shows the density cloud images of the scanning pattern of each pathologist for both CIN lesions until time of diagnosis.
Figure 4.
The scanning patterns of pathologists 1 to 5 (top to bottom) for lesion 1 (A–E) and 2 (F–J), visualised in density cloud images. Differences in the relative amount of study time for each area are represented by different colours. The colour spectrum runs from red, yellow, green, turquoise, dark blue to light blue for high to low attention.
Lesion 1
In the first lesion, a prominent feature was present in the form of a mitotic figure in the middle of the projection. For all pathologists this was an important point of focus. Only the graphics of pathologists 3 and 4 also revealed other areas of high attention.
Pathologists 2 and 5 examined the image in a scanning manner, shortly focusing on many different points. This is represented by a large amount of light blue cloud scattered over the image. Pathologists 1, 3, and 4 examined the image in a more direct way and focused on specific points only. In contrast to the dark blue and green/red clouds, there are not many light blue areas present in the graphics of these pathologists. This direct way of looking is most apparent for pathologist 4, who took only seven seconds to gather the information for diagnosis in a highly selective manner.
Lesion 2
All pathologists needed more time to reach a diagnosis for lesion 2 than for lesion 1. For all pathologists except pathologist 3, more green/red areas are present in the graphics for lesion 2 than for lesion 1, which means that for lesion 2 the attention was more equally spread over the entire image. In lesion 2 as a whole, more blue areas are present in the graphics in accordance with the longer diagnostic time.
Pathologists 1, 3, and 4 showed more or less the same direct way of looking at lesion 2 as at lesion 1, whereas pathologist 3 showed special attention to the higher regions of the image.
Registration of the order of the scanning procedure
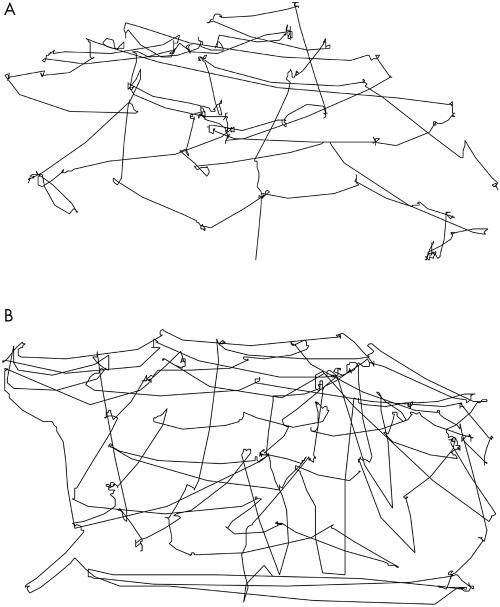
The order in which the images were analysed can be studied by connecting the points of gaze in time. The structures of the scanning patterns of the five pathologists often exhibited noticeable differences. Figure 5 shows a clear example of two different structures of the scanning patterns of pathologists (1 and 4) looking at lesion 2.
Figure 5.
Structure of the scanning patterns of (A) pathologist 1 and (B) pathologist 4 for lesion 2.
The eye gaze of pathologist 1 was initially directed at the bottom of the lesion, then moved up to the surface and subsequently slowly moved down again with mostly horizontal movements. Pathologist 2 showed a tidy structure of both horizontal and vertical movements. The movements of the eye gaze below may indicate a quick scanning of the basement membrane.
Interpretation and diagnostic decision making
As shown in table 1, the highest variation in the interpretation of the criteria was found for the level of nuclear atypia and the level of abnormal maturation. The answers concerning the mitotic activity did not vary, whereas the answers concerning the atypical character of the mitoses varied for both lesions (data not shown). For lesion 1, all pathologists but one reported the presence of atypical mitoses. Pathologist 2 refrained from answering. For lesion 2, only pathologists 3 and 4 reported the presence of atypical mitoses.
Table 1.
Interpretation and diagnostic decision making for lesions 1 and 2
| Pathologist | Time until diagnosis (sec) | Abnormal maturation* | Nuclear atypia* | Mitotic activity* | Basement membrane | Order of criteria | Diagnosis | |
| Lesion 1 | 1 | 16 | Up to 2/3 | Up to 2/3 | Up to 2/3 | Intact | B | CIN 2 |
| 2† | 45 | Up to 2/3 | Up to 2/3 | Up to 2/3 | Intact | B | CIN 3 | |
| 3 | 20 | Up to 3/3 | Up to 2/3 | Up to 2/3 | Intact | A | CIN 3 | |
| 4 | 7 | Up to 3/3 | Up to 3/3 | Up to 2/3 | Intact | D | CIN 3 | |
| 5† | 28 | Up to 3/3 | Up to 2/3 | Up to 2/3 | Intact | A | CIN 2 | |
| Lesion 2 | 1 | 18 | Up to 2/3 | Up to 3/3 | Up to 1/3 | Intact | C | CIN 3 |
| 2 | 45 | Up to 1/3 | Up to 1/3 | Up to 1/3 | Intact | C | CIN 1 | |
| 3 | 32 | Up to 2/3 | Up to 2/3 | Up to 1/3 | Intact | A | CIN 2 | |
| 4 | 26 | Up to 3/3 | Up to 3/3 | Up to 1/3 | Intact | C | CIN 3 | |
| 5† | 31 | Up to 1/3 | Up to 3/3 | Up to 1/3 | Intact | A | CIN 1 |
Order of criteria: A, proliferation→nuclear atypia→mitotic activity→basement membrane; B, proliferation→mitotic activity→nuclear atypia→basement membrane; C, nuclear atypia→proliferation→mitotic activity→basement membrane; D, nuclear atypia→mitotic activity→proliferation→basement membrane.
*Up to X/3 of the epithelium involved; †diagnosis in discordance with Armed Forces Institute of Pathology criteria.
CIN, cervical intraepithelial neoplasia.
On three occasions, the final diagnosis was not reached in accordance with the AFIP criteria. One of the pathologists graded lesion 1 as CIN 3, although he reported the presence of abnormal maturation, nuclear atypia, and mitoses limited to no more than two thirds of the epithelium. Another pathologist graded lesion 1 as CIN 2, although reporting the presence of abnormal maturation and nuclear atypia extending to three thirds of the epithelium. The same pathologist graded lesion 2 as CIN 1 in the presence of nuclear atypia in three thirds of the epithelium.
DISCUSSION
We found that the pathologists studied the CIN lesions in different ways, with regard to the areas they examined, the amount of study time for each area, and the order in which the areas were studied. The amount of time needed to reach a diagnosis also varied considerably.
Two types of scanning patterns were distinguished. First, a scanning type of search whereby the pathologists focused on many points within the image but only for a short moment. Second, a selective type of search whereby the pathologists limited their search to specific points within the lesion which they studied for a relatively long time. The differences in scanning patterns between the pathologists were remarkable, especially considering the fact that all pathologists were requested to grade according to the same criteria.
The judgement of the levels to which abnormal proliferation and nuclear atypia were present varied considerably. Most of the questions raised by the pathologists in the questionnaire and interview concerned the interpretation of the level to which nuclear atypia was present, in addition to the extent to which it should influence the final diagnosis. The AFIP states that if pronounced nuclear atypia is noted in the presence of normal maturation in the same layer of the epithelium, and if this nuclear atypia is not the kind of atypia associated with productive human papillomavirus (HPV) infection, the CIN level should be upgraded.12 However, most pathologists found it difficult to follow this advice, especially during their judgement of lesion 2. They doubted whether the nuclear atypia was HPV related and whether the nuclear atypia was substantial enough to upgrade the CIN level. This was the reason for the large variation in diagnoses for lesion 2.
“The broad range of diagnoses found is especially remarkable because only one selected image was shown for each case”
Studying the density cloud images one can speculate to a certain extent about the criteria studied in the specific areas for both lesions. In lesion 1, the mitotic figure in the middle is obviously a very recognisable criterion. In lesion 2, more red/green areas are present in the graphics. This indicates that the attention of the pathologists was more equally spread over the entire image, probably because of the lack of a main point of attraction. With regard to the other areas that received more than average attention, the criteria studied can also be speculated about. Particularly in the upper layers of the lesions, it is probable that the nuclear atypia was the criterion studied, because the cells here have irregular nuclei, although they are differentiating rather well. Pathologist 3 in particular often focused on these upper layers of the epithelium, most evidently for lesion 2. He was one of the three pathologists who questioned the nuclear atypia afterwards during the interview.
We found an impressive spread of diagnoses. The broad range of diagnoses found is especially remarkable because only one selected image was shown for each case. In a normal clinical situation, pathologists often base their judgement on many more images and select the most relevant area(s) within the biopsy, which probably contributes towards the interobserver variation. In our study, by selecting one single image, the number of potential influencing variables was minimised, thus allowing us to study the origin of the interobserver variation as closely as possible.
Take home messages.
EyeCatcher distinguished two scanning patterns in the five pathologists: a “scanning style” and a “selective style” of visual searching
The scanning patterns, in addition to the interpretation and combination of the information ultimately leading to a diagnosis, varied between the various observers, resulting in a broad range of final diagnoses.
Eye gaze tracking devices could play an important role in studies on diagnostic decision making in pathology and in the development of training and quality control programmes for pathologists
Hypothetically, the wide spread in diagnoses found in our study may arise from the differences in scanning patterns. However, the different scanning patterns are probably a reflection of differences in the way the images were interpreted and the way the grading criteria were applied by the pathologists. By showing the areas of high attention during the visual search by the pathologist, eye tracking devices provide an excellent basis for further discussion on the interpretation and grading criteria. Eye tracking devices as such may be a valuable asset in pathology, for detailed studies on diagnostic decision making, in addition to the development of training and quality control programmes for pathologists.
Acknowledgments
We are indebted to M Witjes for his technical help and to H van Krieken, F van Kemenade, M van de Vijver, J Calame, M Veselic, and K van Leeuwen for their participation in the experiment.
Abbreviations
AFIP, Armed Forces Institute of Pathology
CIN, cervical intraepithelial neoplasia
HPV, human papillomavirus
REFERENCES
- 1.Kundel HL, Nodine CF, Krupinski EA. Searching for lung nodules: visual dwell indicates locations of false-positive and false-negative decisions. Invest Radiol 1989;24:472–8. [PubMed] [Google Scholar]
- 2.Kundel HL, Nodine CF, Toto L. Searching for lung nodules: the guidance of visual scanning. Invest Radiol 1991;26:777–81. [DOI] [PubMed] [Google Scholar]
- 3.Barrett JR, deParedes ES, Dwyer SJ, 3rd, et al. Unobtrusively tracking eye gaze direction and pupil diameter of mammographers. Acad Radiol 1994;1:40–5. [DOI] [PubMed] [Google Scholar]
- 4.Hu CH, Kundel HL, Nodine CF, et al. Searching for bone fractures: a comparison with pulmonary nodule search. Acad Radiol 1994;1:25–32. [DOI] [PubMed] [Google Scholar]
- 5.Nodine CF, Kundel HL, Lauver SC, et al. Nature of expertise in searching mammograms for breast masses. Acad Radiol 1996;3:1000–6. [DOI] [PubMed] [Google Scholar]
- 6.Crowley RS, Naus GJ, Stewart J, III, et al. Development of visual diagnostic expertise in pathology—an information processing study. J Am Med Inform Assoc 2003;10:39–51. [DOI] [PMC free article] [PubMed] [Google Scholar]
- 7.Ismail SM, Colclough AB, Dinnen JS, et al. Observer variation in histopathological diagnosis and grading of cervical intraepithelial neoplasia. BMJ 1989;298:707–10. [DOI] [PMC free article] [PubMed] [Google Scholar]
- 8.Robertson AJ, Anderson JM, Swanson Beck J, et al. Observer variability in histopathological reporting of cervical biopsy specimens. J Clin Pathol 1989;42:231–8. [DOI] [PMC free article] [PubMed] [Google Scholar]
- 9.Anderson MC, Brown CL, Buckley CH, et al. Current views on cervical intraepithelial neoplasia. J Clin Pathol 1991;44:969–78. [DOI] [PMC free article] [PubMed] [Google Scholar]
- 10.Ringsted J, Amtrup F, Asklund C, et al. Reliability of histo-pathological diagnosis of squamous epithelial changes of the uterine cervix. Acta Pathol Microbiol Scand [A] 1978;86:273–8. [DOI] [PubMed] [Google Scholar]
- 11.Cocker J, Fox H, Langley FA. Consistency in the histological diagnosis of epithelial abnormalities of the cervix uteri. J Clin Pathol 1968;21:67–70. [DOI] [PMC free article] [PubMed] [Google Scholar]
- 12.Kurman RJ, Norris HJ, Wilkinson EJ. Tumors of the cervix, vagina, and vulva. In: Kurman RJ, Norris HJ, Wilkinson EJ, editors. Atlas of tumor pathology, 3rd series, fascicle 4. Washington, DC: Armed Forces Institute of Pathology, 1992:46–51.


