Abstract
This report describes a hepatocellular carcinoma (HCC) with concomitant focal nodular hyperplasia (FNH) in a 56 year old Chinese man. There were two well circumscribed tumours measuring 3 × 2.5 × 2 cm and 2 × 1.5 × 1.5 cm. The larger mass was grey and soft with a small area of bleeding and necrosis and an intact capsule. The smaller mass was yellow and had no capsule. Clonal analysis was carried out to clarify the relation between the HCC and the adjacent FNH. The clonal analysis was based on the methylation pattern of the polymorphic X chromosome linked androgen receptor gene (HUMARA). In FNH, after HpaII digestion, the allelic bands showed two well defined peaks. The intensity of the two peaks in the DNA from cirrhotic tissue did not differ significantly, consistent with a random pattern of X chromosome inactivation. However, in HCC, after HpaII digestion, the allelic bands differed significantly in intensity. Therefore, there was a typical polyclonal pattern of inactivation in FNH but the HCC was interpreted as being monoclonal.
Keywords: focal nodular hyperplasia, hepatocellular carcinoma, androgen receptor gene, HUMARA, clonality
Focal nodular hyperplasia (FNH) is a benign tumour-like lesion of the liver. It is generally considered to be a hyperplastic response to an abnormal blood supply, rather than a neoplastic process.1 However, its nature and pathogenesis are still controversial. Although some reports have indicated an association between FNH and hepatocellular carcinoma (HCC), most authors do not consider there to be a pathogenetic correlation between them.2–4 Here, we describe a patient with FNH and concomitant HCC, in whom we evaluated the clonality of both lesions using the HUMARA (methylation pattern of the polymorphic X chromosome linked androgen receptor gene) assay.
CASE REPORT
A 56 year old Chinese man, with a history of pernicious anaemia for several years, was noted to have hepatomegaly in a routine follow up. Laboratory data were as follows: aspartate aminotransferase, 48.7 U/litre (normal, < 34); alanine aminotransferase, 57.3 U/litre (normal, < 36); alkaline phosphatase, 143 U/litre (normal, < 96); and γ-glutamyltransferase, 161 IU/litre (normal, < 96). Serum α fetoprotein was 126.3 µg/litre (normal, < 25). Serum hepatitis B virus surface antigen was positive and antihepatitis C virus antibody was negative. Imaging studies, including computed tomography (CT), abdominal ultrasound, and angiography, showed a heterogeneous, hypervascular enhancing mass in the right hepatic anterior lobe and medial portion with central necrosis. Another mass was slightly hypodense to the liver on unenhanced CT in the left hepatic lobe, and hyperdense to the liver during contrast enhanced CT. There were no tumour thrombi within the portal veins. After the liver tumour was resected, the serum α fetoprotein concentrations returned to within the normal range.
MATERIAL AND METHODS
Representative sections were taken from the surgical specimen, fixed in formalin, and embedded in paraffin wax. Histological sections were stained with haematoxylin and eosin.
DNA extraction
DNA was extracted from five to 10 paraffin wax embedded sections (each 5 µm thick). When necessary, the area of interest was outlined and scraped with a clean scalpel blade. DNA extraction from lesional and non-lesional tissues was performed using the standard phenol/chloroform extraction and ethanol precipitation method.5 In brief, cirrhotic or cancer tissues were incubated with 2 ml lysis/digestion buffer (1% sodium dodecyl sulfate, 1mM EDTA, 50mM Tris (pH 8.5), and 100 μg proteinase K/ml) at 52°C for 16 hours. The digested lysate was subjected to two further extractions with an equal volume of chloroform/phenol/isoamyl alcohol (24/25/1). After centrifugation, the DNA was precipitated from the aqueous phase by two volumes of cold absolute ethanol and collected with a glass rod.6 The DNA was purified further with RNase digestion and a two step phenol/chloroform extraction; it was then precipitated and collected as described above. The concentration of DNA was determined by both spectrophotometric and fluorometric methods, and it was stored at 4°C.
Assessment of clonality
Clonality at the HUMARA locus was assessed by polymerase chain reaction (PCR), as described previously.7 Briefly, 500–1000 ng of lesional or non-lesional DNA was digested overnight at 37°C in a 15 µl reaction mixture containing 10 units of HpaII (Boehringer Mannheim GmbH, Meylan, France). For each specimen, a control sample containing only restriction enzyme buffer was run simultaneously. The restriction enzyme was then inactivated by heating at 95°C for 10 minutes.
For the PCR, 2 µl of each DNA reaction mixture sample was added to 18 µl of PCR reaction mixture containing 2 µl of 10× PCR buffer, 1 µl of 25 mmol/litre MgCl2, 2 µl of each dNTP (200 µmol/litre), 1 µl of each primer (10 pmol), 0.3 µl of AmpliTaq Gold DNA polymerase (Perkin-Elmer Cetus, Foster City, California, USA), and 10.7 µl of deionised H2O. The sequences of the primers used for amplification of the HUMARA DNA were: 5′-GCTGTGAAGGTTGCTGTTCCTCAT-3′ (primer 1) and 5′-TCCAGAATCTG TTCCAGAGCGTGC-3′ (primer 2).7 Primer 1 was labelled at the 5′ end with fluoroscein. Initial denaturation was performed for 10 minutes at 94°C, followed by 30 cycles of 30 seconds at 94°C, 30 seconds at 60°C, and one minute at 72°C, with a final extension at 72°C for seven minutes. All PCR samples were run in duplicate.
PCR products were purified twice in 70% alcohol after amplification. The injection mixture for each capillary was prepared by adding the following to each well of the injection plate: 2 μl purified sample, 0.25 μl ET400-R size standard, and 2.75 μl loading solution (Amersham Pharmacia Biotech, Piscataway, New Jersey, USA). The injection mixtures were centrifuged and heat denatured for two minutes at 94°C, immediately cooled, and placed on ice until ready to inject. Samples were electrophoresed on a MegaBACE-500 capillary array electrophoresis sequencer, and the fluorescent signals from the different sized alleles were recorded and analysed using Genetic Profiler version 2.1 software.
Data interpretation
For each sample, the peak intensities of the two alleles (alleles 1 and 2) were measured. A corrected ratio (CR) was first assessed by dividing the ratio (allele 1/allele 2) of the digested sample obtained after digesting DNA with HpaII by the ratio (allele 1/allele 2) of the non-digested sample. The CR corrects for the preferential amplification of one allele, which might occur if the alleles differ greatly in length. A final clonality ratio for each tumour was determined by dividing the CR of the lesional DNA by the CR of the non-lesional DNA. This final clonal ratio corrects for the potential skewed lyonisation. The ratio is inverted if necessary to obtain a value up to 1. According to Paradis et al,7 a final ratio of 1.5 corresponded to the presence of 25% of clonal DNA in a polyclonal background. This value (1.5) was the threshold of sensitivity of the assay. Higher values indicated the presence of a significant number of clonal cells (arbitrarily defined threshold for clonality).
RESULTS
Pathological findings
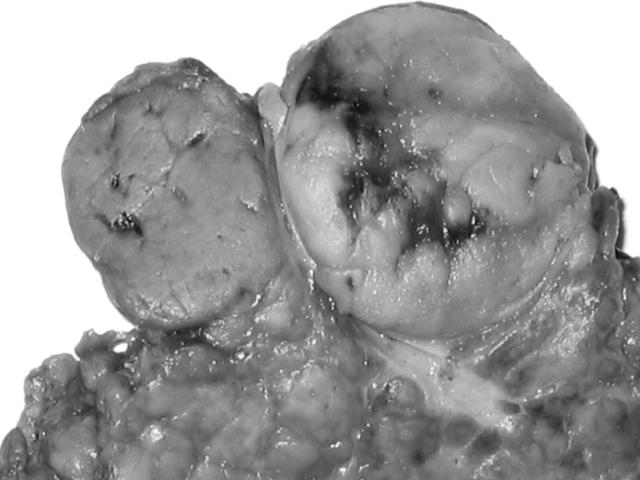
Grossly, the resected liver tissue measured 7 × 6 × 4 cm. There were two well circumscribed tumours measuring 3 × 2.5 × 2 cm and 2 × 1.5 × 1.5 cm. The larger mass was grey and soft with a small area of bleeding and necrosis and an intact capsule. The smaller mass was yellow and had no capsule. An aberrant vessel penetrated through the grey part. However, no central scar was found in the yellow part. The non-tumorous portion showed obvious cirrhotic nodularity (fig 1).
Figure 1.
The liver tumour was composed of two different masses. The right mass was grey and soft with a small area of bleeding and necrosis. The left mass was yellow.
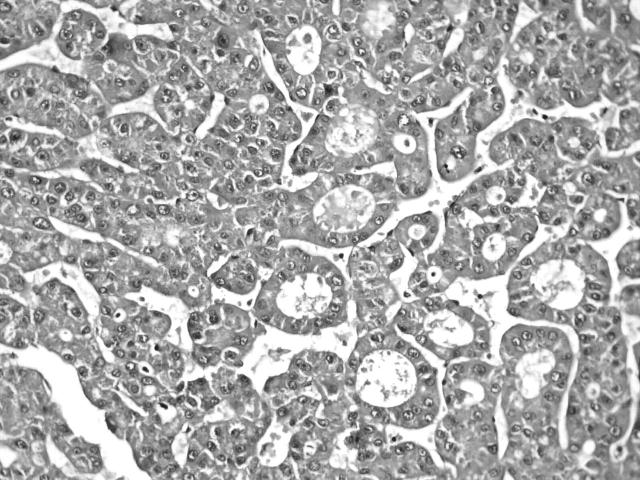
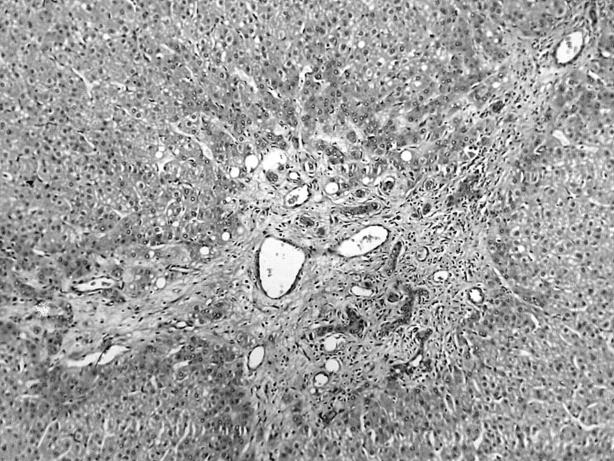
Microscopically, the yellow mass was composed of large hyperplastic hepatocytes with mild anisonucleosis. There were scattered fibrous septa and abnormal portal tracts with bile ductular proliferation and thick walled arterioles (fig 2). The nodule was completely or incompletely surrounded by circular or short fibrous septa. The hepatic plates were moderately thickened (two or three cells in thickness), but they usually alternated with single cell plates. They were composed of normal appearing hepatocytes, which could be focally atrophied, especially in the vicinity of sinusoidal dilatation, or rarely hypertrophied. Hepatocytes at the fibrous septal interface always showed some degree of ballooning. The grey mass was a classic HCC arranged in trabecular and acinar patterns with a small area of necrosis (fig 3). The tumour cells were growing in cords of variable thickness, which were separated by sinusoid-like blood spaces. The glandular or acinar structures were formed mostly by a single layer of tumour cells. A fibrous septum was present between the two liver tumours. The non-tumour part showed cirrhotic change.
Figure 2.
The yellow portion of the liver tumour was composed of large hyperplastic hepatocytes with short fibrous septa containing malformed vessels and bile ductules. Haematoxylin and eosin stain; original magnification, ×100.
Figure 3.
The grey portion of the liver tumour showed a classic hepatocellular carcinoma arranged in trabecular and acinar patterns. Haematoxylin and eosin stain; original magnification, ×200.
Clonal analysis
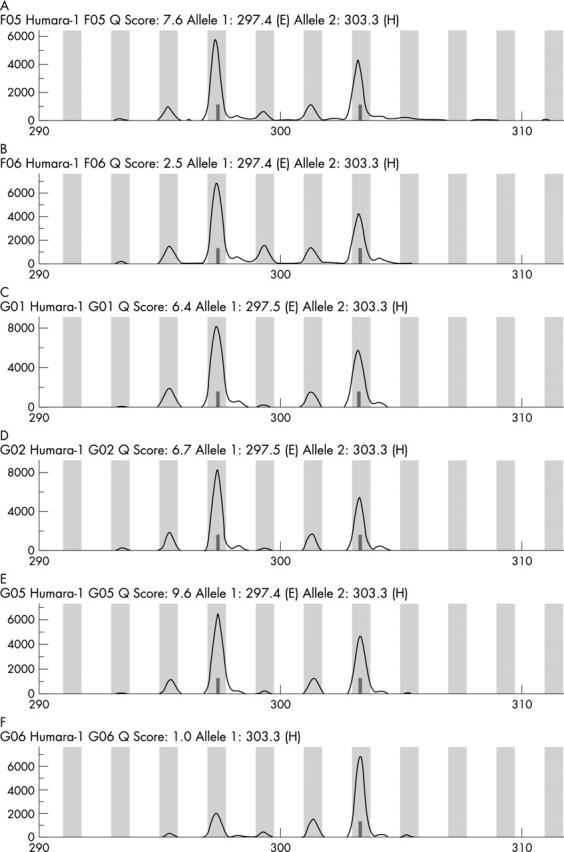
Figure 4 shows the result of the clonal analysis. Without restriction enzyme digestion by HpaII, there were two allelic bands with equal intensity present, indicating that our patient’s HUMARA gene was heterozygous and could be analysed. In the FNH lesion, after HpaII digestion, the allelic bands showed two well defined peaks, differing in size by two CAG repeats, corresponding to the two alleles of the HUMARA gene. The intensity of the two peaks in the DNA from the cirrhotic tissue did not differ significantly, consistent with a random pattern of X chromosome inactivation. It showed a typical polyclonal pattern of inactivation, with a final ratio value of 1.1. In HCC, after HpaII digestion, there was a significant reduction in the intensity of the allelic bands. Thus, the HCC was interpreted as being monoclonal.
Figure 4.

Clonal analysis. The results of the HUMARA assay in cirrhotic liver tissue (A) without digestion or (B) after HpaII digestion. Peaks 1 and 2 correspond to the two distinct alleles of the liver tissue. The results in focal nodular hyperplasia (FNH) (C) without digestion or (D) after HpaII digestion. DNA from cirrhotic liver tissue and FNH showed the same methylation pattern with and without HpaII digestion, consistent with a polyclonal pattern. The results in hepatocellular carcinoma (HCC) (E) without digestion or (F) after HpaII digestion. In HCC, a significant decrease of allele 2 was seen after HpaII digestion, consistent with a monoclonal pattern.
DISCUSSION
The liver tumour described here comprised two different parts with different histological features. The yellow part was composed of large hyperplastic hepatocytes with abnormal nodular architecture, malformed vessels, and bile ductule proliferation. Although the central scar was absent in this mass, the lesion fulfilled the morphological diagnostic criteria of a FNH.1 The grey mass was a classic HCC. Associations between HCC and FNH have rarely been described. To our knowledge, two were fibrolamellar variants of HCC and one was a classic HCC.2–4
Take home messages.
We describe a hepatocellular carcinoma (HCC) with concomitant focal nodular hyperplasia (FNH) in which we undertook clonal analysis of the HUMARA gene
The FNH showed a typical polyclonal pattern of inactivation but the HCC showed a monoclonal pattern
These results do not support the notion that the HCC was the result of malignant transformation of the FNH, which may have developed secondary to the feeding artery of the HCC
The nature of FNH is still not clear. Chen and colleagues8 used comparative genomic hybridisation to evaluate genomic changes in hepatic adenoma, FNH, and HCC. The results showed that the overall genomic abnormalities in hepatic adenoma and FNH were much less obvious than those in HCC. The comparative genomic hybridisation alterations found in FNH did not coincide with the common genomic lesions of cancerous HCC. Paradis and colleagues7 reported 13 FNHs, which showed a typical polyclonal pattern of inactivation, with a mean final ratio value of 1.1, strongly supporting the hypothesis that FNH is a reactive polyclonal process showing random X chromosome inactivation. However, conflicting results were reported by other authors4,9 using the same method. Chen and colleagues4 reported that the inactivated alleles in FNH and HCC were not identical. These results indicated that the HCC and adjacent FNH probably developed through clonal expansion of two different clones.
“Associations between hepatocellular carcinoma and focal nodular hyperplasia have rarely been described”
Our results also showed a typical polyclonal pattern of inactivation in the FNH, and a monoclonal pattern in the HCC. Therefore, our study did not support the notion that the HCC was the result of malignant transformation of the FNH. It is possible that the FNH developed secondary to the feeding artery of the HCC in our case.
Abbreviations
CR, corrected ratio
CT, computed tomography
FNH, focal nodular hyperplasia
HCC, hepatocellular carcinoma
HUMARA, polymorphic X chromosome linked androgen receptor gene
PCR, polymerase chain reaction
REFERENCES
- 1.Nguyen BN, Flejou JF, Terris B, et al. Focal nodular hyperplasia of the liver: a comprehensive pathologic study of 305 lesions and recognition of a new histologic form. Am J Surg Pathol 1999;23:1441–54. [DOI] [PubMed] [Google Scholar]
- 2.Saul SH, Titelbaum DS, Gansler TS, et al. The fibrolamellar variant of hepatocellular carcinoma: its association with FNH. Cancer 1987;60:3047–55. [DOI] [PubMed]
- 3.Saxena R, Humphreys S, Williams R, et al. Nodular hyperplasia surrounding fibrolamellar carcinoma: a zone of arterialized liver parenchyma. Histopathology 1994;25:275–8. [DOI] [PubMed] [Google Scholar]
- 4.Chen TC, Chou TB, Ng KF, et al. Hepatocellular carcinoma associated with focal nodular hyperplasia. Report of a case with clonal analysis. Virchows Arch 2001;438:408–11. [DOI] [PubMed] [Google Scholar]
- 5.Sood AK, Buller RE. Genomic instability in ovarian cancer: a reassessment using an arbitrarily primed polymerase chain reaction. Oncogene 1996;13:2499–504. [PubMed] [Google Scholar]
- 6.Weber JL, May PE. Abundant class of human DNA polymorphism which can be typed using the polymerase chain reaction. Am J Hum Genet 1989;44:388–96. [PMC free article] [PubMed] [Google Scholar]
- 7.Paradis V, Laurent A, Flejou JF, et al. Evidence for the polyclonal nature of focal nodular hyperplasia of the liver by the study of X-chromosome inactivation. Hepatology 1997;26:891–5. [DOI] [PubMed] [Google Scholar]
- 8.Chen YJ, Chen PJ, Lee MC, et al. Chromosomal analysis of hepatic adenoma and focal nodular hyperplasia by comparative genomic hybridization. Genes Chromosomes Cancer 2002;35:138–43. [DOI] [PubMed] [Google Scholar]
- 9.Gaffey MJ, Iezzoni JC, Weiss LM. Clonal analysis of focal nodular hyperplasia of the liver. Am J Pathol 1996;148:1089–96. [PMC free article] [PubMed] [Google Scholar]


