

Abstract
Aims: To measure vascular endothelial growth factor (VEGF-A) mRNA in a large, diverse cohort of tumours and to investigate whether VEGF-A expression is associated with markers of hypoxia, including hypoxia inducible factor 1α (HIF-1α) and carbonic anhydrase IX (CA9).
Methods: The expression of VEGF-A and CA9 was assessed in 5067 fresh frozen human tissue samples and 238 cell lines by DNA microarray analysis. In addition, tissue microarrays were constructed from 388 malignancies to investigate the expression of VEGF-A and HIF-1α by in situ hybridisation and immunohistochemistry, respectively.
Results: VEGF-A was significantly upregulated in primary malignancies of the breast, cervix, colon and rectum, oesophagus, head and neck, kidney, ovary, skin, urinary system, and white blood cells by DNA microarray analysis. However, VEGF-A expression only correlated with CA9 expression in renal tissues. In the tissue microarrays, HIF-1α positive cores showed a significant increase in VEGF-A expression in lung, ovary, soft tissue, and thyroid malignancies.
Conclusions: The expression of VEGF-A is upregulated in a large proportion of human malignancies, and may be associated with markers of hypoxia. VEGF-A expression can be induced in the absence of hypoxia and hypoxia does not always provoke VEGF-A upregulation in tumours.
Keywords: vascular endothelial growth factor, hypoxia inducible factor one alpha, carbonic anhydrase IX, angiogenesis, neoplasia
During tumorigenesis, solid lesions first undergo an avascular phase of growth, until the diffusion of oxygen and the exchange of waste and nutrients become rate limiting.1 The growth and survival of these small colonies (usually <1 mm3) is dependent both on their ability to promote angiogenesis and to adapt to hypoxic conditions.1–4 Indeed, even large tumours suffer from a structurally and functionally abnormal vasculature that results in regions of hypoxia, despite an increase in microvascular density.5
Environments with a low oxygen tension activate a series of transcriptional regulators in human cells, including hypoxia inducible factor 1 (HIF-1).6 HIF-1 is a heterodimeric transcription factor composed of HIF-1α and the constitutively expressed aryl hydrocarbon receptor nuclear translocator (also known as HIF-1β), which are basic helix–loop–helix–PAS domain proteins.7 Both the amount and activity of this heterodimer are kept to a minimum in normoxic cells by a series of oxygen dependent, post translational modifications to the HIF-1α protein.6 The best characterised regulatory mechanism is contingent on protein modification by oxygen dependent prolyl hydroxylases, which is required for binding to a von Hippel-Lindau (VHL) E3 ubiquitin protein ligase that targets HIF-1α for proteasomal degradation.8,9 Under hypoxic conditions, oxygen becomes rate limiting for prolyl hydroxylation,10 and the turnover of HIF-1α decreases accordingly, allowing HIF-1α to accumulate intracellularly.11
“Environments with a low oxygen tension activate a series of transcriptional regulators in human cells, including hypoxia inducible factor 1”
As part of an adaptive physiological response to hypoxia, HIF-1 upregulates the expression of genes that are involved in glycolysis,12–14 erythropoiesis,15 and angiogenesis.12–14,16 Specifically, the promoters 5′ to vascular endothelial growth factor (VEGF-A) and carbonic anhydrase IX (CA9) contain sequences that mediate hypoxia induced transcription and have a high degree of homology to known HIF-1 binding sites (hypoxia response elements).17–20 VEGF-A encodes a proangiogenic ligand, which can transduce angiogenesis through specific tyrosine kinase receptors, principally expressed by angioblasts and endothelial cells.21 The expression of VEGF-A is upregulated to varying degrees in a wide range of human malignancies during tumorigenesis.21 Signalling by growth factors (for example, epithelial growth factor, transforming growth factors α and β, interleukins 1β and 6, platelet derived growth factor, insulin-like growth factor I, and keratinocyte growth factor 1)22–24 and hormones (for example, thyroid stimulating hormone, adrenocorticotrophic hormone, and angiotensin II)25–27 is also implicated in increased transcription of VEGF-A, although the relative contribution of these two mechanisms has yet to be characterised extensively in different tumour types.
High expression of VEGF-A has been associated with a worse survival and an increased incidence of disease recurrence in many malignancies, including cancers of the breast,28–30 colon and rectum,31–35 ovary,36,37 kidney,38 cervix,39 and head and neck.40 HIF-1α activation correlates with a worse prognosis and resistance to treatment in ovarian, head and neck, and oesophageal cancer.41,42 Similarly, CA9 expression is an adverse prognostic indicator in patients with invasive breast carcinoma,43 nasopharyngeal carcinoma,44 cervical carcinoma,45 and non-small cell lung cancer.46 Therefore, accurate and reliable assays of VEGF-A expression and hypoxia have assumed prognostic and therapeutic importance. Nevertheless, none of the techniques used to measure VEGF-A expression has been widely applied, prohibiting reliable interlaboratory comparisons.
The aim of our study was to measure VEGF-A mRNA values in a large, diverse cohort of malignancies. In addition, we sought to investigate the published correlations between VEGF-A expression and markers of hypoxia.
METHODS
DNA microarray experiments
The Gene Logic® (Gaithersburg, Maryland, USA) database of Affymetrix® HG-U133 GeneChip® probearray data was screened for probes that corresponded to the VEGF-A and CA9 mRNA sequences (Genbank accession numbers M32977 and NM_001216, respectively). Probes with the highest proportion of samples called “present” were chosen for downstream analysis on 7579 fresh frozen human tissue samples and 225 cell lines. (Gene Logic performed tissue sample preparation and data analysis.) Probeset 210512_s_at was chosen to represent VEGF-A expression and probeset 205199_at to represent CA9 expression.
Tissue microarray experiments
Tissue culture
The human tumour cell lines 786-0 (renal cell adenocarcinoma); A673 (rhabdomyosarcoma); SK-MES-1 (lung squamous cell carcinoma); SW480, KM12, HCT15, HCT116, and COLO205 (all human colorectal adenocarcinomas); SkBr3, MDA-MB-453S, MDA-MB-231, MCF7, and MDA-MB-175-VII (all breast adenocarcinomas); and CALU6 (anaplastic carcinoma) were obtained from the American Tissue Culture Collection (Manassas, Virginia, USA). H322 (lung non-small cell carcinoma) was obtained from the National Cancer Institute (Bethesda, Maryland, USA). Chinese hamster ovary (CHO) cells transfected with human VEGF-A were established as described previously.47 Cell lines were cultured in vitro according to the protocols, harvested after the first passage, fixed in 10% neutral buffered formalin, and embedded in paraffin wax.
Selection of human tissues
Formalin fixed, paraffin wax embedded tissue cassettes and corresponding haematoxylin and eosin (H&E) stained sections were retrieved from the histopathology archives at Genentech, South San Francisco, California, USA and the Leeds Teaching Hospitals NHS Trust, UK. (Appropriate ethical approval was obtained for all research conducted using human tissues.) H&E sections were reviewed (KJH) and representative regions of malignant cells were annotated on the slide to aid tissue microarray (TMA) core sampling.
Preparation of synthetic control blocks
cDNA probe templates were generated from human kidney marathon-ready cDNA (BD Clontech, Palo Alto, California, USA). Primers were designed to amplify a 604 bp fragment of VEGF-A mRNA. Sense and antisense primers contained T7 and T3 RNA polymerase initiation sites, respectively (sense, GGATTCTAATACGACTCACTATAGGGCGGGCCTCCGAAACCATGAACT; antisense, CTATGAAATTAACCCTCACTAAAGGGATCCTCCTGCCCGGCTCAC). Each 50 μl polymerase chain reaction (PCR) contained 0.5 ng of cDNA, 33 ng of each primer, 0.6mM dNTPs (0.15mM each dATP, dCTP, dGTP, dTTP), 1× polymerase mix, 1× buffer, and 1.0M GC-Melt (BD Clontech). The thermal cycling conditions were: 94°C for five minutes, followed by 30 cycles of 94°C for one minute and 68°C for 30 seconds. Sense and antisense RNA fragments were transcribed from this template using T7 and T3 RNA Megascript kits, respectively (Ambion, Austin, Texas, USA). Fragments were embedded in 2% agarose at a concentration of 5 μg/ml, and processed as described previously.48 Blank 2% agarose controls were processed in an identical manner.
Tissue microarray construction
TMAs were constructed to represent the case series using a Beecher Instruments’ microarrayer (Silver Spring, Maryland, USA), as described previously.49 In total, 388 tissues were sampled (three adrenal, 83 breast, two endometrium, three kidney, three liver, 78 lung, 71 ovary, four pancreas, 78 soft tissue, and 63 thyroid), in addition to the cell pellets and synthetic control blocks described above. Tissue sampling was undertaken in triplicate to provide representative data on the parent block50; synthetic controls and cell pellets were sampled in duplicate. Sections, 3 μm thick, were cut from the recipient blocks and mounted on to glass slides. H&E staining for verification of the histology (KJH) was performed on the first section cut from each TMA block.
Immunohistochemistry
Tissue sections were dewaxed and heat mediated antigen retrieval was performed in target retrieval solution (Dako Cytomation, Carpinteria, California, USA). Immunohistochemistry (IHC) was carried out as described previously,51 using a primary antihuman HIF-1α monoclonal antibody at 1 μg/ml, (clone H1α67; Novus Biologicals, Littleton, Colorado, USA). Negative control slides were incubated with a mouse IgG2b immunoglobulin culture supernatant (Dako Cytomation) at 1 μg/ml. Cases were assigned as positive for HIF-1α if one or more of the three cores contained neoplastic cells with positively staining nuclei (KJH).
In situ hybridisation
For each riboprobe to be synthesised, 12 μl (125 mCi) of [α33P]-UTP (Amersham Biosciences, Piscataway, New Jersey, USA) was speed vacuumed until dry. Each aliquot was reconstituted in 1× buffer, 4.5mM dithiothreitol, 0.23mM rNTPs (0.08mM each rATP, rCTP, rGTP), 2.3μM rUTP, 1.4 U/μl RNAse inhibitor, 0.05 μg/μl cDNA template, and 0.7 U/μl of either T7 (sense probe) or T3 (antisense probe) RNA polymerase (Promega, Madison, Wisconsin, USA). In vitro transcription took place over one hour at 37°C. Samples were then treated with 0.05 U/μl DNase (Promega) for 15 minutes at 37°C and purified over RNeasy mini columns (Qiagen, Valencia, California, USA). Formalin fixed, paraffin wax embedded tissue sections were dewaxed and treated with proteinase K (20 μg/ml in 2× SSC) at 37°C for 15 minutes. Hybridisation and washes were carried out as described previously.48,52,53
Tissue sections were dehydrated, air dried, and exposed to a phosphorscreen for 16 hours at room temperature. Immediately after incubation, the phosphorscreen was scanned with a Typhoon 9410 (Amersham Biosciences, Piscataway, New Jersey, USA). Slides were then dipped in NBT2 nuclear track emulsion (Eastman Kodak, Rochester, New York, USA), exposed for four weeks at 4°C, developed, and counterstained with H&E. Background subtraction, gridding, and analysis of the phosphorimages were undertaken with Phoretix Array v.3 (Nonlinear Dynamics, Newcastle upon Tyne, UK). Subsequently, the TMAs were reviewed (KJH) by bright/dark field microscopy for verification of hybridisation. Cores were scored semiquantitatively on a scale of 0 (no expression) to 3 (very strong signal), according to the overall intensity of the hybridisation signal.
Statistical analysis
Statistical analysis was performed using SPSS for Windows (version 11.0; Chicago, Illinois, USA). The Mann-Whitney U test was used to assess the differences between the median values of continuous datasets. Large datasets were subjected to false discovery rate controlling procedures as indicated.54 Significance was assumed if the two sided p value was < 0.05 and the false discovery rate controlling procedure did not discount the finding.
RESULTS
DNA microarray data
VEGF-A expression
When compared with normal tissue, median VEGF-A expression was significantly greater in primary malignancies of the breast (1.4 fold), cervix (1.4 fold), colon and rectum (2.2 fold), oesophagus (2.0 fold), head and neck (1.6 fold), kidney (3.2 fold), ovary (3.5 fold), skin (1.6 fold), urinary system (3.1 fold), and white blood cells (7.8 fold; including acute lymphocytic leukaemia and chronic myeloid leukaemia spleen samples) (fig 1; table 1). Malignancies of the kidney showed the greatest range and maximum expression of VEGF-A (fig 1). VEGF-A was further upregulated in metastatic colorectal tumours when compared with primary malignancies with no evidence of metastasis (table 1). This association was not seen in other tumour types. In contrast, significant reductions of VEGF-A, relative to normal tissue, were noted in primary malignancies of the lymphoid system (median 0.24 of normal), prostate (0.65 of normal), stomach (0.77 of normal), testis (0.29 of normal), and thyroid (0.44 of normal) (fig 1; table 1).
Figure 1.
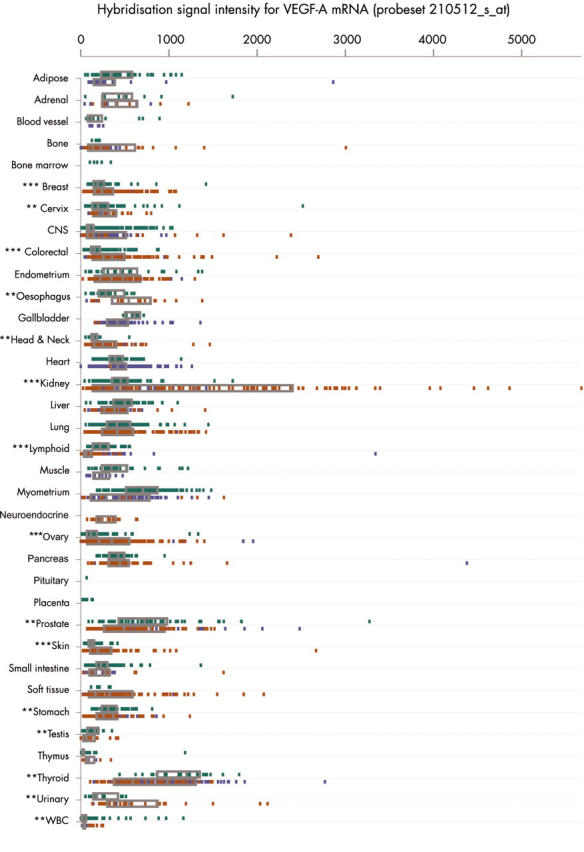
Electronic northern plot of the relative degrees of vascular endothelial growth factor A (VEGF-A) mRNA expression in different tissues and pathological states, determined by DNA microarray analysis (probeset 210512_s_at). The box represents the interquartile range, divided by a median line. Green, normal tissue; red, malignant tissue; blue, non-malignant disease. The Mann-Whitney U test was used to assess the differences between the median values of normal and primary malignant tissue: *p < 0.05; **p < 0.01; ***p < 0.0001. CNS, central nervous system; WBC, white blood cells.
Table 1.
Relative degree of vascular endothelial growth factor A mRNA expression determined by DNA microarray analysis (probe 210512_s_at) in different tissues and pathological states
| Tissue | Diagnosis | N | Median | Interquartile range | Mann-Whitney U | |
| p v normal | p v metastatic | |||||
| Adipose | Normal | 37 | 366 | 259–591 | ||
| Lipomas and lipomatosis | 7 | 189 | 116–969 | 0.377 | ||
| Adrenal | Normal | 10 | 499 | 249–616 | ||
| 1° malignancy, no metastasis* | 10 | 337 | 242–576 | 0.257 | ||
| Benign tumours | 4 | 374 | 59–755 | 0.671 | ||
| Blood vessels | Normal | 11 | 113 | 74–281 | ||
| Bone | Normal | 2 | 157 | 125–189 | ||
| 1° malignancy, no metastasis* | 25 | 191 | 121–632 | 0.517 | 0.767 | |
| Metastatic disease | 7 | 225 | 118–820 | 0.380 | ||
| Benign tumours | 5 | 85 | 65–122 | 0.190 | ||
| Bone marrow | Normal | 5 | 185 | 126–289 | ||
| Breast | Normal | 33 | 166 | 129–211 | ||
| 1° malignancy, no metastasis* | 276 | 240 | 160–362 | 0.0001 | 0.197 | |
| Metastatic disease | 21 | 187 | 96–412 | 0.495 | ||
| Fibroadenomas | 9 | 177 | 159–243 | 0.450 | ||
| Cystosarcoma phyllodes | 3 | 341 | 0.041† | |||
| Cell lines | Normal | 99 | 81 | 44–156 | ||
| Untreated malignant | 110 | 108 | 62–263 | 0.001 | ||
| Cervix | Normal | 66 | 217 | 163–280 | ||
| 1° malignancy, no metastasis* | 20 | 294 | 182–451 | 0.011 | 0.699 | |
| Metastatic disease | 4 | 322 | 219–437 | 0.105 | ||
| Central nervous system | Normal | 160 | 111 | 78–157 | ||
| 1° malignancy, no metastasis* | 21 | 113 | 58–607 | 0.651 | 0.386 | |
| Meningiomas | 10 | 48 | 27–135 | 0.009 | ||
| Colorectal | Normal | 222 | 150 | 112–203 | ||
| 1° malignancy, no metastasis* | 158 | 331 | 238–466 | <0.0001 | 0.001 | |
| Metastatic disease | 34 | 479 | 291–725 | <0.0001 | ||
| Benign tumours | 19 | 255 | 202–358 | 0.0003 | ||
| Endometrium | Normal | 7 | 452 | 238–563 | ||
| 1° malignancy, no metastasis* | 96 | 330 | 212–507 | 0.455 | ||
| Metastatic disease | 12 | 396 | 246–476 | 0.735 | ||
| Gallbladder | Normal | 8 | 607 | 506–666 | ||
| Head and neck | Normal | 14 | 140 | 110–179 | ||
| 1° malignancy, no metastasis* | 30 | 228 | 145–308 | 0.002 | 0.326 | |
| Metastatic disease | 22 | 316 | 153–421 | 0.003 | ||
| Benign tumours | 21 | 244 | 140–384 | 0.005 | ||
| Heart | Normal | 15 | 345 | 305–456 | ||
| Kidney | Normal | 76 | 462 | 382–532 | ||
| 1° malignancy, no metastasis* | 85 | 1461 | 383–2435 | <0.0001 | 0.936 | |
| Metastatic disease | 6 | 1407 | 166–2985 | 0.170 | ||
| Oncocytomas | 8 | 778 | 492–1017 | 0.01 | ||
| Other benign tumours | 4 | 162 | 111–230 | <0.0001 | ||
| Liver | Normal | 43 | 533 | 390–583 | ||
| 1° malignancy, no metastasis* | 18 | 435 | 315–617 | 0.282 | 0.130 | |
| Metastatic disease | 7 | 341 | 126–478 | 0.020† | ||
| Lung | Normal | 100 | 438 | 354–567 | ||
| 1° malignancy, no metastasis* | 123 | 390 | 223–591 | 0.101 | 0.820 | |
| Metastatic disease | 5 | 348 | 107–894 | 0.588 | ||
| Lymphoid | Normal | 44 | 230 | 162–309 | ||
| 1° malignancy, no metastasis* | 78 | 55 | 29–100 | <0.0001 | 0.024† | |
| Metastatic disease | 3 | 225 | 89–432 | 0.828 | ||
| Muscle (skeletal) | Normal | 31 | 389 | 280–587 | ||
| Myometrium | Normal | 140 | 718 | 531–888 | ||
| 1° malignancy, no metastasis* | 2 | 1201 | 779–1623 | 0.156 | 0.079 | |
| Metastatic disease | 7 | 246 | 100–561 | 0.009 | ||
| Leiomyoma | 50 | 485 | 289–712 | <0.0001 | ||
| Neuroendocrine | 1° malignancy, no metastasis* | 14 | 236 | 158–374 | 0.166 | |
| Metastatic disease | 3 | 373 | 332–393 | |||
| Oesophagus | Normal | 18 | 271 | 181–493 | ||
| 1° malignancy, no metastasis* | 17 | 544 | 388–843 | 0.006 | 0.923 | |
| Ovary | Normal | 117 | 95 | 62–166 | ||
| 1° malignant disease | 94 | 329 | 202–523 | <0.0001 | 0.764 | |
| Metastatic disease | 61 | 356 | 185–532 | <0.0001 | ||
| Benign tumours | 48 | 136 | 69–201 | 0.089 | ||
| Pancreas | Normal | 34 | 446 | 319–512 | ||
| 1° malignancy, no metastasis* | 52 | 428 | 320–517 | 0.818 | 0.768 | |
| Metastatic disease | 20 | 430 | 363–510 | 0.962 | ||
| Adenomas | 5 | 428 | 264–2812 | 0.669 | ||
| Placenta | Normal | 4 | 62 | 42–69 | ||
| Prostate | Normal | 34 | 795 | 469–1083 | ||
| 1° malignancy, no metastasis* | 65 | 520 | 267–803 | 0.004 | 0.665 | |
| Metastatic disease | 3 | 668 | 300–922 | 0.404 | ||
| Benign prostatic hypertrophy | 31 | 464 | 267–618 | 0.003 | ||
| Prostatic intraepithelial neoplasia | 4 | 1374 | 749–1574 | 0.092 | ||
| Skin | Normal | 55 | 120 | 87–140 | ||
| 1° malignant disease | 38 | 191 | 108–331 | <0.0001 | 0.645 | |
| Metastatic disease | 22 | 166 | 87–355 | 0.025† | ||
| Small intestine | Normal | 129 | 230 | 181–301 | ||
| 1° malignancy, no metastasis* | 6 | 196 | 105–281 | 0.245 | 0.134 | |
| Inflammatory bowel disease | 4 | 97 | 77–251 | 0.041† | ||
| Adenomatous polyps | 6 | 202 | 145–278 | 0.417 | ||
| Soft tissue | 1° malignancy, no metastasis* | 58 | 300 | 156–596 | 0.275 | |
| Metastatic disease | 15 | 464 | 216–764 | |||
| Benign tumours | 39 | 149 | 91–242 | |||
| Stomach | Normal | 23 | 374 | 284–465 | ||
| 1° malignancy, no metastasis* | 57 | 288 | 215–366 | 0.009 | 0.141 | |
| Metastatic disease | 13 | 193 | 112–373 | 0.012 | ||
| Testis | Normal | 15 | 177 | 94–199 | ||
| 1° malignancy, no metastasis* | 18 | 52 | 22–161 | 0.010 | 0.465 | |
| Thymus | Normal | 65 | 25 | 19–34 | ||
| 1° malignancy, no metastasis* | 3 | 28 | 21–341 | 0.395 | ||
| Thyroid | Normal | 11 | 1212 | 567–1388 | ||
| 1° malignant disease | 26 | 534 | 293–973 | 0.003 | 0.242 | |
| Metastatic disease | 9 | 464 | 226–601 | 0.001 | ||
| Nodular hyperplasia | 15 | 668 | 592–914 | 0.002 | ||
| Benign tumours | 8 | 1448 | 867–1388 | 0.206 | ||
| Urinary | Normal | 7 | 170 | 115–421 | ||
| 1° malignancy, no metastasis* | 24 | 531 | 281–868 | 0.005 | 0.817 | |
| Metastatic disease | 3 | 579 | 131–2033 | 0.210 | ||
| White blood cells | Normal | 79 | 21 | 9–45 | ||
| 1° malignancy, no metastasis* | 6 | 164 | 117–240 | 0.001 | ||
*Primary malignant disease with no evidence of distant metastasis; †These p values are not considered significant by the false discovery rate controlling procedure,54 with a desired false discovery rate <0.05.
VEGF-A v CA9 expression
The degree of CA9 expression showed a linear correlation with that of VEGF-A only in renal tissue (R2 = 0.54; fig 2A). The correlation was strongest in neoplastic tissues (R2 = 0.38), with a weaker association in normal kidney (R2 = 0.26), and no correlation in non-malignant disease (R2 = 0.01). Correlations were not apparent in breast, colorectal, lung, ovary, pancreas, prostate, thyroid, or urinary tissues (fig 2B).
Figure 2.

Scatter plots comparing the expression of vascular endothelial growth factor A (VEGF-A) and carbonic anhydrase IX (CA9) mRNA, assessed by DNA microarray in (A) kidney tissues and (B) breast, colorectal, lung, ovary, pancreas, prostate, thyroid, and urinary tissues.
Tissue microarray data
VEGF-A expression
To corroborate the Gene Logic data on tissue homogenates, we undertook an investigation of VEGF-A expression by in situ hybridisation (ISH) on a series of human tumour samples. VEGF-A expression was seen in the stromal and/or neoplastic cell populations of positive (score 1–3) TMA cores covering a range of malignancies (fig 3). The ISH score given by the pathologist correlated closely with the quantitative signal obtained by phosphorimaging, which has been used for the remainder of the analysis (fig 4). The VEGF-A antisense control recorded a positive signal by phosphorimaging, when compared with the VEGF-A sense and blank agarose negative controls (fig 5). Of the cell pellets, the VEGF-A transfected CHO cells showed the highest quantitative signal intensity, with lower signals in 786-0, A673, SKMES, SW480, and KM12 cells (fig 5). The remaining cell lines expressed little or no VEGF-A.
Figure 3.
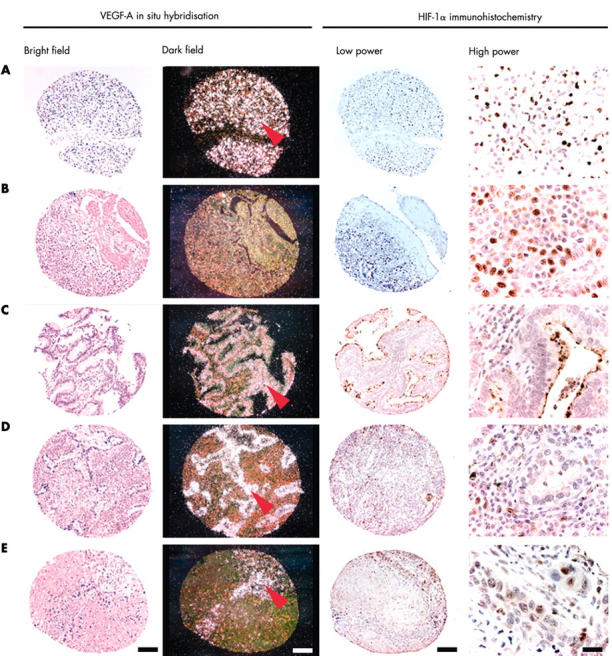
Tissue microarray cores illustrating vascular endothelial growth factor A (VEGF-A) in situ hybridisation (ISH) and hypoxia inducible factor 1α (HIF-1α) immunohistochemistry. Brightfield and darkfield images of VEGF-A ISH demonstrate silver grains overlying neoplastic cells (red arrows). (A) Renal adenocarcinoma; (B and E) lung squamous cell carcinoma; (C and D) lung adenocarcinoma. Bars: 100 μm except for high power images (20 μm). Low power and high power images of HIF-1α immunohistochemistry show nuclear localisation of the diaminobenzidine chromagen in stromal (D) and neoplastic (A, B, and E) cell populations. VEGF-A expression can be seen in both HIF-1α positive (A, B, and E) and negative (C and D) tissue cores.
Figure 4.

Box plots showing the distribution of quantitative data obtained by phosphorscreen imaging of vascular endothelial growth factor A (VEGF-A) in situ hybridisation studies, classified according to the histopathologist’s score. The box represents the interquartile range, divided by a median line. Whisker lines delineate the number of cases that lie within 1.5 box lengths from the upper or lower extremes of the interquartile range. Empty circles represent outliers found within 1.5 and 3 box lengths from the upper or lower extremes of the interquartile range. Solid circles mark extreme values outside of this range.
Figure 5.

Quantitative vascular endothelial growth factor A (VEGF-A) mRNA expression assessed by in situ hybridisation phosphorimage analysis in a series of cell pellets and synthetic controls. VEGF-A-S, VEGF-A sense; VEGF-A-AS, VEGF-A antisense.
VEGF-A v HIF-1α expression
Of 1025 tumour cores, 316 (31%) scored positive for HIF-1α expression in the nuclei of the stromal and/or neoplastic cell populations. All nine cores of renal cell carcinoma and follicular adenocarcinoma of the thyroid were positive, compared with only 5% of breast ductal adenocarcinomas, 4% of mucinous ovarian adenocarcinomas, 6% of gastrointestinal stromal tumours, and no adenocarcinomas of the endometrium or neuroendocrine tumours of the lung (table 2). HIF-1α positive cores showed significantly higher VEGF-A expression than did HIF-1α negative cores in adenocarcinomas of the lung (1.6 fold), serous adenocarcinomas of the ovary (4.5 fold), liposarcomas (20.5 fold), rhabdomyosarcomas (4.8 fold), and medullary carcinomas of the thyroid (1.7 fold) (table 2).
Table 2.
Relative VEGF-A mRNA expression determined by quantitative in situ hybridisation in different tumour types
| Tissue | Tumour type | VEGF-A phosphorimage volume (relative units) | U test | |||||
| HIF-1α positive | HIF-1α negative | |||||||
| N* | Median | IQR | N* | Median | IQR | |||
| Adrenal | Carcinoma | 3 (1) | 26832 | 25861–27526 | 6 (2) | 40350 | 21383–62429 | 0.4386 |
| Breast | Ductal adenocarcinoma | 9 (7) | 6982 | 3448–8322 | 165 (78) | 6492 | 2759–10674 | 0.8651 |
| Endometrium | Adenocarcinoma | 0 | 6 (2) | 18942 | 5773–42790 | |||
| Kidney | Adenocarcinoma | 9 (3) | 194897 | 169937–263585 | 0 | |||
| Liver | Hepatocellular carcinoma | 2 (1) | 37978 | 22612–53344 | 6 (2) | 12847 | 8069–19191 | 0.0956 |
| Lung | Adenocarcinoma | 71 (30) | 40213 | 21246–67767 | 44 (21) | 24625 | 13594–53635 | 0.0394† |
| Neuroendocrine tumour | 0 | 15 (5) | 26564 | 20574–41287 | ||||
| Squamous cell carcinoma | 35 (17) | 41311 | 29085–72728 | 41 (18) | 40082 | 18356–76064 | 0.3842 | |
| Ovary | Adenocarcinoma | 3 (1) | 19842 | 17747–46596 | 3 (1) | 40991 | 29618–42359 | 0.5127 |
| Adenocarcinoma: endometrioid | 25 (14) | 20039 | 14073–40037 | 31 (15) | 16686 | 10488–39839 | 0.4633 | |
| Adenocarcinoma: serous | 18 (10) | 128343 | 38207–185213 | 55 (22) | 28502 | 19224–61354 | 0.0038 | |
| Adenocarcinoma: mucinous | 1 (1) | 5256 | 24 (12) | 4286 | 1785–6829 | 0.7815 | ||
| Adenocarcinoma: clear cell | 6 (3) | 117882 | 109480–136541 | 27 (10) | 35733 | 19849–107339 | 0.0842 | |
| Pancreas | Adenocarcinoma | 6 (3) | 18282 | 11131–33890 | 5 (2) | 35693 | 23563–44115 | 0.1003 |
| Soft tissue | Angiosarcoma | 4 (2) | 1490 | 743–10969 | 20 (7) | 504 | 269–2223 | 0.1879 |
| Fibrosarcoma | 0 | 11 (4) | 2394 | 1275–5204 | ||||
| Gastrointestinal stromal tumour | 1 (1) | 10779 | 16 (6) | 3678 | 1091–16290 | 0.4142 | ||
| Leiomyosarcoma | 4 (2) | 12920 | 2420–34709 | 14 (5) | 12097 | 10030–44381 | 0.3956 | |
| Liposarcoma | 3 (1) | 18772 | 12333–24699 | 25 (9) | 915 | 116–3224 | 0.0067 | |
| Malignant fibrous histiocytoma | 11 (5) | 9165 | 2893–12657 | 32 (13) | 6527 | 3195–11739 | 0.6361 | |
| Rhabdomyoscarcoma | 7 (3) | 13459 | 7475–73528 | 39 (15) | 2792 | 1423–5678 | 0.0011 | |
| Synovial sarcoma | 4 (2) | 13932 | 8009–35790 | 29 (11) | 4600 | 3096–8918 | 0.1856 | |
| Thyroid | Carcinoma | 38 (15) | 30073 | 22677–46610 | 72 (26) | 37024 | 21798–57202 | 0.2659 |
| Carcinoma: anaplastic | 3 (3) | 13371 | 13196–33180 | 3 (4) | 9073 | 5359–27547 | 0.3092 | |
| Carcinoma: medullary | 9 (3) | 29941 | 26268–143511 | 26 (9) | 17788 | 12459–45316 | 0.0326† | |
| Carcinoma: poorly differentiated | 11 (4) | 17925 | 15558–45240 | 11 (4) | 42054 | 26370–52769 | 0.1396 | |
| Adenocarcinoma: follicular | 9 (3) | 83909 | 52089–98721 | 0 | ||||
*N, number of cores with number of cases in parentheses; †These p values are not considered significant by the false discovery rate controlling procedure,54 with a desired false discovery rate <0.05.
HIF-1α, hypoxia inducible factor 1α; IQR, interquartile range; VEGF-A, vascular endothelial growth factor A.
DISCUSSION
The measurement of VEGF-A expression in tumours has become an important methodological issue in determining prognosis,28–40 and may affect the sensitivity of individual tumours to targeted antibody and small molecule treatments. At present, there is a large body of literature describing the changes in VEGF-A expression during tumorigenesis, using many different techniques, such as ISH,48,55 IHC,30,37,40,56,57 enzyme immunoassay,58 reverse transcription-PCR,36,40 and western blotting.40 However, none of the techniques used to measure VEGF-A expression has been widely applied,59 and there is no accepted gold standard. This limits the external validity of studies and prohibits reliable interlaboratory comparisons. In addressing this concern, we used both DNA microarray and TMA technology to investigate the expression of VEGF-A in a large series of diverse human tumours. Furthermore, the data yielded information on the proportion of tumours in which the upregulation of VEGF-A expression is associated with markers of hypoxia.
A key aim of our study was to appraise the prevalence and degree of VEGF-A upregulation in a large series of diverse tumour types. DNA microarray analysis demonstrated a significant increase in median VEGF-A expression in many prevalent types of malignancy (fig 1; table 1). The data fall within the range of VEGF-A expression reported for these tumour types in the literature.28–40,48 In addition, there is a significant increase in VEGF-A expression in colorectal adenomas compared with normal colorectal tissue, which has been reported previously by our group48 and by independent investigators.60 However, not all tumours upregulate VEGF-A expression at the mRNA level. For example, DNA microarray analysis demonstrated a significant downregulation of VEGF-A expression in benign prostatic hypertrophy and primary malignancies of the lymphoid system, prostate, stomach, testis, and thyroid. Furthermore, the Gene Logic series of metastatic breast cancers did not show a significant increase in VEGF-A expression when compared with primary malignancies or normal breast. These observations are not supported by the literature,61–68 which may be a reflection of publication bias towards positive findings, demographic differences, or experimental idiosyncrasies. Limitations of the Gene Logic data include low sample numbers for certain tumour types. Moreover, many samples of normal tissue were obtained from tumour resection margins, which may be under the influence of paracrine and hormonal factors secreted by the tumour. For example, in testicular cancer this adjacent tissue frequently shows other histopathological changes. Nevertheless, analyses on subsets of normal tissue of the colon, ovary, breast, lung, and cervix showed no significant differences in VEGF-A expression between tissue from patients with or without cancer (data not shown). This paper also focuses on the expression of VEGF-A mRNA, in contrast to the published literature, which has relied more heavily on immunohistochemistry.61–66 Although mRNA transcript abundance is not always a true reflection of changes in protein expression, the interpretation of immunohistochemistry is complicated by the specificity and sensitivity of the antibody used. In addition, it is possible that tumours in which VEGF-A is not upregulated trigger the angiogenic switch by either downregulating antiangiogenic factors or upregulating other proangiogenic factors, circumventing their requirement for VEGF-A. For example, angiopoietin-2, a proangiogenic ligand, is upregulated in thyroid cancers and thrombospondin-1, an antiangiogenic extracellular matrix component, is downregulated.61
Take home messages.
Vascular endothelial growth factor A (VEGF-A) expression is upregulated in a large number of human malignancies, and may be associated with markers of hypoxia
VEGF-A expression can be induced in the absence of hypoxia and hypoxia does not always provoke VEGF-A upregulation in tumours
“DNA microarray analysis demonstrated a significant downregulation of vascular endothelial growth factor A expression in benign prostatic hypertrophy and primary malignancies of the lymphoid system, prostate, stomach, testis, and thyroid”
In the canonical model outlined above, the expression of VEGF-A is a result of increased transcriptional activity in response to HIF-1α activation under hypoxic conditions.6 However, the data presented here indicate that a large proportion of malignancies exhibit VEGF-A upregulation in the absence of these markers of hypoxia. Although the canonical model holds true in some tumours, it seems short sighted to view it as the only means of VEGF-A upregulation in human cancer. In adenocarcinomas of the kidney, the relatively strong association of HIF-1α and CA9 with VEGF-A may result from reduced HIF-1α turnover as a result of mutations or promoter methylation of the VHL gene, reported in 56% of sporadic clear cell carcinomas.66 A similar association between HIF-1α and VEGF-A expression was seen for lung tumours, serous adenocarcinomas of the ovary, liposarcomas, rhabdomyosarcomas, and medullary carcinomas of the thyroid. However, the last three tumour types were not well represented in our study and our findings need to be confirmed in a larger series. Furthermore, we suggest that many tumours may exploit hypoxia independent mechanisms to increase their expression of VEGF-A, which is also regulated by certain growth factors and/or hormones known to be manipulated during tumorigenesis.25–27
In summary, the data presented here represent the largest single series of human tissues and pathologies profiled for VEGF-A expression in a uniform and quantitative manner. The findings may prove useful in establishing a reference for VEGF-A expression in malignant disease.
Acknowledgments
We gratefully acknowledge the assistance of P Tobin, B Wright (Department of Pathology, Genentech Inc), K Jung (Department of Bioinformatics, Genentech Inc), and M Ostland (Department of Biostatistics, Genentech Inc).
Abbreviations
CA9, carbonic anhydrase IX
CHO, Chinese hamster ovary
H&E, haematoxylin and eosin
HIF-1α, hypoxia inducible factor 1α
IHC, immunohistochemistry
ISH, in situ hybridisation
PCR, polymerase chain reaction
TMA, tissue microarray
VEGF-A, vascular endothelial growth factor A
VHL, von Hippel-Lindau
REFERENCES
- 1.Folkman J. What is the evidence that tumors are angiogenesis dependent? J Natl Cancer Inst 1990;82:4–6. [DOI] [PubMed] [Google Scholar]
- 2.Gimbrone MA Jr, Cotran RS, Leapman SB, et al. Tumor growth and neovascularization: an experimental model using the rabbit cornea. J Natl Cancer Inst 1974;52:413–27. [DOI] [PubMed] [Google Scholar]
- 3.Folkman J, Cole P, Zimmerman S. Tumor behavior in isolated perfused organs: in vitro growth and metastases of biopsy material in rabbit thyroid and canine intestinal segment. Ann Surg 1966;164:491–502. [DOI] [PMC free article] [PubMed] [Google Scholar]
- 4.Risau W. Mechanisms of angiogenesis. Nature 1997;386:671–4. [DOI] [PubMed] [Google Scholar]
- 5.Vaupel P, Kallinowski F, Okunieff P. Blood flow, oxygen and nutrient supply, and metabolic microenvironment of human tumors: a review. Cancer Res 1989;49:6449–65. [PubMed] [Google Scholar]
- 6.Semenza GL. HIF-1 and tumor progression: pathophysiology and therapeutics. Trends Mol Med 2002;8(suppl 4):S62–7. [DOI] [PubMed] [Google Scholar]
- 7.Wang GL, Jiang BH, Rue EA, et al. Hypoxia-inducible factor 1 is a basic helix–loop–helix–PAS heterodimer regulated by cellular O2 tension. Proc Natl Acad Sci U S A 1995;92:5510–14. [DOI] [PMC free article] [PubMed] [Google Scholar]
- 8.Ivan M, Kondo K, Yang H, et al. HIFalpha targeted for VHL-mediated destruction by proline hydroxylation: implications for O2 sensing. Science 2001;292:464–8. [DOI] [PubMed] [Google Scholar]
- 9.Jaakkola P, Mole DR, Tian YM, et al. Targeting of HIF-alpha to the von Hippel-Lindau ubiquitylation complex by O2-regulated prolyl hydroxylation. Science 2001;292:468–72. [DOI] [PubMed] [Google Scholar]
- 10.Epstein AC, Gleadle JM, McNeill LA, et al. C. elegans EGL-9 and mammalian homologs define a family of dioxygenases that regulate HIF by prolyl hydroxylation. Cell 2001;107:43–54. [DOI] [PubMed] [Google Scholar]
- 11.Sutter CH, Laughner E, Semenza GL. Hypoxia-inducible factor 1alpha protein expression is controlled by oxygen-regulated ubiquitination that is disrupted by deletions and missense mutations. Proc Natl Acad Sci U S A 2000;97:4748–53. [DOI] [PMC free article] [PubMed] [Google Scholar]
- 12.Iyer NV, Kotch LE, Agani F, et al. Cellular and developmental control of O2 homeostasis by hypoxia-inducible factor 1 alpha. Genes Dev 1998;12:149–62. [DOI] [PMC free article] [PubMed] [Google Scholar]
- 13.Ryan HE, Lo J, Johnson RS. HIF-1 alpha is required for solid tumor formation and embryonic vascularization. EMBO J 1998;17:3005–15. [DOI] [PMC free article] [PubMed] [Google Scholar]
- 14.Carmeliet P, Dor Y, Herbert JM, et al. Role of HIF-1alpha in hypoxia-mediated apoptosis, cell proliferation and tumour angiogenesis. Nature 1998;394:485–90. [DOI] [PubMed] [Google Scholar]
- 15.Jiang BH, Rue E, Wang GL, et al. Dimerization, DNA binding, and transactivation properties of hypoxia-inducible factor 1. J Biol Chem 1996;271:17771–8. [DOI] [PubMed] [Google Scholar]
- 16.Gerber HP, Condorelli F, Park J, et al. Differential transcriptional regulation of the two vascular endothelial growth factor receptor genes. Flt-1, but not Flk-1/KDR, is up-regulated by hypoxia. J Biol Chem 1997;272:23659–67. [DOI] [PubMed] [Google Scholar]
- 17.Levy AP, Levy NS, Wegner S, et al. Transcriptional regulation of the rat vascular endothelial growth factor gene by hypoxia. J Biol Chem 1995;270:13333–40. [DOI] [PubMed] [Google Scholar]
- 18.Liu Y, Cox SR, Morita T, et al. Hypoxia regulates vascular endothelial growth factor gene expression in endothelial cells. Identification of a 5′ enhancer. Circ Res 1995;77:638–43. [DOI] [PubMed] [Google Scholar]
- 19.Madan A, Curtin PT. A 24-base-pair sequence 3′ to the human erythropoietin gene contains a hypoxia-responsive transcriptional enhancer. Proc Natl Acad Sci U S A 1993;90:3928–32. [DOI] [PMC free article] [PubMed] [Google Scholar]
- 20.Wykoff CC, Beasley NJ, Watson PH, et al. Hypoxia-inducible expression of tumor-associated carbonic anhydrases. Cancer Res 2000;60:7075–83. [PubMed] [Google Scholar]
- 21.Neufeld G, Cohen T, Gengrinovitch S, et al. Vascular endothelial growth factor (VEGF) and its receptors. FASEB J 1999;13:9–22. [PubMed] [Google Scholar]
- 22.Frank S, Hubner G, Breier G, et al. Regulation of vascular endothelial growth factor expression in cultured keratinocytes. Implications for normal and impaired wound healing. J Biol Chem 1995;270:12607–13. [DOI] [PubMed] [Google Scholar]
- 23.Ferrara N, Davis-Smyth T. The biology of vascular endothelial growth factor. Endocr Rev 1997;18:4–25. [DOI] [PubMed] [Google Scholar]
- 24.Warren RS, Yuan H, Matli MR, et al. Induction of vascular endothelial growth factor by insulin-like growth factor 1 in colorectal carcinoma. J Biol Chem 1996;271:29483–8. [DOI] [PubMed] [Google Scholar]
- 25.Soh EY, Sobhi SA, Wong MG, et al. Thyroid-stimulating hormone promotes the secretion of vascular endothelial growth factor in thyroid cancer cell lines. Surgery 1996;120:944–7. [DOI] [PubMed] [Google Scholar]
- 26.Shifren JL, Mesiano S, Taylor RN, et al. Corticotropin regulates vascular endothelial growth factor expression in human fetal adrenal cortical cells. J Clin Endocrinol Metab 1998;83:1342–7. [DOI] [PubMed] [Google Scholar]
- 27.Pupilli C, Lasagni L, Romagnani P, et al. Angiotensin II stimulates the synthesis and secretion of vascular permeability factor/vascular endothelial growth factor in human mesangial cells. J Am Soc Nephrol 1999;10:245–55. [DOI] [PubMed] [Google Scholar]
- 28.Gasparini G, Toi M, Gion M, et al. Prognostic significance of vascular endothelial growth factor protein in node-negative breast carcinoma. J Natl Cancer Inst 1997;89:139–47. [DOI] [PubMed] [Google Scholar]
- 29.Manders P, Beex LV, Tjan-Heijnen VC, et al. The prognostic value of vascular endothelial growth factor in 574 node-negative breast cancer patients who did not receive adjuvant systemic therapy. Br J Cancer 2002;87:772–8. [DOI] [PMC free article] [PubMed] [Google Scholar]
- 30.De Paola F, Granato AM, Scarpi E, et al. Vascular endothelial growth factor and prognosis in patients with node-negative breast cancer. Int J Cancer 2002;98:228–33. [DOI] [PubMed] [Google Scholar]
- 31.Ellis LM, Takahashi Y, Liu W, et al. Vascular endothelial growth factor in human colon cancer: biology and therapeutic implications. Oncologist 2000;5(suppl 1):11–15. [DOI] [PubMed] [Google Scholar]
- 32.Kang SM, Maeda K, Onoda N, et al. Combined analysis of p53 and vascular endothelial growth factor expression in colorectal carcinoma for determination of tumor vascularity and liver metastasis. Int J Cancer 1997;74:502–7. [DOI] [PubMed] [Google Scholar]
- 33.Lee JC, Chow NH, Wang ST, et al. Prognostic value of vascular endothelial growth factor expression in colorectal cancer patients. Eur J Cancer 2000;36:748–53. [DOI] [PubMed] [Google Scholar]
- 34.Cascinu S, Staccioli MP, Gasparini G, et al. Expression of vascular endothelial growth factor can predict event-free survival in stage II colon cancer. Clin Cancer Res 2000;6:2803–7. [PubMed] [Google Scholar]
- 35.Cascinu S, Graziano F, Valentini M, et al. Vascular endothelial growth factor expression, S-phase fraction and thymidylate synthase quantitation in node-positive colon cancer: relationships with tumor recurrence and resistance to adjuvant chemotherapy. Ann Oncol 2001;12:239–44. [DOI] [PubMed] [Google Scholar]
- 36.Shen GH, Ghazizadeh M, Kawanami O, et al. Prognostic significance of vascular endothelial growth factor expression in human ovarian carcinoma. Br J Cancer 2000;83:196–203. [DOI] [PMC free article] [PubMed] [Google Scholar]
- 37.Ogawa S, Kaku T, Kobayashi H, et al. Prognostic significance of microvessel density, vascular cuffing and vascular endothelial growth factor expression in ovarian carcinoma: a special review for clear cell adenocarcinoma. Cancer Lett 2002;176:111–18. [DOI] [PubMed] [Google Scholar]
- 38.O’Byrne KJ, Dobbs N, Propper D, et al. Vascular endothelial growth factor platelet counts, and prognosis in renal cancer. Lancet 1999;353:1494–5. [DOI] [PubMed] [Google Scholar]
- 39.Cheng WF, Chen CA, Lee CN, et al. Vascular endothelial growth factor and prognosis of cervical carcinoma. Obstet Gynecol 2000;96(5 Pt 1):721–6. [DOI] [PubMed] [Google Scholar]
- 40.Mineta H, Miura K, Ogino T, et al. Prognostic value of vascular endothelial growth factor (VEGF) in head and neck squamous cell carcinomas. Br J Cancer 2000;83:775–81. [DOI] [PMC free article] [PubMed] [Google Scholar]
- 41.Zhong H, De Marzo AM, Laughner E, et al. Overexpression of hypoxia-inducible factor 1alpha in common human cancers and their metastases. Cancer Res 1999;59:5830–5. [PubMed] [Google Scholar]
- 42.Talks KL, Turley H, Gatter KC, et al. The expression and distribution of the hypoxia-inducible factors HIF-1alpha and HIF-2alpha in normal human tissues, cancers, and tumor-associated macrophages. Am J Pathol 2000;157:411–21. [DOI] [PMC free article] [PubMed] [Google Scholar]
- 43.Chia SK, Wykoff CC, Watson PH, et al. Prognostic significance of a novel hypoxia-regulated marker, carbonic anhydrase IX, in invasive breast carcinoma. J Clin Oncol 2001;19:3660–8. [DOI] [PubMed] [Google Scholar]
- 44.Hui EP, Chan AT, Pezzella F, et al. Coexpression of hypoxia-inducible factors 1alpha and 2alpha, carbonic anhydrase IX, and vascular endothelial growth factor in nasopharyngeal carcinoma and relationship to survival. Clin Cancer Res 2002;8:2595–604. [PubMed] [Google Scholar]
- 45.Loncaster JA, Harris AL, Davidson SE, et al. Carbonic anhydrase (CA IX) expression, a potential new intrinsic marker of hypoxia: correlations with tumor oxygen measurements and prognosis in locally advanced carcinoma of the cervix. Cancer Res 2001;61:6394–9. [PubMed] [Google Scholar]
- 46.Giatromanolaki A, Koukourakis MI, Sivridis E, et al. Expression of hypoxia-inducible carbonic anhydrase-9 relates to angiogenic pathways and independently to poor outcome in non-small cell lung cancer. Cancer Res 2001;61:7992–8. [PubMed] [Google Scholar]
- 47.Ferrara N, Winer J, Burton T, et al. Expression of vascular endothelial growth factor does not promote transformation but confers a growth advantage in vivo to Chinese hamster ovary cells. J Clin Invest 1993;91:160–70. [DOI] [PMC free article] [PubMed] [Google Scholar]
- 48.Jubb AM, Landon TH, Burwick J, et al. Quantitative analysis of colorectal tissue microarrays by immunofluorescence and in situ hybridization. J Pathol 2003;200:577–88. [DOI] [PubMed] [Google Scholar]
- 49.Bubendorf L, Nocito A, Moch H, et al. Tissue microarray (TMA) technology: miniaturized pathology archives for high-throughput in situ studies. J Pathol 2001;195:72–9. [DOI] [PubMed] [Google Scholar]
- 50.Hoos A, Urist MJ, Stojadinovic A, et al. Validation of tissue microarrays for immunohistochemical profiling of cancer specimens using the example of human fibroblastic tumors. Am J Pathol 2001;158:1245–51. [DOI] [PMC free article] [PubMed] [Google Scholar]
- 51.Birner P, Schindl M, Obermair A, et al. Overexpression of hypoxia-inducible factor 1alpha is a marker for an unfavorable prognosis in early-stage invasive cervical cancer. Cancer Res 2000;60:4693–6. [PubMed] [Google Scholar]
- 52.Frantz GD, Pham TQ, Peale FV Jr, et al. Detection of novel gene expression in paraffin-embedded tissues by isotopic in situ hybridization in tissue microarrays. J Pathol 2001;195:87–96. [DOI] [PubMed] [Google Scholar]
- 53.Lu LH, Gillett NA. An optimized protocol for in situ hybridization using PCR-generated 33P-labeled probes. Cell Vision 1994;1:169–76. [Google Scholar]
- 54.Reiner A, Yekutieli D, Benjamini Y. Identifying differentially expressed genes using false discovery rate controlling procedures. Bioinformatics 2003;19:368–75. [DOI] [PubMed] [Google Scholar]
- 55.Guidi AJ, Schnitt SJ, Fischer L, et al. Vascular permeability factor (vascular endothelial growth factor) expression and angiogenesis in patients with ductal carcinoma in situ of the breast. Cancer 1997;80:1945–53. [DOI] [PubMed] [Google Scholar]
- 56.Obermair A, Kucera E, Mayerhofer K, et al. Vascular endothelial growth factor (VEGF) in human breast cancer: correlation with disease-free survival. Int J Cancer 1997;74:455–8. [DOI] [PubMed] [Google Scholar]
- 57.Kranz A, Mattfeldt T, Waltenberger J. Molecular mediators of tumor angiogenesis: enhanced expression and activation of vascular endothelial growth factor receptor KDR in primary breast cancer. Int J Cancer 1999;84:293–8. [DOI] [PubMed] [Google Scholar]
- 58.Linderholm B, Lindh B, Tavelin B, et al. p53 and vascular-endothelial-growth-factor (VEGF) expression predicts outcome in 833 patients with primary breast carcinoma. Int J Cancer 2000;89:51–62. [PubMed] [Google Scholar]
- 59.Dvorak HF. Vascular permeability factor/vascular endothelial growth factor: a critical cytokine in tumor angiogenesis and a potential target for diagnosis and therapy. J Clin Oncol 2002;20:4368–80. [DOI] [PubMed] [Google Scholar]
- 60.Hanrahan V, Currie M, Gunningham S, et al. The angiogenic switch for vascular endothelial growth factor (VEGF)-A, VEGF-B, VEGF-C, and VEGF-D in the adenoma–carcinoma sequence during colorectal cancer progression. J Pathol 2003;200:183–94. [DOI] [PubMed] [Google Scholar]
- 61.Maeda K, Kang SM, Onoda N, et al. Vascular endothelial growth factor expression in preoperative biopsy specimens correlates with disease recurrence in patients with early gastric carcinoma. Cancer 1999;86:566–71. [DOI] [PubMed] [Google Scholar]
- 62.Bunone G, Vigneri P, Mariani L, et al. Expression of angiogenesis stimulators and inhibitors in human thyroid tumors and correlation with clinical pathological features. Am J Pathol 1999;155:1967–76. [DOI] [PMC free article] [PubMed] [Google Scholar]
- 63.Strohmeyer D, Rossing C, Bauerfeind A, et al. Vascular endothelial growth factor and its correlation with angiogenesis and p53 expression in prostate cancer. Prostate 2000;45:216–24. [DOI] [PubMed] [Google Scholar]
- 64.Fukuda S, Shirahama T, Imazono Y, et al. Expression of vascular endothelial growth factor in patients with testicular germ cell tumors as an indicator of metastatic disease. Cancer 1999;85:1323–30. [PubMed] [Google Scholar]
- 65.Doussis-Anagnostopoulou IA, Talks KL, Turley H, et al. Vascular endothelial growth factor (VEGF) is expressed by neoplastic Hodgkin-Reed-Sternberg cells in Hodgkin’s disease. J Pathol 2002;197:677–83. [DOI] [PubMed] [Google Scholar]
- 66.Yao M, Yoshida M, Kishida T, et al. VHL tumor suppressor gene alterations associated with good prognosis in sporadic clear-cell renal carcinoma. J Natl Cancer Inst 2002;94:1569–75. [DOI] [PubMed] [Google Scholar]
- 67.Ravindranath N, Wion D, Brachet P, et al. Epidermal growth factor modulates the expression of vascular endothelial growth factor in the human prostate. J Androl 2001;22:432–43. [PubMed] [Google Scholar]
- 68.Jackson M, Bentel J, Tilley W. Vascular endothelial growth factor (VEGF) expression in prostate cancer and benign prostatic hyperplasia. J Urol 1997;157:2040–1. [PubMed] [Google Scholar]