

Abstract
Background: The counting of intraepithelial lymphocytes (IELs) in the villous tips of architecturally normal small bowel biopsy specimens was proposed as a method to measure mucosal infiltration in gluten sensitive patients.
Aims: To apply this straightforward method in duodenal biopsy specimens from patients affected by potential coeliac disease (PCD) to verify whether it can discriminate these patients from controls.
Methods: Paraffin wax embedded duodenal sections from 11 patients affected by PCD were stained with an antihuman CD3 antibody. Sections from 19 patients affected by treated coeliac disease (TCD) and 17 patients in whom coeliac disease was excluded were stained with the same antibody to serve as controls. The slides were examined blindly. IELs/20 enterocytes in five randomly chosen villous tips were counted. Patients affected by PCD were all on a gluten containing diet. They had an architecturally normal duodenal mucosa and were positive for endomysial antibody. Both TCD and non-coeliac controls were negative for endomysial antibody.
Results: The mean villous tip IEL scores were 4.6 (SD, 1.5; range, 1.4–7.8) in non-coeliac controls, 7.9 (SD, 4.0; range, 2.0–18.6) in TCD, and 9.2 (SD, 4.7; range, 5.8–21.8) in patients with PCD. The difference between PCD and non-coeliac controls was significant.
Conclusions: This is a very simple and sufficiently reliable method to count IELs. In patients with an architecturally normal duodenal mucosa, the IEL count in villous tips helps to distinguish between patients with PCD and non-coeliac controls.
Keywords: coeliac disease, intraepithelial lymphocytes, enterocytes, endomysial antibody, gluten
Coeliac disease (CD) is a chronic but reversible enteropathy in which there is a characteristic, although non-specific, mucosal lesion of the small intestine, which impairs nutrient absorption by the involved bowel.1 Because the extension of the lesions along the small bowel probably varies, a wide spectrum of clinical presentations can occur in patients with CD, ranging from those with life threatening malabsorption to virtually non-symptomatic subjects.2
Increased intraepithelial infiltrate, crypt hyperplasia, and villous atrophy are the three basic features of coeliac enteropathy.1 Observing that the degree of any of these features can be variable, Marsh and Crowe proved that mucosal lesions range from an architecturally normal mucosa, with just an increased number of intraepithelial lymphocytes (IELs), to severe villous atrophy and crypt hyperplasia.3 Therefore, CD is characterised by not only a clinical, but also a pathological, spectrum.4
“A consensus on what is the normal count and what is the best method of counting intraepithelial lymphocytes is regrettably still lacking”
The most preserved histological end of the pathological spectrum is represented by an uncommon form of CD, defined as potential CD (PCD).4 A diagnosis of PCD can be made in any gluten consuming patient in whom, in spite of the presence of “coeliac stigmata” such as a high IEL count, high γ/δ IEL count, and/or positive endomysial antibodies (EMA), an architecturally normal small bowel mucosa can still be found.4,5 Interestingly, PCD can evolve into active CD—that is, a subtotal villous atrophy requiring a gluten free diet.5,6 As a result of several studies in the past decade, which focused on PCD to identify the best predictor of future mucosal flattening,7–15 EMA emerged as the most useful tool to predict such an evolution to a flat mucosa.14,15
From the pathologist’s point of view, an increased number of IELs in an architecturally normal duodenal mucosa always suggests PCD. However, although lymphocytic infiltration has been taken into account for the diagnosis of gluten sensitive enteropathy for the past 30 years,16 a consensus on what is the normal count and what is the best method of counting IELs is regrettably still lacking. This is clearly shown by the fact that several methods of counting IELs are now available.3,11,17–19
A new method that counts IELs in the villous tips has recently been proposed. It is easier and faster than the traditional methods and it was suggested to discriminate between “gluten sensitive patients” and controls.20 However, we do not completely agree with the clinical criteria used in that paper to distinguish gluten sensitive patients from controls, and we are not sure that those gluten sensitive patients can all be considered as being affected by PCD, according to Ferguson et al and Mäki et al.4,5 However, the method was very simple and straightforward. Therefore, we designed a study that could carefully evaluate whether the IEL count in the villous tips can differentiate patients with PCD from controls. We also compared the diagnostic efficacy of this new method with the “traditional” one currently used in our hospital.17 Morphometry and γ/δ IEL count, which can both suggest PCD, were applied also.9,21,22
PATIENTS AND METHODS
Patients and controls
Duodenal biopsy specimens from 11 patients (five females; mean age, 38.0 years; SD, 20.5) with PCD were studied retrospectively. Patients were classified as affected by PCD on the basis of positive EMA and a duodenal biopsy that pathologists had considered to be architecturally normal, being classified as either Marsh 0 or Marsh 1.3 However, to avoid a selection bias, the routine IEL count was not taken into account as an inclusion criterion. The patients were all on a gluten containing diet comparable to that of the general Italian population. However, the retrospective nature of our study did not allow us to have a prospective dietary diary. Table 1 summarises the patients’ clinical features.
Table 1.
Clinical features of patients affected by potential coeliac disease
| Patient | Sex | Age | Clinical features | HLA |
| CA | F | 13 | First degree relative of a patient affected by IDDM | DQ2 |
| GF | M | 23 | Dermatitis herpetiformis | NA |
| GG | M | 54 | Idiopathic dilated cardiomyopathy | DQ2 |
| LG | M | 62 | First degree relative of a patient affected by CD | NA |
| PJ | F | 19 | First degree relative of a patient affected by CD | DQ2 |
| RG | F | 46 | Idiopathic dilated cardiomyopathy | DQ2 |
| TR | M | 24 | First degree relative of a patient affected by CD | NA |
| VC | F | 23 | Weight loss, iron deficiency anaemia | NA |
| GL | M | 44 | Dermatitis herpetiformis | NA |
| ST | M | 42 | Dermatitis herpetiformis | NA |
| RN | F | 37 | Dermatitis herpetiformis | NA |
CD, coeliac disease; HLA, human major histocompatibility complex; IDDM, insulin dependent diabetes mellitus; NA, not available.
Seventeen patients (12 females; mean age, 41.5 years; SD, 14.9) with an architecturally normal duodenal mucosa, while on a gluten containing diet, and negative for coeliac antibodies served as controls. We defined them as non-coeliac controls. Their final diagnosis was irritable bowel syndrome (n = 10), anorexia (n = 3), iron deficiency anaemia not caused by malabsorption (n = 2), gastric lymphoma (n = 1), and epilepsy in a second degree relative of a patient with CD (n = 1).
Finally, duodenal biopsy specimens from 19 patients affected by treated CD (14 females; mean age, 35.4 years; SD, 12.1) were included. They had all been on a strict gluten free diet for at least 12 months; small bowel mucosa had been restored and coeliac antibodies were negative.
Methods
Paraffin wax embedded duodenal sections from patients and controls were stained with haematoxylin and eosin, Giemsa, and Alcian blue/periodic acid Schiff/haematoxylin methods. To enhance diagnostic accuracy, sections were immunostained using an antihuman CD3 antibody (A 0452; Dako, Glostrup, Denmark).
To identify γ/δ+ IELs, frozen sections from eight of the patients with PCD, five patients with treated CD, and 15 controls were available. Sections were immunostained with a 50% mix of two antihuman γ/δ T cell receptor antibodies (clone TS-1 and clone 5A6.E9; Serotec Ltd, Oxford, UK).
The slides were examined blindly by two authors (FB, OL). IELs were counted using both a traditional method (IELs/500 enterocytes),17 and the new method proposed by Goldstein.20 More precisely, this method consists of counting the IELs in the 20 uppermost enterocytes in five randomly chosen villous tips (fig 1). Morphometric measurement was applied according to Dunnill.21,22
Figure 1.

Starting from the tip of the villous (arrow), the intraepithelial lymphocytes in 10 enterocytes to the left and 10 to the right were counted.
Statistics
The Student’s t test (for unequal variances) was used to compare controls and PCD percentages, both in the traditional and new methods. Mean differences between groups and their 95% confidence intervals (CI) were also computed. A p value < 0.05 was considered significant. For comparison of methods and of interobserver and intraobserver variability, Lin’s concordance correlation coefficient was used, together with Bland and Altman’s limits of agreements procedures. Moreover, the discriminating ability of both methods in identifying PDC and controls was evaluated by computing the area under the receiver operator curve, after fitting a logistic model. Stata 8 (StataCorp, College Station, Texas, USA) was used for computation.
RESULTS
IEL count
IELs/500 enterocytes (traditional method): mean IELs/100 enterocytes were 25.2 (SD, 9.0; range, 9.2–45.3) in non-coeliac controls, 36.1 (SD, 15.3; range, 19.8–80.8) in treated CD, and 39.0 (SD, 15.3; range, 23.0–70.8) in patients with PCD. Although the difference between PCD and non-coeliac controls was significant (mean, 13.8; 95% CI, 2.9 to 24.7; t test, p = 0.017), the two groups overlapped considerably (fig 2A).
Figure 2.

(A) Intraepithelial lymphocytes (IELs)/100 enterocytes in the duodenal mucosa of patients with potential coeliac disease (PCD), non-coeliac controls (CONT), and treated coeliac disease (TCD). The horizontal lines indicate mean values. (B) IELs/20 villous tip enterocytes in the duodenal mucosa of patients with PCD, CONT, and TCD. The horizontal lines indicate mean values.
IELs in five villous tips (new method): mean IELs/20 enterocytes were 4.6 (SD, 1.5; range, 1.4–7.8) in non-coeliac controls, 7.9 (SD, 4.0; range, 2.0–18.6) in treated CD, and 9.2 (SD, 4.7; range, 5.8–21.8) in patients with PCD, corresponding to mean (SD) percentages of 22.9% (7.4%), 39.1% (19.3%), and 45.8% (23.2%), respectively. The difference between PCD and non-coeliac controls was significant (mean, 22.9%; 95% CI, 7.1% to 38.8%; t test, p = 0.009) and the overlap between the two groups was less than the one obtained with the traditional count (fig 2B).
Lin’s coefficient for the interobserver variability (OL, FB) of the new method was 0.77 (95% CI, 0.66 to 0.89), and the Bland and Altman 95% limits of agreements were −0.29 to 0.19 (fig 3). Despite these good results, although in the context of widespread data, the interobserver variability of the traditional method was slightly better (Lin’s coefficient, 0.85; 95% CI, 0.77 to 0.93; Bland and Altman 95% limits of agreements, −0.18 to 0.12; data not shown).
Figure 3.
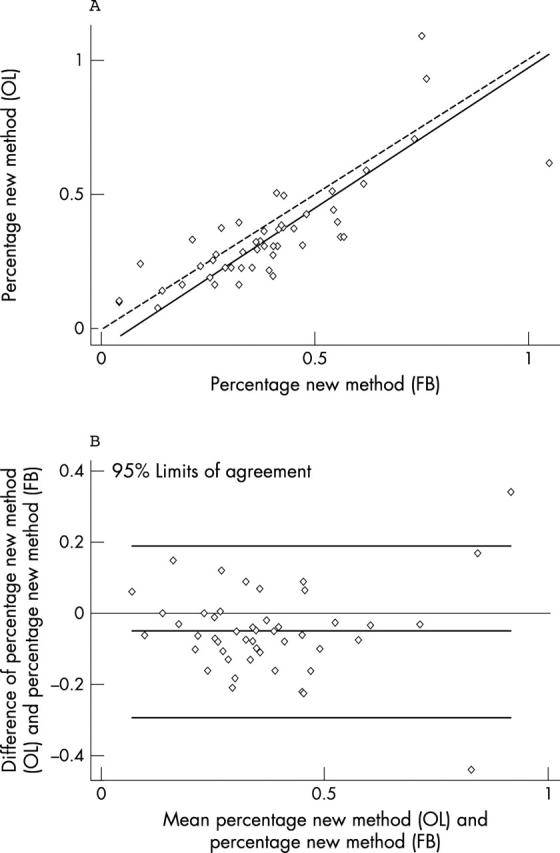
Interobserver variability for the new method. (A) Lin’s concordance correlation graph; (B) Bland and Altman graphic method. OL, experienced pathologist; FB, less experienced observer.
For comparison between the traditional and the new method (OL), Lin’s coefficient was 0.84 (95% CI, 0.76 to 0.91), and Bland and Altman 95% limits of agreements were −0.21 to 0.17 (fig 4).
Figure 4.
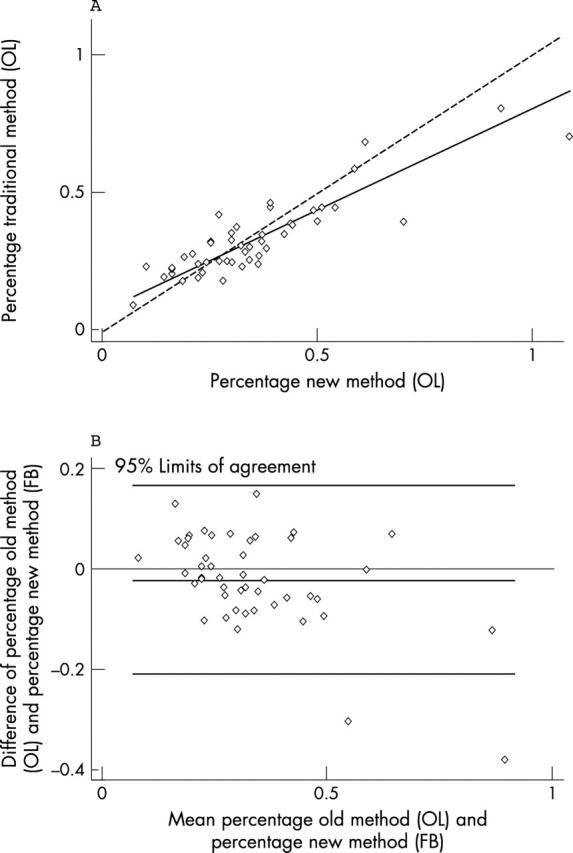
Correlation between the traditional and the new method for the experienced observer. (A) Lin’s concordance correlation graph; (B) Bland and Altman graphic method. OL, experienced pathologist; FB, less experienced observer.
Discrimination was good for both methods, although higher for the new one (area under the receiver operator curve, 0.82 and 0.94 for the old and new methods, respectively).
γ/δ+ IEL count
γ/δ+ IELs/500 enterocytes (traditional method): as expected, numbers of γ/δ+ IELs/100 enterocytes were increased in both patients with PCD and treated CD compared with non-coeliac controls (patients with PCD: mean, 13.0; SD, 6.7; range, 6.2–25.0; patients with treated CD: mean, 16.8; SD, 16.0; range, 5.0–45.2; non-coeliac controls: mean, 8.4; SD, 7.2; range, 0.0–20.0). However, probably because of the small sample size, the difference between PCD and non-coeliac controls was not significant (t test, p = 0.15).
γ/δ+ IEL in five villous tips (new method): mean numbers of villous tip γ/δ+ IEL/20 enterocytes were 1.1 (SD, 0.9; range, 0.0–3.0) in non-coeliac controls, 2.4 (SD, 2.2; range, 0.8–6.2) in treated CD, and 1.8 (SD, 0.6; range, 1.0–2.8) in patients affected by PCD. Although the two groups widely overlapped, the difference between PCD and non-coeliac controls was significant (t test, p = 0.038).
Morphometry
Morphometric measurements showed a mean (SD) surface to volume ratio of 15.9 (6.5) for PCD, 20.9 (6.3) for non-coeliac controls, and 21.0 (6.8) for patients with treated CD. The difference between patients with PCD and controls was not significant (t test, p > 0.05), and all values but one were within in our normal range (surface to volume ratio > 11.4). Therefore, we were confident that the small bowel biopsies from patients with PCD were architecturally normal.
DISCUSSION
PCD is a condition characterised by an architecturally normal duodenal mucosa in a patient presenting “coeliac stigmata” while on a gluten containing diet.4,5,15 However, in the past few years it has become evident that different coeliac stigmata have different abilities to predict evolution to a flat mucosa.14 We agree with Troncone et al that EMA are the most important coeliac stigmata. Antigliadin antibodies, tissue transglutaminase antibodies, or clinical response to a gluten free diet are unable to make a diagnosis of CD in a patient with an architecturally normal small bowel mucosa on a gluten containing diet.
“Most importantly, the new method is very fast, simple, and correlates with the traditional one”
A raised IEL count in an architecturally normal duodenal mucosa always suggests PCD to the pathologist. In spite of this, the pathologist’s work is hampered by the lack of consensus on both the best method of counting IELs and what should be considered a normal IEL count.23 The most common methods of counting IELs are also very time consuming. Counting IELs in the 20 uppermost enterocytes in five randomly chosen villous tips is an excellent method. Although the results of the pathologist (OL) were obviously better than those of the less experienced observer (FB), the new method can identify patients with PCD slightly better than the time consuming traditional one. Most importantly, the new method is very fast, simple, and correlates with the traditional one.
The experiment we planned was very carefully structured. Patients with PCD were selected exclusively on the basis of EMA positivity and architecturally normal duodenal mucosa. Other debatable criteria, such as positive antigliadin antibody or symptomatic remission when following a gluten free diet, were not taken into account. Slides were examined blindly. The risk of being influenced by a subjective IEL increase was further reduced by including slides from patients with well treated CD. Treated CD is characterised by a well known IEL increase despite mucosal restoration. Finally, to increase our accuracy, IELs were stained immunohistochemically. Therefore, we feel that our results do not merely confirm the work of Goldstein et al,20 but clearly show that this is a reliable method of counting IELs and of identifying patients affected by, not only PCD, but also other enteropathies not related to CD and characterised by intraepithelial lymphocytosis.24–26 The wide use of such a fast and straightforward method will thus increase our knowledge on the meaning of a raised IEL count within normal villi.
Take home messages.
The counting of intraepithelial lymphocytes (IELs) in the villous tips of architecturally normal small bowel biopsy specimens was a very simple and sufficiently reliable method to count IELs
In patients with an architecturally normal duodenal mucosa, the IEL count in villous tips helps to distinguish between patients with potential coeliac disease and non-coeliac controls
There are several reasons for not suggesting a gluten free diet in patients with either PCD or a raised IEL count. From a therapeutic point of view, a gluten free diet has never been shown to be effective; by definition, it will be unnecessary for an unknown length of time. From a diagnostic point of view, a gluten free diet has no role at all. In fact, it has already been shown that almost 40% of patients affected by irritable bowel syndrome show a symptomatic improvement on a wheat free diet.27 Finally, discrete alterations of the intestinal mucosa, such as an increased IEL count and minor villous alterations, can resolve in spite of a gluten containing diet.28 Therefore, starting a gluten free diet to establish whether such minimal lesions are gluten sensitive is useless. We believe that patients with PCD need to be maintained on a gluten containing diet and closely followed up so that a gluten free diet can be started only after clear villous atrophy has been detected. Rather than starting a gluten free diet, which would make it almost impossible to confirm or exclude the correct diagnosis, a gluten challenge to identify a gluten dependency by exacerbating the minimal intestinal lesions is probably a more sensible way of dealing with these patients.28,29
Acknowledgments
We are indebted to Mrs A Galletti for technical assistance.
Abbreviations
CD, coeliac disease
CI, confidence interval
EMA, endomysial antibodies
IEL, intraepithelial lymphocyte
PCD, potential coeliac disease
REFERENCES
- 1.Trier JS. Celiac sprue and refractory sprue. In: Feldman M, Scharschmidt BF, Sleisenger MH, eds. Sleisenger and Fordtran’s gastrointestinal and liver disease. 6th ed. Philadelphia: WB Saunders, 1997:1557–73.348557
- 2.Biagi F, Corazza GR. Clinical features of coeliac disease. Dig Liver Dis 2002;34:225–8. [DOI] [PubMed] [Google Scholar]
- 3.Marsh MN, Crowe PT. Morphology of the mucosal lesion in gluten sensitivity. Baillieres Clin Gastroenterol 1995;9:273–93. [DOI] [PubMed] [Google Scholar]
- 4.Ferguson A, Arranz E, O’Mahony S. Clinical and pathological spectrum of coeliac disease—active, silent, latent, potential. Gut 1993;34:150–1. [DOI] [PMC free article] [PubMed] [Google Scholar]
- 5.Mäki M, Holm K, Koskimies S, et al. Normal small bowel biopsy followed by coeliac disease. Arch Dis Child 1990;65:1137–41. [DOI] [PMC free article] [PubMed] [Google Scholar]
- 6.Corazza GR, Andreani ML, Biagi F, et al. The clinical, pathological, and antibody pattern of latent celiac disease, report of three adult cases. Am J Gastroenterol 1996;91:2203–7. [PubMed] [Google Scholar]
- 7.Collin P, Helin H, Mäki M, et al. Follow-up of patients positive in reticulin and gliadin antibody tests with normal small-bowel biopsy findings. Scand J Gastroenterol 1993;28:595–8. [DOI] [PubMed] [Google Scholar]
- 8.Corazza G, Valentini RA, Frisoni M, et al. Gliadin immune reactivity is associated with overt and latent enteropathy in relatives of celiac patients. Gastroenterology 1992;103:1517–22. [DOI] [PubMed] [Google Scholar]
- 9.Mäki M, Holm K, Collin P, et al. Increase in γ/δ T cell receptor bearing lymphocytes in normal small bowel mucosa in latent coeliac disease. Gut 1991;32:1412–14. [DOI] [PMC free article] [PubMed] [Google Scholar]
- 10.Johnston SD, Watson RG, Middleton D, et al. Genetic, morphometric and immunohistochemical markers of latent coeliac disease. Eur J Gastroenterol Hepatol 1999;11:1283–8. [DOI] [PubMed] [Google Scholar]
- 11.Kaukinen K, Turjanmaa K, Mäki M, et al. Intolerance to cereals is not specific for coeliac disease. Scand J Gastroenterol 2000;35:942–6. [DOI] [PubMed] [Google Scholar]
- 12.Kaukinen K, Mäki M, Partanen J, et al. Celiac disease without villous atrophy: revision of criteria called for. Dig Dis Sci 2001;46:879–87. [DOI] [PubMed] [Google Scholar]
- 13.Westerholm-Ormio M, Garioch J, Ketola I, et al. Inflammatory cytokines in small intestinal mucosa of patients with potential coeliac disease. Clin Exp Immunol 2002;128:94–101. [DOI] [PMC free article] [PubMed] [Google Scholar]
- 14.Troncone R, Greco L, Mayer M, et al. Latent and potential coeliac disease. Acta Paediatr Suppl 1996;412:10–14. [DOI] [PubMed] [Google Scholar]
- 15.Holmes GK. Potential and latent coeliac disease. Eur J Gastroenterol Hepatol 2001;13:1057–60. [DOI] [PubMed] [Google Scholar]
- 16.Fry L, Seah PP, McMinn RM, et al. Lymphocytic infiltration of epithelium in diagnosis of gluten-sensitive enteropathy. BMJ 1972;3:371–4. [DOI] [PMC free article] [PubMed] [Google Scholar]
- 17.Ferguson A, Murray D. Quantitation of intraepithelial lymphocytes in human jejunum. Gut 1971;12:988–94. [DOI] [PMC free article] [PubMed] [Google Scholar]
- 18.Guix M, Skinner JM, Whitehead R. Measuring intraepithelial lymphocytes, surface area, and volume of lamina propria in the jejunal mucosa of coeliac patients. Gut 1979;20:275–8. [DOI] [PMC free article] [PubMed] [Google Scholar]
- 19.Corazza GR, Frazzoni M, Gasbarrini G. Jejunal intraepithelial lymphocytes in coeliac disease: are they increased or decreased? Gut 1984;25:158–62. [DOI] [PMC free article] [PubMed] [Google Scholar]
- 20.Goldstein NS, Underhill J. Morphologic features suggestive of gluten sensitivity in architecturally normal duodenal biopsy specimens. Am J Clin Pathol 2001;116:63–71. [DOI] [PubMed] [Google Scholar]
- 21.Dunnill MS, Whitehead R. A method for the quantitation of small intestinal biopsy specimens. J Clin Pathol 1972;25:243–6. [DOI] [PMC free article] [PubMed] [Google Scholar]
- 22.Corazza GR, Bonvicini F, Frazzoni M, et al. Observer variation in assessment of jejunal biopsy specimens. A comparison between subjective criteria and morphometric measurement. Gastroenterology 1982;83:1217–22. [PubMed] [Google Scholar]
- 23.Hayat M, Cairns A, Dixon MF, et al. Quantitation of intraepithelial lymphocytes in human duodenum: what is normal? J Clin Pathol 2002;55:393–4. [DOI] [PMC free article] [PubMed] [Google Scholar]
- 24.Mahadeva S, Wyatt JI, Howdle PD. Is a raised intraepithelial lymphocyte count with normal duodenal villous architecture clinically relevant? J Clin Pathol 2002;55:424–8. [DOI] [PMC free article] [PubMed] [Google Scholar]
- 25.Kakar S, Nehra V, Murray JA, et al. Significance of intraepithelial lymphocytosis in small bowel biopsy samples with normal mucosal architecture. Am J Gastroenterol 2003;98:2027–33. [DOI] [PubMed] [Google Scholar]
- 26.Tornblom H, Lindberg G, Nyberg B, et al. Full-thickness biopsy of the jejunum reveals inflammation and enteric neuropathy in irritable bowel syndrome. Gastroenterology 2003;123:2144–7. [DOI] [PubMed] [Google Scholar]
- 27.Nanda R, James R, Smith H, et al. Food intolerance and the irritable bowel syndrome. Gut 1989;30:1099–104. [DOI] [PMC free article] [PubMed] [Google Scholar]
- 28.Gudjónsdottir A, Ascher H, Ryd W, et al. Discrete alterations of the intestinal mucosa are not part of the coeliac disease syndrome. In: Lohimann S, Collin P, Mäki M, eds. Changing features of coeliac disease. Tampere: Finnish Coeliac Society, 1998:A102.
- 29.Wahab PJ, Crusius JB, Meijer JW, et al. Gluten challenge in borderline gluten-sensitive enteropathy. Am J Gastroenterol 2001;96:1464–9. [DOI] [PubMed] [Google Scholar]