Abstract
Aims: To determine the relevance of lymphopenia to the diagnosis of bacteraemia in patients admitted with medical emergencies, relative to peripheral blood white cell count and neutrophilia.
Patients/Methods: A two year cohort study carried out in a teaching hospital in Oxford, UK of 21 495 consecutive adult emergency admissions to general medical or infectious disease wards. Full blood data were available in 21 372 cases; 41 cases with extreme full blood count results (neutrophil count, > 75 × 109/litre; lymphocyte count, > 10 × 109/litre) were excluded, leaving 21 331 cases for analysis. The association between the admission lymphocyte and neutrophil counts and the risk of bacteraemia was assessed.
Results: Neutrophilia and lymphopenia were both associated with bacteraemia. Lymphopenia was the better predictor in this cohort. Both neutrophilia and lymphopenia were more predictive of bacteraemia than the total white blood cell count.
Conclusions: Both lymphocyte and neutrophil counts, rather than total white blood cell count, should be considered in adult medical admissions with suspected bacteraemia.
Keywords: lymphopenia, blood cell count, sensitivity and specificity, bacteraemia
Alterations of white blood cell count (WBC) are well recognised features of sepsis,1 and raised WBC and neutrophilia are associated with bacteraemia in both adults2 and children.3,4 A rapid, profound lymphopenia occurs in primates with experimental bacteraemia.5–7 Recent clinical studies, performed on groups at low human immunodeficiency virus (HIV) risk, suggest that lymphopenia may define patients at high risk of adverse outcome. For example, lymphopenia is a risk factor for intensive care in unwell infants,8 and for death in nursing home residents with pneumonia.9
“The existing literature on the relation between lymphopenia and bacteraemia is difficult to evaluate”
In view of this, we investigated whether lymphopenia was useful for predicting bacteraemia clinically, an activity that remains imprecise even after detailed study.2,10 The existing literature on the relation between lymphopenia and bacteraemia is difficult to evaluate: two observational studies, involving a total of about 750 elderly patients, have noted lymphopenia in some patients with bacteraemia, but specificity varied between the studies, and the distributions of the counts were not reported.11,12 Generalisation of the published data to other populations is further complicated by the gradual decline in lymphocyte counts that occurs as normal adults age.13,14 We sought to clarify the relation between age, lymphocyte count, neutrophil count, and bacteraemia by the study of a large cohort of adults with medical emergencies in a region, which, at the time of study, had a low prevalence of HIV.
METHODS
Study design and setting
The cohort studied comprised consecutive patients, aged at least 18 years, admitted from the community as emergencies to general medical or infectious diseases services of the Oxford Radcliffe Hospital, UK, from 1 February 1999 to 31 January 2001. Patients admitted to haematology or cardiology wards did not form part of the cohort because admission to these wards usually implies either known haematological disease or an acute coronary syndrome.
Microbiology and haematology
Blood cultures were taken by medical staff if thought to be clinically indicated, using pairs of anaerobic and aerobic Bactec F+ bottles (Becton-Dickinson, Oxford, UK). Bottles were incubated for five days, unless endocarditis was suspected, when 21 day incubations were used. Isolates were speciated by routine methods. Admission cultures were defined as those taken in the first two days of admission. Full blood counts were performed using a Technicon H3 analyser (Bayer, Newbury, UK). The clinical laboratories involved in specimen processing were accredited by the UK Clinical Pathology Accreditation scheme.
For the purposes of our study, we considered “significant isolates” as any blood culture yielding an organism other than a coagulase negative staphylococcus or Corynebacterium spp. These isolates are unlikely to reflect genuine bacteraemia in the population studied, in which line related sepsis is very rare. Mixed cultures were considered significant if organisms other than coagulase negative staphylococcus or Corynebacterium spp were isolated.
Data collection and analysis
Data used in the study were recorded during the patients’ admissions on the hospital’s information systems, and abstracted in an anonymous form. Analysis was performed at the end of the study period.
Statistical methods
SPSS version 11 was used for logistic regression and receiver operating characteristic (ROC) plotting. ROC plots displayed sensitivity versus 1-specificity, such that the areas under the curve (AUCs) generated varied from 0.5 to 1.0, with higher values indicating increased discriminatory ability. Confidence intervals on AUCs of ROC plots were calculated using non-parametric assumptions. The odds of significant bacteraemia for a given group of patients were calculated as: cases of significant bacteraemia/cases without significant bacteraemia. For univariate and multivariate logistic regression analysis, a variable was calculated to represent the distance between the observed lymphocyte and neutrophil counts and a count in the normal range (7 × 10⁹/litre and 2 × 10⁹/litre, respectively). This variable, calculated as ((neutrophils) − 7 × 10⁹/litre) × (2 × 10⁹/litre − (lymphocytes))/1 × 109/litre), increases as lymphocytes fall and neutrophils rise.
RESULTS
Composition of the cohort
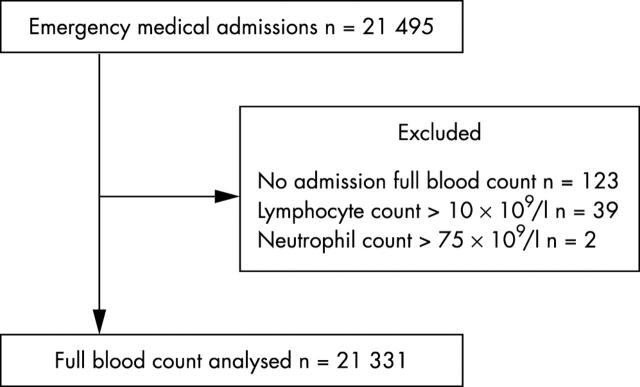
There were 21 495 patients and 21 331 were analysed further. Figure 1 shows the reasons for exclusion. Ages ranged from 18 years to 106 years; the average inpatient stay was 6.4 days. Admission cultures were obtained from 7182 (33.6%) patients. Of these, in 5964 cases (83.0%), a single pair (aerobic and anaerobic) was used. Significant isolates were isolated from 530 patients. There were 520 cases of coagulase negative staphylococcus and 39 cases of Corynebacterium spp; these were considered contaminants. Table 1 shows the numbers of patients, their ages, and the blood culture isolates obtained.
Figure 1.
Cases analysed. The reasons for exclusion of cases, and the distribution of lymphocyte and neutrophil counts within the cohort are shown.
Table 1.
Blood culture isolates obtained
| Age (years) | Total | ||||||||
| 18–29 | 30–39 | 40–49 | 50–59 | 60–69 | 70–79 | 80–89 | ⩾90 | ||
| Not cultured | 1369 | 1238 | 1270 | 1575 | 2030 | 3051 | 2869 | 766 | 14168 |
| No significant isolates | 639 | 586 | 552 | 595 | 815 | 1468 | 1553 | 460 | 6668 |
| Coagulase negative staphylococci | 29 | 28 | 35 | 57 | 79 | 124 | 132 | 36 | 520 |
| Diphtheroids | 2 | 1 | 4 | 2 | 2 | 12 | 11 | 5 | 39 |
| All significant isolates | 38 | 35 | 27 | 38 | 57 | 151 | 157 | 33 | 536 |
| Escherichia coli | 7 | 4 | 5 | 5 | 15 | 50 | 49 | 11 | 146 |
| Other Enterobacteriaceae and Pseudomonas spp | 5 | 3 | 2 | 6 | 11 | 12 | 28 | 6 | 73 |
| Staphylococcus aureus | 5 | 7 | 6 | 11 | 7 | 18 | 22 | 1 | 77 |
| Streptococcus pneumoniae | 3 | 6 | 1 | 3 | 12 | 16 | 10 | 3 | 54 |
| β Haemolytic streptococci | 1 | 3 | 2 | 3 | 1 | 11 | 11 | 1 | 33 |
| Anaerobes | 1 | 1 | 2 | 4 | |||||
| Fungi | 1 | 1 | 2 | 4 | |||||
The numbers of cases cultured and the culture results are shown, stratified by age.
Association between age, bacteraemia, and cell counts
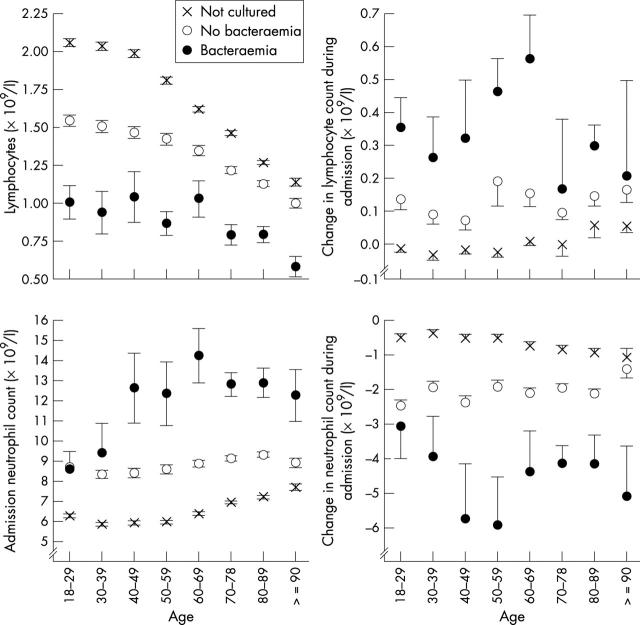
In our cohort, the peripheral lymphocyte count declined with age (fig 2), as described previously.13,14 However, at all ages, the lymphocyte count was highest in those in whom cultures were not performed, intermediate in those in whom cultures were taken but no significant isolate obtained, and lowest in the patients with bacteraemia (fig 2A).
Figure 2.
Neutrophil and lymphocyte counts by age. Age stratified lymphocyte and neutrophil counts among non-cultured, culture negative, and culture positive patients are shown. Symbols indicate the admission value; errors are standard errors of the mean. Table 1 shows the numbers of cases at each point.
Change in lymphocyte count during admission
We considered whether the lymphopenia that we observed was, as predicted by experimental data,5,6 a transient phenomenon, or whether it represented a pre-existing condition predisposing to bacteraemia. Admission blood counts were compared with the last count taken during the admission. Figure 2 shows that, during admission, both the admission neutrophilia and lymphopenia seen in the patients with bacteraemia declined, compatible with both changes being a response to bacteraemia.
Lymphocyte and neutrophil counts and bacteraemia risk
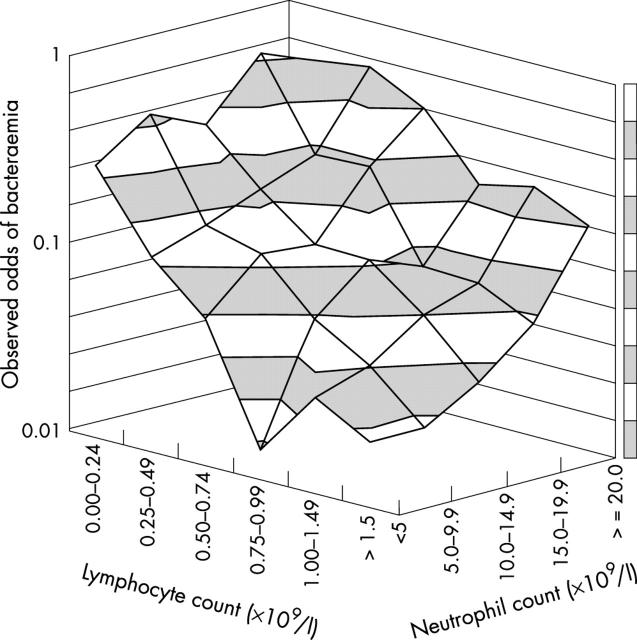
The observed odds of bacteraemia (the number of patients with bacteraemia/number without bacteraemia) were calculated for the 7182 patients whose blood had been cultured, stratified by lymphocyte and neutrophil count. Table 2 shows the absolute numbers of patients in each stratum. In fig 3, a surface is drawn through the observed bacteraemia odds. As expected, odds of bacteraemia increased with increasing neutrophil count. However, there was also a pronounced increase in bacteraemia odds as the lymphocyte count declined below 1.5 × 10⁹/litre, an effect evident at all neutrophil counts. This suggests that neutrophilia and lymphopenia independently predict bacteraemia.
Table 2.
Distribution of lymphocytes and neutrophils in patients with medical emergencies
| Culture status | Neutrophils(×109/l) | Index test: lymphocytes (×109/l) | Total | ||||||
| 0.00–0.24 | 0.25–0.49 | 0.50–0.74 | 0.75–0.99 | 1.00–1.49 | 1.50–1.99 | ⩾2.00 | |||
| Not cultured | 0.0–4.9 | 33 | 111 | 290 | 503 | 1431 | 1269 | 1766 | 5403 |
| 5.0–9.9 | 32 | 213 | 581 | 860 | 1916 | 1463 | 1742 | 6807 | |
| 10.0–14.9 | 14 | 129 | 203 | 246 | 423 | 227 | 267 | 1509 | |
| 15.0–19.9 | 7 | 26 | 63 | 68 | 62 | 43 | 44 | 313 | |
| ⩾20.0 | 5 | 11 | 20 | 24 | 17 | 16 | 24 | 117 | |
| Total | 91 | 490 | 1157 | 1701 | 3849 | 3018 | 3843 | 14149 | |
| No significant bacteraemia | 0.0–4.9 | 56 | 118 | 181 | 206 | 368 | 260 | 231 | 1420 |
| 5.0–9.9 | 56 | 265 | 415 | 512 | 821 | 528 | 501 | 3098 | |
| 10.0–14.9 | 24 | 161 | 217 | 246 | 378 | 174 | 154 | 1354 | |
| 15.0–19.9 | 12 | 69 | 97 | 86 | 138 | 48 | 57 | 507 | |
| ⩾20.0 | 14 | 30 | 52 | 48 | 55 | 38 | 36 | 273 | |
| Total | 162 | 643 | 962 | 1098 | 1760 | 1048 | 979 | 6652 | |
| Significant bacteraemia | 0.0–4.9 | 16 | 13 | 11 | 3 | 12 | 6 | 5 | 66 |
| 5.0–9.9 | 25 | 36 | 47 | 31 | 33 | 12 | 11 | 195 | |
| 10.0–14.9 | 8 | 29 | 23 | 26 | 24 | 8 | 3 | 121 | |
| 15.0–19.9 | 8 | 16 | 23 | 7 | 11 | 3 | 3 | 71 | |
| ⩾20.0 | 6 | 17 | 21 | 9 | 12 | 2 | 10 | 77 | |
| Total | 63 | 111 | 125 | 76 | 92 | 31 | 32 | 530 | |
The numbers of patients in each stratum of lymphocytes and neutrophils examined are shown.
Figure 3.
Odds of bacteraemia by cell count. The odds of bacteraemia (number of patients with bacteraemia/number without bacteraemia) among the patients whose blood was cultured, stratified by neutrophil and lymphocyte counts.
Lymphocyte counts less than 0.25 × 10⁹/litre, referred to here as extreme lymphopenia, identified the group with the highest risk of bacteraemia. This is evident from fig 4, which shows an alternative representation of the data in fig 3. Extreme lymphopenia was found in 12% (63 of 530) of the patients with bacteraemia, but only 2.4% (162 of 6652) of the patients without significant isolates. Extreme lymphopenia, similar to less severe lymphopenia, appears to recover during hospital stay: the mean difference between admission and predischarge lymphocyte counts was 0.62 × 10⁹/litre (95% confidence interval, 0.48 to 0.76) with extreme lymphopenia, and 0.36 × 10⁹/litre (95% confidence interval, 0.29 to 0.43) without extreme lymphopenia.
Figure 4.
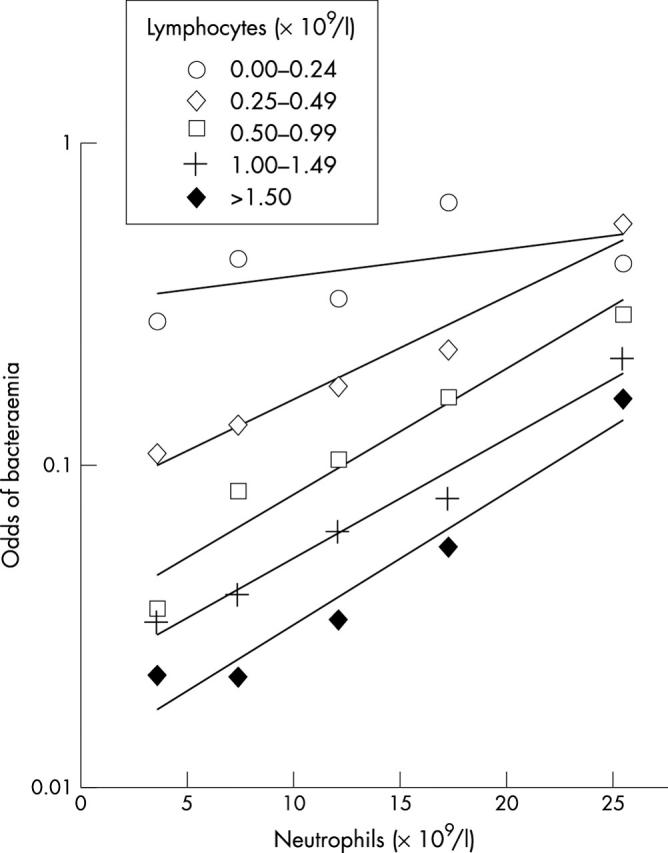
Odds of bacteraemia by cell count. The odds of bacteraemia (number of patients with bacteraemia/number without bacteraemia) among the patients whose blood was cultured, stratified by neutrophil and lymphocyte counts. An alternative representation of the data in fig 3.
Interestingly, in the extreme lymphopenic group, the strength of the association of bacteraemia with the neutrophil count appears to be less than that at higher lymphocyte counts. Mathematically, this would represent an interaction between neutrophil and lymphocyte counts. To investigate this further, and to examine the effect of age, logistic regression was performed. Univariate logistic regression showed that the neutrophil count, the lymphocyte count, and their interaction were strongly associated, and age and WBC were weakly associated with bacteraemia (table 3). WBC was not used in multivariate modelling because of a strong correlation with neutrophil count. Of the other variables, neutrophil count, lymphocyte count, their interaction, but not age, remained significant on multivariate analysis (table 3).
Table 3.
Logistic regression relating significant bacteraemia to full blood count
| Culture negative (n = 6652) | Culture positive (n = 530) | Univariate | Multivariate | ||||||||||
| Mean | SD | Mean | SD | OR | 95% CI | Wald | p Value | OR | 95% CI | Wald | p Value | ||
| Age | 64.3 | 21.5 | 68.4 | 19.8 | 1.01 | (1.01 to 1.01) | 18 | <0.001 | 1.00 | (1.00 to 1.01) | 1.8 | 0.17 | |
| WBC (×109/l) | 11.3 | 7.4 | 14.2 | 8.9 | 1.04 | (1.02 to 1.05) | 39 | <0.001 | Not entered | ||||
| Lymphocytes (×109/l) | 1.30 | 0.90 | 0.85 | 0.72 | 0.35 | (0.29 to 0.41) | 140 | <0.001 | 0.3 | (0.24 to 0.37) | 114 | <0.001 | |
| Neutrophils (×109/l) | 8.9 | 5.2 | 12.4 | 8.4 | 1.09 | (1.07 to 1.10) | 165 | <0.001 | 1.12 | (1.06 to 1.15) | 95 | <0.001 | |
| Neutrophil–lymphocyte interaction | 2.4 | 6.9 | 6.9 | 12.5 | 1.07 | (1.06 to 1.08) | 165 | <0.001 | 0.97 | (0.95 to 0.98) | 15 | <0.001 | |
Univariate and multivariate logistic regression of admission peripheral blood count with blood culture positivity. Wald refers to the Wald statistic.
CI, confidence interval; OR, odds ratio; WBC, white blood cell count.
Comparison of counts in bacteraemia prediction
Single variables associated with disease are simple to use clinically, and are potentially of diagnostic value. The 7182 blood cultured cases were examined, both as a whole, and in age stratified bands, and a comparison was made of the ability of raised WBC, depressed lymphocyte count, and raised neutrophil count to predict bacteraemia using ROC plotting. A significantly higher AUC, a parameter reflecting discriminatory ability, was found for lymphocyte count compared with either WBC or neutrophil count (fig 5). This effect was also evident in age stratified analysis; the lymphocyte count performed significantly better than the WBC or neutrophil count in all but one of the strata examined (table 4).
Figure 5.
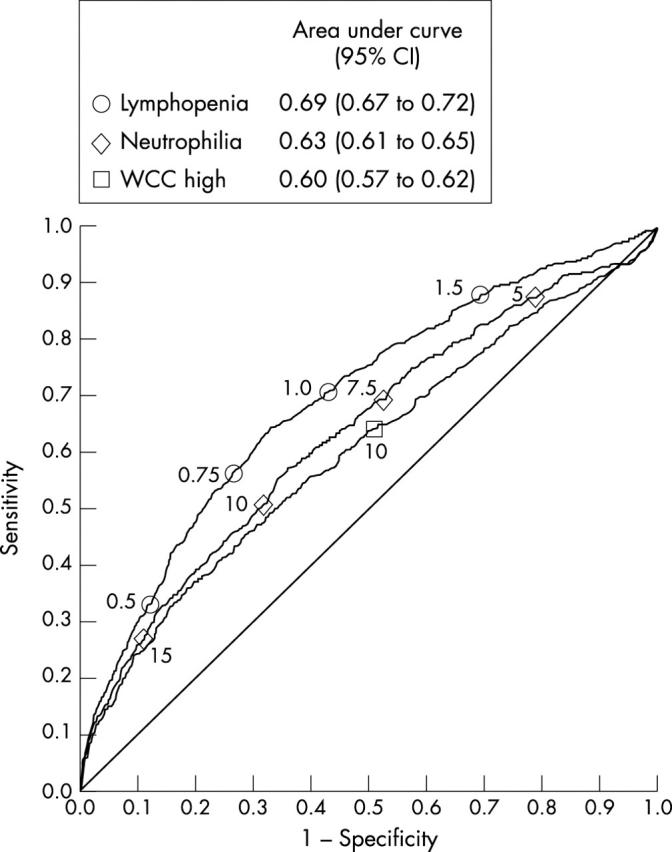
White cell count (WCC) components predicting bacteraemia. A receiver operator characteristic plot is shown, illustrating the ability of admission WCC, neutrophil count, and lymphocyte count to predict bacteraemia among all 7182 patients in whom blood cultures were taken. The symbols on the curve indicate the positions of particular counts; for example, the circle 1.0 indicates the performance of a lymphocyte count of 1.0 × 10⁹/litre. Areas under the curve, and their confidence intervals (CI), are shown in the box for each variable. Higher areas under the curve indicate better discrimination.
Table 4.
AUCs (95% CI) for the discrimination of patients with bacteraemia from those without bacteraemia
| Age | Lymphocytopenia | Neutrophilia | Raised total WBC |
| <50 | 0.69 (0.66 to 0.72) | 0.56 (0.53 to 0.59)** | 0.52 (0.49 to 0.55)** |
| 50–69 | 0.67 (0.64 to 0.70) | 0.63 (0.60 to 0.68)* | 0.59 (0.56 to 0.63)* |
| 70–79 | 0.69 (0.67 to 0.71) | 0.67 (0.65 to 0.70) | 0.65 (0.62 to 0.67)* |
| >80 | 0.68 (0.66 to 0.70) | 0.63 (0.61 to 0.66)** | 0.62 (0.60 to 0.64)** |
| All cases | 0.69 (0.67 to 0.72) | 0.63 (0.61 to 0.66)** | 0.60 (0.57 to 0.62)** |
WBC components predicting bacteraemia stratified by age. AUCs were calculated for different age groups, comparing the ability of lymphocytopenia, neutrophilia, and raised total WBC to discriminate patients with bacteraemia from those without. Higher AUCs indicate better discrimination. Comparisons were made between the lymphocytopenia AUCs and neutrophilia or WBC AUCs. *p<0.05; **p<0.01 (comparisons made by Z testing).
AUC, area under the receiver operator characteristic plot; CI, confidence interval; WBC, white blood cell count.
DISCUSSION
Our study describes the quantitative association between lymphopenia and the risk of bacteraemia in a large cohort of patients admitted to a UK hospital with medical emergencies. Both lymphopenia and neutrophilia are independently associated with bacteraemia, and there is a group of patients who are lymphopenic, and at very high risk of bacteraemia, whose total WBC and neutrophil counts lie within the normal range. The lymphopenia–bacteraemia association was seen in patients at all ages studied.
Our observations are compatible with reports from smaller series of elderly patients describing lymphocyte counts less than 1 × 10⁹/litre as being associated with bacteraemia.11,12 An association of bacteraemia and lymphopenia may also explain the associations between lymphopenia and disease severity in nursing home residents with pneumonia,9 and surgical patients after emergency laparotomy.15 Our observations are also compatible with the rapid decline in blood lymphocyte count occurring in animal and human models of sepsis.5–7 Bacterial sepsis was an important cause of lymphopenia in the population studied, but lymphopenia is not specific for sepsis of bacterial origin, because it also occurs in severe viral infections.16–18
Although the hospital in which the study was performed is a tertiary referral centre, the study cohort comprised individuals admitted from the community as an emergency. As such, they are likely to be representative of emergency medical admissions in the UK. Their microbiological investigation was probably typical of that widely practiced, because the proportion of patients cultured in this cohort was similar to that reported from a comparable cohort in another European hospital.12
HIV associated lymphopenia might complicate the observed association between lymphopenia and bacteraemia. However, HIV prevalence, determined by an unlinked seroprevalence study,19 was about 1/1000 during the study, and the lymphopenia–bacteraemia association was seen at all ages, including the elderly, in whom HIV is extremely rare in Oxfordshire,19 so HIV related changes in WBC are unlikely to be an important confounder.
We used a stringent definition of significant bacteraemia, regarding all isolates except Corynebacterium spp or coagulase negative staphylococci as significant for the purpose of our study. Therefore, our definition will classify many organisms, including α haemolytic streptococci and enterococci, as significant. Although such organisms are sometimes associated with serious pathology, their isolation may also be of little importance, especially when only isolated from a single culture. A chart review could have been used to determine the probable relevance of individual cases. However, this process is often subjective, so we persisted with a stringent definition, which probably led to an underestimation of the true lymphopenia–bacteraemia association.
“The clinical usefulness of lymphopenia as a diagnostic and prognostic marker merits further investigation in other centres and populations”
The induction of tumour necrosis factor family members occurs early in the inflammatory response; these engage receptors expressed on lymphocytes and cause lymphocyte apoptosis, as reviewed previously.20 The decline in lymphocyte numbers seen in our study is probably the result of large scale lymphocyte apoptosis, which has been seen in several animal models of sepsis,21,22 in the spleens of humans who have died of sepsis,23 and in the peripheral blood of patients with sepsis.6,23–25 Interestingly, CD4 T helper type 1 and 2 cells may be differentially susceptible.25,26 The study of mice with genetic abnormalities of the apoptotic machinery, and of mice treated with apoptosis inhibitors,27,28 shows that lymphocyte apoptosis influences mortality in sepsis. This is probably because protective lymphocyte dependent immune responses24 are decreased by the widespread death of lymphocytes. These studies imply that the decline in peripheral blood lymphocyte numbers seen in our study is the result of a key pathogenic mechanism in sepsis.
The data presented in our paper show that, in populations with a high prevalence of bacterial infections, lymphopenia may reflect bacteraemia. Importantly, in our large cohort, lymphopenia performed significantly better than either neutrophil count or WBC in bacteraemia prediction, although these last two markers are very widely used in the assessment of infected patients. Therefore, the clinical usefulness of lymphopenia as a diagnostic and prognostic marker merits further investigation in other centres and populations, both alone and in combination with other laboratory measures of the acute phase response.29,30
Take home messages.
In a cohort of adult medical admissions with suspected bacteraemia, neutrophilia and lymphopenia were both associated with bacteraemia, although lymphopenia was the better predictor
Both neutrophilia and lymphopenia were more predictive of bacteraemia than the total white blood cell count
Acknowledgments
We thank Professor J Wainscoat and Drs A Berendt, N Day, P Klenerman, and E Torok for helpful comments.
Abbreviations
AUC, area under the curve
HIV, human immunodeficiency virus
ROC, receiver operating characteristic
WBC, white blood cell count
REFERENCES
- 1.Bone RC, Sibbald WJ, Sprung CL. The ACCP-SCCM consensus conference on sepsis and organ failure. Chest 1992;101:1481–3. [DOI] [PubMed] [Google Scholar]
- 2.Shapiro NI, Wolfe RE, Wright S, et al. Who needs a blood culture? A prospectively derived and validated clinical prediction rule. Acad Emerg Med 2003;10:435–6. [DOI] [PubMed] [Google Scholar]
- 3.Gombos MM, Bienkowski RS, Gochman RF, et al. The absolute neutrophil count: is it the best indicator for occult bacteremia in infants? Am J Clin Pathol 1998;109:221–5. [DOI] [PubMed] [Google Scholar]
- 4.Isaacman DJ, Shults J, Gross TK, et al. Predictors of bacteremia in febrile children 3 to 36 months of age. Pediatrics 2000;106:977–82. [DOI] [PubMed] [Google Scholar]
- 5.Hawes AS, Fischer E, Marano MA, et al. Comparison of peripheral blood leukocyte kinetics after live Escherichia coli, endotoxin, or interleukin-1 alpha administration. Studies using a novel interleukin-1 receptor antagonist. Ann Surg 1993;218:79–90. [DOI] [PMC free article] [PubMed] [Google Scholar]
- 6.Krabbe KS, Bruunsgaard H, Qvist J, et al. Activated T lymphocytes disappear from circulation during endotoxemia in humans. Clin Diagn Lab Immunol 2002;9:731–5. [DOI] [PMC free article] [PubMed] [Google Scholar]
- 7.van der Poll T, Levi M, van Deventer SJ, et al. Differential effects of anti-tumor necrosis factor monoclonal antibodies on systemic inflammatory responses in experimental endotoxemia in chimpanzees. Blood 1994;83:446–51. [PubMed] [Google Scholar]
- 8.Adamski JK, Arkwright PD, Will AM, et al. Transient lymphopenia in acutely unwell young infants. Arch Dis Child 2002;86:200–1. [DOI] [PMC free article] [PubMed] [Google Scholar]
- 9.Mehr DR, Binder EF, Kruse RL, et al. Predicting mortality in nursing home residents with lower respiratory tract infection: the Missouri LRI study. JAMA 2001;286:2427–36. [DOI] [PubMed] [Google Scholar]
- 10.Mylotte JM, Tayara A. Blood cultures: clinical aspects and controversies. Eur J Clin Microbiol Infect Dis 2000;19:157–63. [DOI] [PubMed] [Google Scholar]
- 11.Pfitzenmeyer P, Decrey H, Auckenthaler R, et al. Predicting bacteremia in older patients. J Am Geriatr Soc 1995;43:230–5. [DOI] [PubMed] [Google Scholar]
- 12.Chassagne P, Perol MB, Doucet J, et al. Is presentation of bacteremia in the elderly the same as in younger patients? Am J Med 1996;100:65–70. [DOI] [PubMed] [Google Scholar]
- 13.McNerlan SE, Alexander HD, Rea IM. Age-related reference intervals for lymphocyte subsets in whole blood of healthy individuals. Scand J Clin Lab Invest 1999;59:89–92. [DOI] [PubMed] [Google Scholar]
- 14.Bruunsgaard H, Pedersen AN, Schroll M, et al. Impaired production of proinflammatory cytokines in response to lipopolysaccharide (LPS) stimulation in elderly humans. Clin Exp Immunol 1999;118:235–41. [DOI] [PMC free article] [PubMed] [Google Scholar]
- 15.Zahorec R. Ratio of neutrophil to lymphocyte counts—rapid and simple parameter of systemic inflammation and stress in critically ill. Bratisl Lek Listy 2001;102:5–14. [PubMed] [Google Scholar]
- 16.Wong RS, Wu A, To KF, et al. Haematological manifestations in patients with severe acute respiratory syndrome: retrospective analysis. BMJ 2003;326:1358–62. [DOI] [PMC free article] [PubMed] [Google Scholar]
- 17.O’Donnell DR, Carrington D. Peripheral blood lymphopenia and neutrophilia in children with severe respiratory syncytial virus disease. Pediatr Pulmonol 2002;34:128–30. [DOI] [PubMed] [Google Scholar]
- 18.Okada H, Kobune F, Sato TA, et al. Extensive lymphopenia due to apoptosis of uninfected lymphocytes in acute measles patients. Arch Virol 2000;145:905–20. [DOI] [PubMed] [Google Scholar]
- 19.Unlinked Anonymous Surveys Steering Group. Prevalence of HIV and hepatitis infections in the United Kingdom. Report. London: Department on Health, 2001.
- 20.Ayala A, Lomas JL, Grutkoski PS, et al. Fas-ligand mediated apoptosis in severe sepsis and shock. Scand J Infect Dis 2003;35:593–600. [PubMed] [Google Scholar]
- 21.Joshi VD, Kalvakolanu DV, Cross AS. Simultaneous activation of apoptosis and inflammation in pathogenesis of septic shock: a hypothesis. FEBS Lett 2003;555:180–4. [DOI] [PubMed] [Google Scholar]
- 22.Coopersmith CM, Stromberg PE, Dunne WM, et al. Inhibition of intestinal epithelial apoptosis and survival in a murine model of pneumonia-induced sepsis. JAMA 2002;287:1716–21. [DOI] [PubMed] [Google Scholar]
- 23.Hotchkiss RS, Tinsley KW, Swanson PE, et al. Sepsis-induced apoptosis causes progressive profound depletion of B and CD4+ T lymphocytes in humans. J Immunol 2001;166:6952–63. [DOI] [PubMed] [Google Scholar]
- 24.Schroeder S, Lindemann C, Decker D, et al. Increased susceptibility to apoptosis in circulating lymphocytes of critically ill patients. Langenbecks Arch Surg 2001;386:42–6. [DOI] [PubMed] [Google Scholar]
- 25.Kemp K, Bruunsgaard H, Skinhoj P, et al. Pneumococcal infections in humans are associated with increased apoptosis and trafficking of type 1 cytokine-producing T cells. Infect Immun 2002;70:5019–25. [DOI] [PMC free article] [PubMed] [Google Scholar]
- 26.Roth G, Moser B, Krenn C, et al. Susceptibility to programmed cell death in T-lymphocytes from septic patients: a mechanism for lymphopenia and Th2 predominance. Biochem Biophys Res Commun 2003;308:840–6. [DOI] [PubMed] [Google Scholar]
- 27.Hotchkiss RS, Tinsley KW, Swanson PE, et al. Prevention of lymphocyte cell death in sepsis improves survival in mice. Proc Natl Acad Sci USA 1999;96:14541–6. [DOI] [PMC free article] [PubMed] [Google Scholar]
- 28.Hotchkiss RS, Chang KC, Swanson PE, et al. Caspase inhibitors improve survival in sepsis: a critical role of the lymphocyte. Nat Immunol 2000;1:496–501. [DOI] [PubMed] [Google Scholar]
- 29.Du Clos TW. Function of C-reactive protein. Ann Med 2000;32:274–8. [DOI] [PubMed] [Google Scholar]
- 30.Whicher J, Bienvenu J, Monneret G. Procalcitonin as an acute phase marker. Ann Clin Biochem 2001;38:483–93. [DOI] [PubMed] [Google Scholar]


