

Abstract
Aims: To compare the results of breast cancer sections with HercepTest™ immunohistochemistry (IHC) scores ranging from 0 to 3+ with fluorescence in situ hybridisation (FISH) for HER2 amplification. The HER2 digital scoring application of the Micrometastasis Detection System (MDS™) was used, together with manual scoring of FISH and HercepTest, to determine whether this system provides an accurate alternative.
Methods: Paraffin wax embedded sections were stained using HercepTest and analysed by eye and automated quantitative image analysis. FISH was performed using the PathVysion™ fluorescent probe and scored by eye and automated quantitative image analysis using MDS.
Results: Of 114 cases, 26% were amplified by FISH, whereas only 18% scored 3+; 32% of IHC 2+ cases were amplified by FISH, and one showed borderline amplification. Six percent of IHC negative cases (0 or 1+) were amplified by FISH, and one showed borderline amplification. Of IHC 3+ cases, 10% were non-amplified by FISH. Classification discrepancies were seen in 18% of HercepTest cases scored by eye and using the MDS system. MDS was consistent with visual FISH scoring and correctly differentiated most ambiguous visual IHC scores.
Conclusions: FISH provides a more accurate and consistent scoring system for determining HER2 amplification than HercepTest. The MDS system provides a reliable, consistent alternative to visual IHC and FISH scoring. IHC is still a valuable technique to aid in identification of isolated or heterogeneous tumour populations for subsequent FISH analysis, and a combined FISH and HercepTest approach to all breast cancer cases may be the most efficient strategy.
Keywords: FISH, HER2, breast cancer, Herceptin, immunohistochemistry
The HER2/neu type 1 tyrosine kinase growth factor receptor gene and the 185 kDa protein that it encodes (P185 or erbB2) make an important contribution to the regulation of cell growth.1 The amplification of this gene is associated with many cancers, especially breast cancer, and results in a poor prognosis. Historically, testing for amplification of this gene has been performed using an immunohistochemical (IHC) staining technique, most often the HercepTest™ (Dako, Glostrup, Denmark). The technique involves antibody specific staining of the encoded protein on the cytoplasmic membrane. A darker stain indicates the presence of more protein and therefore, theoretically, gene amplification should be present. Stained tissue sections are categorised as: 0, no staining; 1+, light staining; 2+, equivocal moderate staining; 3+, dark membrane staining (fig 1). Patients with tumours showing a 3+ staining pattern may benefit from treatment with the drug Herceptin™. All patients are considered for conventional chemotherapy regardless of their HER2 status.
Figure 1.
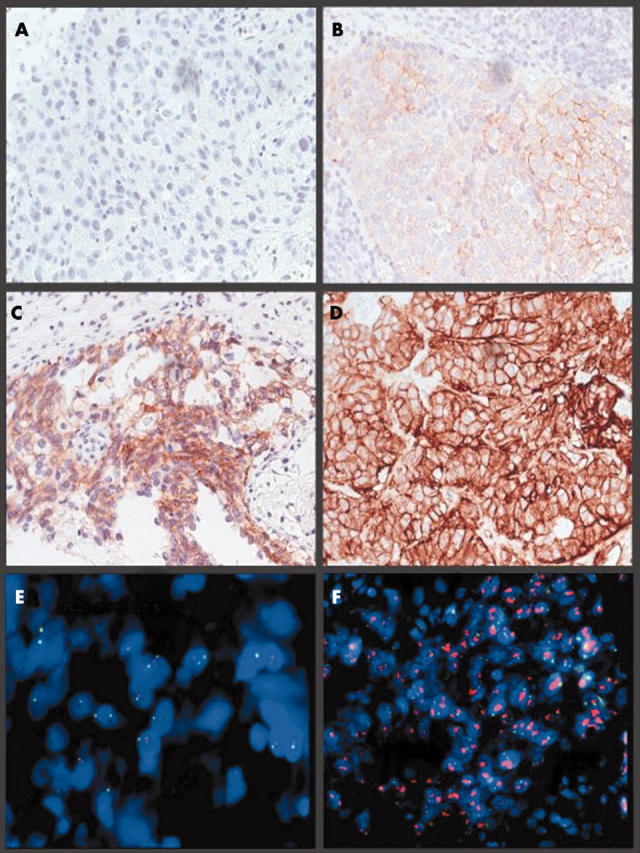
Images of invasive breast carcinoma captured on the MDS. (A–D) HercepTest immunohistochemical staining: (A) 0 (negative), (B) 1+, (C) 2+, and (D) 3+ (positive). (E, F) Fluorescence in situ hybridisation using the PathVysion probe. (E) A non-amplified ratio, (F) an amplified ratio.
“The current literature suggests that fluorescence in situ hybridisation is more accurate and easier to interpret than immunohistochemistry”
Directly labelled DNA fluorescence in situ hybridisation (FISH) probes, which identify HER2 gene amplification, are now available from several manufacturers (for example, Abbott-Vysis, Cancer Genetics, DakoCytomation, and QBioGene). The Food and Drug Association approved PathVysion™ (Abbot-Vysis, Abbot Park, Illinois, USA) probe is routinely used at Sheffield Genetics Services on all equivocal 2+ HercepTest cases as advised by current National Institute for Health and Clinical Excellence guidelines.2 This consists of two DNA labelled probes targeting the DNA of the chromosome 17 centromere (labelled with the fluorescent marker spectrum green) and a 190 kb region spanning the entire HER2 gene at 17q11.2–q12 (labelled with the fluorescent marker spectrum orange). The FISH test is extremely accurate because of the stability of the DNA target. The current literature suggests that FISH is more accurate and easier to interpret than IHC.3 It has also been reported that interobserver variation is low because FISH is a quantitative test.3
The HercepTest has been shown to give false negative results in up to 28% of HER2 FISH positive cases,3–6 perhaps as a result of the destruction of the HER2 epitope.7 False positive HercepTest results have been reported in up to 12% of cases.3,5,6 The HercepTest has also been shown to be susceptible to interobserver variation because it is a qualitative test.6 It has been suggested that IHC 3+ cases that are FISH negative may be explained by the overexpression of a single copy of the HER2 gene. However, in one study, the level of HER2 mRNA expression in discordant cases was analysed and found to refute this argument.8 It has also been shown that single gene overexpression is associated with a similar prognosis in patients who are both IHC and FISH HER2 negative.7
The accurate detection of HER2 amplification has now become extremely important in the treatment of breast cancer because HER2 targeted treatment is available with the recombinant humanised antibody, Trastuzumab™ (Herceptin™; Genentech, South San Francisco, California, USA).9 Furthermore, HER2 amplification has been associated with a negative response to widely used hormonal drugs, such as tamoxifen.10 FISH has also been shown to be more predictive than the HercepTest with regard to the response to Herceptin.11–14
In our study, automated image analysis was performed on 114 breast cancer samples using the HER2 digital scoring application of the Micrometastasis Detection System (MDS™; Applied Imaging, San Jose, California, USA).
METHODS
IHC
Paraffin wax embedded sections (4 μm thick) were mounted on X-tra™ (Surgipath Medical Industries, Richmond, Illinois, USA) slides and stained with HercepTest using DakoCytomation standard protocols.
FISH
Unless stated otherwise, procedures were performed at room temperature. Paraffin wax embedded sections (4 μm thick) mounted on X-tra slides were dewaxed for 2 × 10 minutes in 50 ml xylene at room temperature, dehydrated for five minutes in 50 ml ethanol, then washed for between 20 and 23 minutes in 50 ml of 0.2N HCl. The slides were then washed in 50 ml double distilled water (DDW) for two minutes and transferred to 50 ml Zymed (South San Francisco, California, USA) heat pretreatment solution at 95°C for 80 to 110 minutes. The slides were then washed in 50 ml of DDW for 2 × 3 minutes; 90 μl of Zymed digestion enzyme solution was then applied to a 22 × 50 coverslip and overlayed on to the slide. The slide was then incubated at 38°C in a wet box for 50 to 70 minutes. Slides were then washed in 50 ml DDW for 3 × 2 minutes before being dehydrated through a 50 ml ethanol series: 70%, 95%, and 100% for two minutes each. The slides were then left to dry before PathVysion probe application. The sample DNA and probe DNA were co-denatured at 72°C for five minutes and then allowed to hybridise at 37°C overnight on a PTC-200 thermal cycler (MJ Research, Waltham, Massachusetts, USA). The slides were then washed in 50 ml of 0.4× saline sodium citrate/Tween 20 at 73°C for two minutes and then transferred to 50 ml 2× saline sodium citrate/Tween 20 at room temperature for 30 seconds. Ethanol series dehydration was performed as before and the slides were air dried in darkness. The slides were coverslipped with 20 μl of counterstain (20 μl mounting medium with DAPI in 1000 μl mounting medium for fluorescence; Vector Laboratories, Burlingame, California, USA).
ANALYSIS
Processed IHC and FISH slides were analysed by eye using published recommendations for scoring.2
The MDS is a computer controlled scanning microscope with capture capabilities using either brightfield (for IHC) or fluorescence filter wheels (for FISH). Quantitative analysis of captured IHC or FISH images can be performed using this software. The HER2 digital scoring application developed for the MDS was used for scoring the HercepTest and for quantifying the HER2 FISH amplification ratio. For the HercepTest, positive and negative batch control slides are analysed to train the system for the range of staining intensity. An image from a suitable invasive tumour location is captured from each sample slide from a given batch. Using the stored batch control intensity range, an automatic analysis is then performed. This process takes less than two minutes for each slide.
For FISH, a representative invasive tumour location is captured using Z stacking. This is an automated focus ability that takes captures of several focal planes and then combines them into a single image. Automatic analysis for the presence of HER2 gene amplification using Applied Imaging protocols is then performed.
RESULTS
Of the 114 cases that we analysed 30 were found to be amplified by FISH (ratio of HER2/17cen > 2.2), giving an amplification rate of 26%. This correlates with the published range of 20–30% of all breast cancer cases.15 Borderline amplification by FISH is classified as an amplification ratio between 1.8 and 2.2. When scoring the HercepTest by eye, 72 cases were determined to be either 0 (negative) or 1+ (probably negative), 22 as 2+, and 20 as 3+ (positive). Table 1 shows the full breakdown of data by FISH and HercepTest.
Table 1.
Comparison of fluorescence in situ hybridisation (FISH) and HercepTest cases scored by eye (% of total cases; n = 114)
| HercepTest score | |||||
| Negative | 2+ | 3+ | Total | ||
| (0 or 1+) | |||||
| FISH negative | 66 (58%) | 14 (12%) | 2 (2%) | 82 (72%) | |
| FISH positive | 5 (4%) | 7 (6%) | 18 (16%) | 30 (26%) | |
| Borderline | 1 (1%) | 1 (1%) | 0 (0%) | 2 (2%) | |
| Total | 72 (63%) | 22 (19%) | 20 (18%) | ||
In two of the cases studied, two different tumour populations were seen in the same section. In each case, one minor tumour population was amplified by FISH and the other major tumour population was not amplified by FISH. In rare cases such as these the IHC slides provide a useful method of locating tumours. The IHC and FISH slides from a particular sample can be used in unison to facilitate the definition of separate tumour populations and to distinguish between invasive and ductal/lobular disease.
The IHC scoring facility on the MDS provides evidence for the accuracy of automated HercepTest scoring. When comparing HercepTest scores assessed by eye and MDS there was a difference in 21 (18%) of the 114 cases. All 14 IHC 2+ cases scored by eye were categorised by the MDS system as either 1+ or 3+, and 13 were also validated by FISH. Furthermore, of three 2+ cases scored by the MDS system and differentiated by eye, FISH validated the MDS in two cases. Table 2 shows the discrepancies seen when scoring the HercepTest and FISH by eye and with the MDS.
Table 2.
Discrepancies seen when scoring the HercepTest by eye or using the MDS system
| Sample | HercepTest score | FISH result | Comments | |
| By eye | MDS | |||
| a | 2 | 3 | Amplified | Would analyse by FISH routinely but MDS accurate |
| b | 2 | 1 | Non-amplified | MDS accurate |
| c | 0 | 1 | Amplified | 2 tumour populations seen: 1 amplified |
| d | 3 | 2 | Non-amplified | MDS accurate |
| e | 2 | 3 | Amplified | Would analyse by FISH routinely but MDS accurate |
| f | 2 | 1 | Non-amplified | MDS accurate |
| g | 2 | 1 | Non-amplified | MDS accurate |
| h | 2 | 1 | Non-amplified | MDS accurate |
| i | 3 | 3 | Non-amplified | HercepTest staining inaccurate |
| j | 3 | 3 | Non-amplified | HercepTest staining inaccurate |
| k | 2 | 1 | Non-amplified | MDS accurate |
| l | 2 | 1 | Non-amplified | MDS accurate |
| m | 2 | 1 | Non-amplified | MDS accurate |
| n | 2 | 1 | Amplified | MDS does not correspond to FISH |
| o | 1 | 2 | Non-amplified | MDS accurate |
| p | 2 | 1 | Non-amplified | MDS accurate |
| q | 2 | 3 | Amplified | Would analyse by FISH routinely but MDS accurate |
| r | 2 | 3 | Amplified | Would analyse by FISH routinely but MDS accurate |
| s | 1 | 2 | Amplified | MDS accurate. Would not analyse by FISH routinely |
| t | 2 | 1 | Non-amplified | MDS accurate |
| u | 1 | 3 | Amplified | 2 tumour populations seen: 1 amplified |
FISH, fluorescence in situ hybridisation; MDS, Micrometastasis Detection System.
Scoring of FISH on HER2 amplified cases using the MDS was highly consistent and much less variable than when scoring was performed by eye. However, on non-amplified FISH cases the MDS was slower, although it still retained its accuracy. Figure 2 shows the varying scores within amplified cases between human analysers and the MDS. The MDS scores were consistently lower than the visual scores, regardless of the analyser, but concordant FISH classification status was seen in every case.
Figure 2.

Comparison between the average of two human analysers and the MDS for 23 randomly selected samples when scoring amplification ratio by fluorescence in situ hybridisation.
DISCUSSION
There is evidence to support both the association between HER2 gene amplification and a positive response to the drug Trastuzumab, and the association between HER2 gene amplification and a negative response to drugs such as tamoxifen.9 The reverse scenario is equally concerning with regard to the potential side effects of Trastuzumab and the denial of conventional treatment. Therefore, appropriate prescription of these drugs is crucial in both human and financial terms.
The HercepTest false negative rate in our series was around 7% (percentage of 0 and 1+ cases; n = 72) when FISH was used as a secondary test. We also found that the HercepTest false positive rate was around 10% (percentage of 3+ cases; n = 20) when FISH was used as a secondary test. This confirms suggestions from previous data.
In our series, when using FISH, three more patients were eligible for treatment with Herceptin than might have been indicated by the HercepTest, and three patients were not eligible for treatment although the HercepTest found them positive. These HercepTest false negatives are not a reflection of the oversensitivity of the FISH test, but result from insensitivity of the IHC test, as illustrated by the accurate correlation with published data and the percentage of FISH amplified cases in total.
“In almost every case, immunohistochemical scoring by MDS agreed with the fluorescence in situ hybridisation result, suggesting that this method of scoring is more accurate than visual scoring”
The IHC scoring facility on the MDS is a quick, highly accurate, and consistent method of scoring immunoassays in breast cancer samples. It also allows the operator the option to archive images and to relocate back to regions of interest on the slide. We found discrepancies between the HercepTest scored either visually or by the MDS system, and three cases (d, o, and s in table 2) would have been processed by FISH to confirm whether or not amplification exists. The MDS system provides a consistent scoring tool, which shows high levels of accuracy and is a time saving alternative to scoring by eye. In almost every case, IHC scoring by MDS agreed with the FISH result, suggesting that this method of scoring is more accurate than visual scoring. The three cases that showed discordance with FISH (i, j, and n in table 2) can be explained by either an increased copy number of chromosome 17 and hence a 3+ staining pattern but a non-amplified ratio, or a breakdown of the protein product.
Scoring HER2 FISH with the MDS appears to be useful when scoring amplified and borderline cases. Again, the system can relocate to a region previously captured and allows archiving of cases for future reference and study. It also provides an analysis of the data. The results obtained are more consistent than when scored by eye, which is especially important when scoring borderline, ambiguous cases. When analysing amplified cases, the level of hybridisation to the HER2 gene must be counted by eye and in some cases only an estimate can be made because the probe signals cluster closely together (fig 1F). The Z stacking auto focus facility of the MDS allows the software to count the number of HER2 copies accurately.
With regard to FISH, the MDS system relies on a good digestion in the experimental preparation to define an individual cell for scoring. There also appear to be problems capturing small non-amplified cells because the software is designed to screen out smaller non-neoplastic cells. Therefore, in these cases it is much quicker for two scientists to score and check by eye than it is to score on the MDS.
The most important thing that can be learnt from our study is that FISH provides a more accurate and consistent scoring system for determining HER2 amplification than the HercepTest. However, it has been suggested that FISH is a more expensive and time consuming test. One recent study has now disputed this and has shown that the use of FISH alone is more cost effective than either the use of IHC alone or a combination of IHC and FISH.16
IHC staining still remains a valuable aid in the identification of isolated or heterogeneous tumour populations for subsequent FISH analysis. The use of the MDS has shown that the accuracy and consistency of an automated quantitative image analysis system enhances a strategy using a combined FISH and IHC approach on all breast cancer cases. This may be the most efficient, if not the most cost effective, strategy.
Take home messages.
Fluorescence in situ hybridisation (FISH) provides a more accurate and consistent scoring system for determining HER2 amplification than immunohistochemistry (IHC) using the HercepTest
In general, the MDS system is more reliable and more consistent than visual IHC and FISH scoring methods
IHC is still a valuable technique to aid in the identification of isolated or heterogeneous tumour populations for subsequent FISH analysis, and a combined FISH and HercepTest approach to all breast cancer cases may be the most efficient strategy
Acknowledgments
Thanks to Westfield Healthcare for donating the automated MDS system, South Yorkshire Workforce Development Confederation for supporting the project, D Walker (Sheffield Genetics Services) for providing analytical support, and T Sanderson (Sheffield Northern General Histopathology Laboratory) for performing all the IHC staining work.
Abbreviations
DDW, double distilled water
FISH, fluorescence in situ hybridisation
IHC, immunohistochemistry
MDS, Micrometastasis Detection System
REFERENCES
- 1.Jones FE, Stern DF. Expression of dominant-negative ErbB2 in the mammary gland of transgenic mice reveals a role in lobuloalveolar development. Oncogene 1999;18:3481–90. [DOI] [PubMed] [Google Scholar]
- 2.Ellis IO, Bartlett J, Dowsett M, et al. Updated recommendations for HER2 testing in the UK. J Clin Pathol 2004;57:233–7. [DOI] [PMC free article] [PubMed] [Google Scholar]
- 3.Bartlett JM, Going JJ, Mallon EA, et al. Evaluating HER2 amplification and over expression in breast cancer. J Pathol 2001;195:422–8. [DOI] [PubMed] [Google Scholar]
- 4.Cianciulli AM, Botti C, Coletta AM, et al. Contribution of fluorescence in situ hybridization to immunohistochemistry for the evaluation of HER-2 in breast cancer. Cancer Genet Cytogenet 2002;133:66–71. [DOI] [PubMed] [Google Scholar]
- 5.Hammock L, Lewis M, Phillips C, et al. Strong HER-2/neu protein over expression by immunohistochemistry often does not predict oncogene amplification by fluorescence in situ hybridization. Hum Pathol 2003;34:1043–7. [DOI] [PubMed] [Google Scholar]
- 6.Thomson TA, Hayes M, Spinelli JJ, et al. HER-2/neu in breast cancer: interobserver variability and performance of immunohistochemistry with 4 antibodies compared with fluorescent in situ hybridization. Mod Pathol 2001;14:1079–86. [DOI] [PubMed] [Google Scholar]
- 7.Pauletti G, Dandekar S, Rong H, et al. Assessment of methods for tissue-based detection of the HER-2/neu alteration in human breast cancer: a direct comparison of fluorescence in situ hybridization and immunohistochemistry. J Clin Oncol 2000;18:3651–64. [DOI] [PubMed] [Google Scholar]
- 8.Tubbs RR, Pettay JD, Roche PC, et al. Discrepancies in clinical laboratory testing of eligibility for Trastuzumab therapy: apparent immunohistological false positives do not get the message. J Clin Oncol 2001;19:2714–21. [DOI] [PubMed] [Google Scholar]
- 9.Lewis F, Jackson P, Lane S, et al. Testing for HER2 in breast cancer. Histopathology 2004;45:207–17. [DOI] [PubMed] [Google Scholar]
- 10.Muss HB, Thor AD, Berry DA, et al. c-erbB2 expression and response to adjuvant therapy in women with node-positive early breast cancer. N Engl J Med 1994;330:1260–6. [DOI] [PubMed] [Google Scholar]
- 11.Mass R, Sanders C, Kasian C, et al. The concordance between the clinical trials assay (CTA) and fluorescence in situ hybridization (FISH) in the Herceptin clinical trials [abstract]. Proc Am Soc Clin Oncol 2000;19:75a. [Google Scholar]
- 12.Mass RD, Press M, Anderson S, et al. Improved survival benefit from herceptin (trastuzumab) in patients selected by fluorescence in situ hybridization [abstract]. Proc Am Soc Clin Oncol 2001;20:22a. [Google Scholar]
- 13.Press MF, Slamon D, Cobleigh M, et al. Improved clinical outcomes for herceptin treated patients selected by fluorescence in situ hybridization (FISH) [abstract]. Lab Invest 2002;82:47a.11796825 [Google Scholar]
- 14.Vogel CL, Cobleigh MA, Tripathy D, et al. Efficacy and safety of Trastuzumab as a single agent in first line treatment of HER2 overexpressing metastatic breast cancer. J Clin Oncol 2002;20:719–26. [DOI] [PubMed] [Google Scholar]
- 15.Slamon DJ, Godolphin W, Jones LA, et al. Studies of the HER-2/neu proto-oncogene in human breast and ovarian cancer. Science 1989;244:707–12. [DOI] [PubMed] [Google Scholar]
- 16.Elkin EB, Weinstein MC, Winer EP, et al. HER-2 testing and Trastuzumab therapy for metastatic breast cancer: a cost-effectiveness analysis. J Clin Oncol 2004;22:854–63. [DOI] [PubMed] [Google Scholar]