

Abstract
Background: The mitogenic kinin peptides formed by the serine protease, tissue kallikrein (TK1), stimulate the proliferation of tumour cells and, by increasing vascular permeability, enhance metastasis. Oesophageal mucosal epithelial cells are derived from the epithelial cell germ layer, which expresses the kallikrein–kinin cascade.
Aim: To determine the cellular distribution of active TK1, prokallikrein, and the kinin B1 and B2 receptors in oesophageal carcinoma by immunocytochemistry and in situ hybridisation (ISH).
Methods: Fifty oesophageal specimens (33 biopsies and 17 resections) and 10 control specimens adjacent to tumour or normal oesophageal biopsies were studied. Specific antibodies were used to determine the cellular localisation of TK1, prokallikrein, and the kinin B1 and B2 receptors in normal and oesophageal specimens by standard immunohistochemical techniques. The intensity of immunolabelling was quantified by image analysis. Antisense probes for TK1 and the kinin B1 and B2 receptors were also used to localise mRNA.
Results: TK1 (active and prokallikrein) was expressed in the mucosa of normal and tumour oesophageal epithelium. In general, expression was highest in activated mast cells, followed by giant tumour cells. Immunolabelling results were confirmed by ISH experiments.
Conclusions: This is the first demonstration that TK1 and kinin B1 and B2 receptors are expressed in oesophageal carcinoma. Because TK1 released from tumour cells enzymatically generates mitogenic kinins from its endogenous substrate, kininogen, it is possible that third generation kinin receptor antagonists, which have been shown to be cytotoxic to cancer cells, may be useful therapeutic agents in this disease.
Keywords: tissue kallikrein, kinin B1and B2 receptors, oesophageal carcinoma, tissue prokallikrein, mast cells, giant tumour cells, kinins
Kallikreins are a group of serine proteases expressed in epithelial cells and neutrophils1 that result in the release of the vasoactive peptides, kinins, from endogenous substrates called kininogens. Enzymes that form kinins are known as kininogenases.1 Expression of tissue kallikrein (TK1) has been determined mainly in epithelial cells,2 and has recently been linked to tumorigenesis. The mitogenic kinin peptides formed by TK1 stimulate the proliferation of tumour cells and, by increasing vascular permeability, enhance metastasis.3,4 The increased kinin receptor expression seen as a result of oncogenic transformation4 supports the notion that kinins play a mitogenic role in tumour tissue.5,6 Therefore, it is thought that TK1 may be implicated in the process of tumorigenesis, both as a serine protease and through the mitogenic and cellular actions of the kinin peptides.
“The mitogenic kinin peptides formed by tissue kallikrein stimulate the proliferation of tumour cells and, by increasing vascular permeability, enhance metastasis”
Proteinases such as serine proteases are secreted by cancer cells, and are thought to participate in the proteolytic cascade that triggers the invasion of malignant cells into normal tissue.7 However, hydrolysis of extracellular matrix is a necessary step for the migration of malignant cells into functionally normal adjacent tissue.8 Proteinases that show high activity in malignant tumour homogenates may be related to degradation of the surrounding cell matrix. However, a role for TK1 in this regard is still unclear.
Oesophageal carcinoma is the sixth most common cancer in the world and is highly lethal.9 Cancer of the oesophagus is the second most important cancer in South African men and the most important cancer in South African Black men. Mucosal epithelial cells of the oesophagus are embryologically derived from the germ layer of epithelial cells, which express the proteins of the kallikrein–kinin cascade. Our current study demonstrates increased expression of TK1 and kinin receptors in oesophageal carcinoma, and provides insights into a possible role for this enzyme and its receptors in cancer.
METHODS
Ethical permission
Ethical permission was obtained from the human ethics committee of the University of Natal, Durban, South Africa.
Sample collection
Resections
Resection specimens of oesophageal carcinoma were collected on ice from the surgical theatres at King George V Hospital, Durban, South Africa, after oesophagectomy, and processed immediately. Tissue for RNA extraction was snap frozen in liquid nitrogen, and then transferred to an ultralow freezer until use.
Biopsies
Biopsy specimens of oesophageal carcinoma were collected at King George V Hospital on ice, and immediately fixed in 5% formaldehyde/0.9% saline (vol/vol). Tissues were then paraffin wax embedded and stored at room temperature for future microscopical and immunohistochemical studies.
Antibody profiles
Anti-recombinant TK1 antibody
Recombinant human TK1 (rTK1) was obtained from Dr M Kemme (Institute for Biochemistry, Technical University of Darmstadt, Germany). The antibody to rTK1 detects both the active and proform of the enzyme. On immunoblotting, a single band is seen with rTK1 but no reaction is seen with plasma kallikrein.10
Anti-tissue prokallikrein (TProK) antibody
To generate a specific antibody that detected only the proform of TK1, the peptide Cys-Ala1-Pro-Pro-Ile-Gln-Ser-Arg7-Ile-Val-Gly10 (CAP 11) covering the N-terminal residues of TProK, namely the first seven residues of the peptide (Ala1 to Arg7), followed by the first residues (Ile8 to Val10) of the mature enzyme was synthesised.11 An additional Cys residue was introduced at the N-terminus of the synthesised peptide for coupling of the peptide to the carrier protein, key hole limpet haemocyanin. The antibody to CAP 11 specifically reacted with TProK.11
Anti-B1 receptor antibody
F Hess (Merck Research Laboratories, Rahway, New Jersey, USA) kindly supplied an antibody directed at the C-terminus peptide of the kinin B1 receptor (Ile-Ser-Ser-Ser-His-Arg-Lys-Glu-Ile-(Phe-Gln-Leu)-Phe-Trp-Arg-Asn), which was characterised for specificity.
Anti-B2 receptor antibody
Eight polyclonal antipeptide antibodies to the transmembrane loop of the receptor (fully characterised for specificity) were raised against synthetic peptides of the N-terminal and loop regions encoded by rat B2 receptor cDNA, which shows homology with the human receptor at these regions. The antibodies were kindly donated by W Muller-Esterl (University of Mainz, Germany). The antibodies were fully characterised for specificity.12
Histopathology
Haematoxylin and eosin staining of wax embedded tissue
Sections, approximately 3–5 μm thick, of the paraffin wax embedded tissue were cut and adhered on to poly-L-lysine coated slides. The sections were stained with haematoxylin and eosin to determine the histological diagnosis of the resection and biopsy specimens.
Immunocytochemistry
Resection and biopsy specimens were processed for the cellular localisation of TK1, TProK, and the kinin receptors.
Tissue fixation and wax embedding for conventional light and confocal microscopy
Fresh tissue (approximately 0.5 cm3) from resection and biopsy specimens was fixed in 5% formal saline (35% formaldehyde/0.9% NaCl; 1/7 vol/vol) for 24 hours. Sections of approximately 5 mm thickness were orientated and embedded in paraffin wax.
Immunolocalisation
Paraffin wax embedded sections were dewaxed and boiled in 0.1M sodium citrate, pH 6.0, in a microwave oven (Sharp R-4A52) at high power for three minutes and at low power for five minutes for antigen retrieval, then allowed to cool for 20 minutes at room temperature. Endogenous peroxidase was inactivated by incubating with 5% H2O2 in absolute methanol for 30 minutes. Next, sections were incubated with digoxygenin (DIG) blocking agent (DIG wash and blocker set; Boehringer, Mannheim, Germany) for 30 minutes at room temperature to prevent non-specific binding. After this, sections were probed for the presence of immunoreactive TK1, TProK, and kinin B1 and B2 kinin receptors using specific antibodies. After overnight incubation at 4°C, the sections were thoroughly washed and incubated with biotinylated secondary antibody, followed by streptavidin–peroxidase complex (Dako LSAB kit peroxidase; Dako Corporation, Carpenteria, California, USA). The enzyme–substrate reaction was detected by the chromogen, diaminobenzidine (DAB). After immunostaining, tissue sections were lightly counterstained with Harris haematoxylin, dehydrated, and mounted in Entellan (Merck, Darmstadt, Germany). As a control, primary antibody was preabsorbed with an excess of antigen.
Immunolocalisation
After blocking non-specific binding with DIG blocker for 30 minutes at room temperature, tissue was probed with primary specific antibodies against TK1, TProK, and kinins B1 and B2 and incubated at 4°C overnight. After jet washing, tissue was incubated with a fluorescein isothiocyanate conjugated secondary antibody diluted 1/32 for one hour at room temperature. Slides were mounted with fluorescent mounting medium, viewed under a Leica TCS TD-4-true confocal microscope, the number of pixels counted, and fluorescence staining intensity determined for each image.
Positive controls
Because TK1 and the B2 receptor are abundant in the duct cells of human salivary glands, and TProK is found in the tubules, samples of fresh normal human salivary gland were collected at necropsy, fixed in 5% formaldehyde/0.9% NaCl (vol/vol) and embedded in paraffin wax. During each labelling run, TK1 and the B2 receptor were demonstrated in the ducts and TProK in the tubules of the human salivary gland.11,12 The B1 receptor is abundant in neurones of the human spinal cord and therefore fresh normal spinal cord samples were collected at necropsy, fixed in 5% formadehyde/0.9% NaCl, and embedded in paraffin wax. During each labelling run, the B1 receptor was demonstrated in the neurones of the human spinal cord.
Negative controls
Loss of immunolabelling after preabsorbtion of the primary antibody with an excess of human urinary kallikrein (HUK) demonstrated the specificity of the antibody used. The goat anti-human anti-rTK1 antibody was diluted 1/2500 with 1mM phosphate buffered saline, pH 7.2 (PBS), and 25 μl was added to 200 μl of 5 μg/ml HUK and 175 μl of PBS to yield a final concentration of 2.5 ng antibody (anti-human rTK1)/ml and 2.5 μg antigen (HUK)/ml. This was vortexed and incubated for approximately 36 hours at 4°C to allow the formation of antigen antibody complexes. After centrifugation at 13 000 ×g for 15 minutes at 4°C (Biofuge 13R; Heraeus, Germany) 100 μl of the supernatant replaced the primary antibody in the immunolocalisation procedure. For the negative controls of the kinin receptor antibodies, primary antibodies were replaced with non-immune serum or PBS.13
In situ hybridisation
Probes specific to the genes encoding TK1 (KLK1) and the kinin B1 and B2 receptors were polymerase chain reaction (PCR) amplified and cloned into pGEM-T easy vectors using gene specific primers. The cloned product was sequenced and screened against the GENBANK database (NCBI) to verify the identity and orientation of KLK1 and the kinin B1 and B2 receptor genes within the vector. Antisense and sense probes were then generated using T7 or SP6 RNA polymerase (Roche Diagnostics, Mannheim, Germany) after digestion with either Pst1 or Apa1, respectively. Formalin fixed, paraffin wax blocks of tissue from two benign samples and 20 oesophageal cancer samples were sectioned (4 µm), dewaxed, rehydrated, and pretreated for in situ hybridisation. Hybridisation was performed with DIG labelled cDNA probes overnight at 50°C. After hybridisation, sections were washed in 2× saline sodium citrate (SSC) and 4× SSC at 50°C, then 0.5× SSC and 0.1× SSC at room temperature. Sections were blocked in 10% (wt/vol) blocking reagent (Roche Diagnostics), then incubated for two hours with anti-DIG alkaline phosphatase conjugated antibody (1/500 dilution; Roche Diagnostics). Probes were visualised with 5-bromo-4-chloro-3-indolyl phosphate/nitroblue tetrazolium (Roche Diagnostics), counterstained with haematoxylin (Sigma), and mounted with aqueous mounting medium (Separation Scientific, Johannesburg, South Africa).
Fluorescence detection
After the blocking step, the slides were incubated with anti-DIG conjugated to FITC (Roche Diagnostics). Probes and slides were then mounted with SlowFade® Light Antifade (Molecular Probes, Eugene, Oregon, USA) and viewed with a fluorescent microscope using a 490 nm wavelength filter.
Image analysis
Images were generated from DAB stained sections of biopsies and resection specimens from normal tissues and tumours. The sections were viewed in a Nikon Optiphot microscope (Nikon, Tokyo, Japan), which was interphased to a three CCD digital camera system (Sony Corporation, Tokyo, Japan). The quantitative image analyser used to determine the labelling intensity of DAB immunolocalisation was the Kontron Elektronic KS 300 (Zeiss GmbH, Hamburg, Germany), running on Windows 95. The pixel density for these 24 bit true colour images was 768 × 582. For image analysis, the images were converted to 8 bit false colour images with a pixel density of 225 × 225 pixels, expressed as a grey scale that ranged from 0 to 256, and divided into eight equal phases (POLI Look-Up-Table), with each phase having a lower and upper threshold value on the grey scale (table 1). Pixels with a grey scale value between 156 and 256 were thought to indicate high immunolabelling intensity.
Table 1.
POLI Look-Up-Table showing upper and lower threshold values on the grey scale
| Grey values for the 8 grey scale values | Representative immunolabelling intensity |
| (8) 221–253 | |
| (7) 188–220 | High |
| (6) 155–187 | |
| (5) 122–154 | Medium |
| (4) 89–121 | |
| (3) 56–88 | Low |
| (2) 33–55 | |
| (1) 0–32 | Zero immunolabelling |
The amount of immunolabelled antigen was estimated by analysis of the computer generated images. Using the Analysis 2.1 Pro system (Soft-Imaging Software GmbH, 1996, Munster, Germany) the regions of interest in each image were encircled. Within these areas, the numbers of pixels falling within each phase and the area analysed were established. These data, exported to Microsoft Excel were computed to give an indication of the relative intensity of immunolabelling in (n) number of circled areas, by calculating the mean value of the grey scale range 155–256, using the unit pixel ×104/μm2. The mean high intensity immunolabelling in (n) number of cells was quantified in pixels/μm2 using the Analysis 2.1 Pro-System (Soft-Imaging Software GmbH).
RESULTS
Figure 1 shows the protein components of the kallikrein–kinin cascade visualised using specific antibodies. Figures 2 and 3 illustrate the intensity of labelling for TK1 and TProK, respectively. The CAP 11 (anti-TProK) antibody specifically labels the proenzyme only and anti-rTK1 labels the mature enzyme (the active and proenzyme, the whole molecule). Therefore, it is possible to compute from the respective immunolabels, expressed as pixels/m2, the amount of label that denotes active TK1 (table 2). The highest intensity of immunolabelling was seen in the duct cells of the human salivary gland (positive control), followed by the mast cells and giant cells of the tumours for both forms of the enzyme, albeit with different staining intensities. Similarly, both showed stronger staining in normal compared with tumour epithelium—a finding that was seen consistently in all of the experiments. Figures 4 and 5 show the intensity of labelling for the kinin B1 and B2 receptors, respectively. Qualitatively, the immunolabelling profiles of kinin B1 and B2 were similar to that of tissue kallikrein (figs 6 , 7). Figure 7 shows the images for the TK1 kinin B1 and B2 receptors, and table 3 shows the pixel values. These results are confirmed by table 4.
Figure 1.
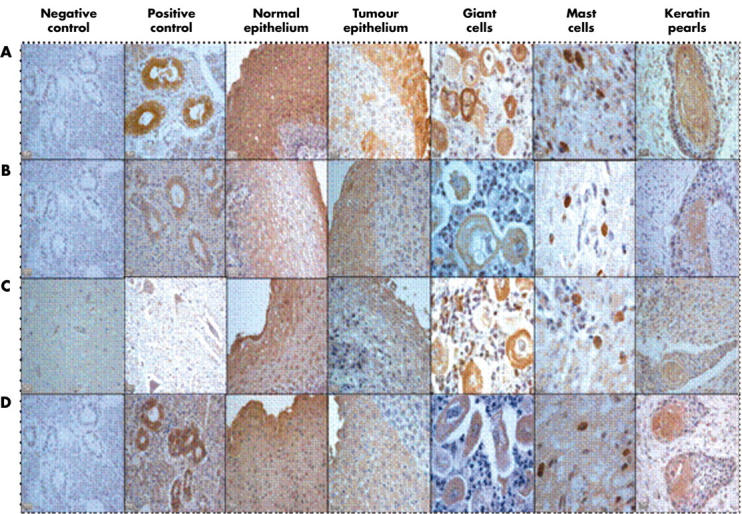
Immunohistochemical staining for tissue kallikrein (active and prokallikrein) and the kinin B1 and B2 receptors in oesophageal carcinoma. (A) Tissue kallikrein, (B) tissue prokallikrein, (C) kinin B1 receptor, and (D) kinin B2 receptor. The positive control for tissue kallikrein, tissue prokallikrein, and kinin B2 receptor is the salivary gland, whereas the positive control for the kinin B1 receptor is the spinal cord.
Figure 2.

Diaminobenzidine immunolabelling intensity for tissue kallikrein in normal and tumour tissue (mean of the grey scale values 155–256). The bars indicate the SEM; n = 8.
Figure 3.

Diaminobenzidine immunolabelling intensity for tissue prokallikrein in normal and tumour tissue (mean of the grey scale values 155–256). The bars indicate the SEM; n = 8.
Table 2.
Diaminobenzidine immunolabelling intensity (pixels ×104/µm2) of tissue kallikrein
| TK | TpK | TK−TpK | Active TK (%) | |
| Negative control | 162 | 150 | 12 | 7 |
| Positive control | 7165 | 768 | 6393 | 89 |
| Normal epithelium | 913 | 409 | 504 | 55 |
| Tumour epithelium | 587 | 279 | 308 | 52 |
| Giant cells in tumours | 1088 | 1031 | 57 | 5 |
| Mast cells in tumours | 1373 | 1225 | 148 | 10 |
| Keratin pearls | 220 | 200 | 20 | 9 |
Mean of the grey scale values 155–256.
TK, tissue kallikrein; TProK, tissue prokallikrein.
Figure 4.

Diaminobenzidine immunolabelling intensity for the kinin B1 receptor in normal and tumour tissue (mean of the grey scale values 155–256). The bars indicate the SEM; n = 8.
Figure 5.

Diaminobenzidine immunolabelling intensity for kinin B2 receptor in normal and tumour tissue (mean of the grey scale values 155–256). The bars indicate the SEM; n = 8.
Figure 6.
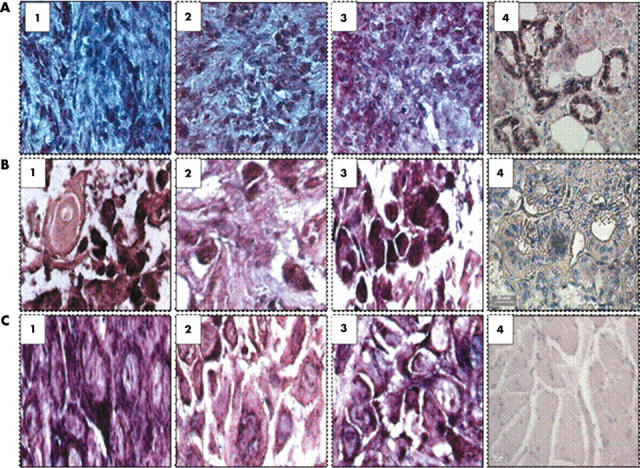
Images of in situ hybridisation using probes for tissue kallikrein (TK1) and the kinin B1 and B2 receptor mRNA in oesophageal carcinoma inflammatory cells, mast cells, and giant cells. (A1–3) TK1, kinin B1 receptor, and kinin B2 receptor localised to neutrophils. (A4) Positive control (salivary gland) probed with the KLK1 antisense probe. (B1–3). TK1, kinin B1 receptor, and B2 receptor localised to mast cells. (B4) Negative control (salivary gland probed with KLK1 sense probe). (C1–3) TK1, kinin B1 receptor, and B2 receptor localised to giant cells. (C4) Normal oesophageal smooth muscle control probed with the KLK1 antisense probe.
Figure 7.

Fluorescent images of in situ hybridisation using probes to the kinin B1 receptor, B2 receptor, and tissue kallikrein (TK1) mRNA in oesophageal carcinoma inflammatory, mast, and giant cells. Kinin B1 receptor, B2 receptor, and TK1 mRNA localised to (A) plasma cells, (B) neutrophils, (C) islands of well differentiated squamous cell carcinoma, (D) mast cells, and (E) bizarre giant cells.
Table 3.
Diaminobenzidine immunolabelling intensity (pixels ×104/µm2) of the kinin receptors
| KB1 | KB2 | KB1/KB2 (%) | |
| Negative control | 198 | 483 | 40 |
| Positive control | 516 | 1099 | 41 |
| Normal epithelium | 444 | 467 | 95 |
| Tumour epithelium | 419 | 282 | 148 |
| Giant cells in tumours | 890 | 651 | 137 |
| Mast cells in tumours | 1344 | 1307 | 102 |
| Keratin pearls | 862 | 388 | 228 |
Mean of the grey scale values 155–256.
KB1/2, kinin B1/2 receptor.
Table 4.
Kinin B1 receptor, kinin B2 receptor, TK1, and TProK statistics
| Negative control | Positive control | Normal epithelium | Tumour epithelium | Giant cells | Mast cells | Keratin pearls | |
| Kinin B1 receptor | |||||||
| N | 8 | 4 | 8 | 10 | 9 | 7 | 2 |
| Maximum | 531 | 1009 | 923 | 534 | 1301 | 1456 | 865 |
| Minimum | 57 | 298 | 312 | 289 | 425 | 1187 | 858 |
| Mean | 138 | 516 | 444 | 419 | 890 | 1344 | 862 |
| SEM | 53.21 | 169.50 | 77.5 | 27.67 | 110.33 | 33.85 | 3.57 |
| Kinin B2 receptor | |||||||
| N | 10 | 7 | 9 | 6 | 7 | 13 | 2 |
| Maximum | 839 | 1236 | 708 | 338 | 953 | 1425 | 521 |
| Minimum | 211 | 807 | 314 | 229 | 329 | 1020 | 255 |
| Mean | 439 | 1099 | 487 | 282 | 651 | 1307 | 388 |
| SEM | 55.63 | 55.77 | 45.00 | 18.33 | 98.46 | 35 | 134.29 |
| TK1 | |||||||
| N | 10 | 3 | 10 | 5 | 13 | 8 | 2 |
| Maximum | 590 | 18915 | 1169 | 924 | 1421 | 1481 | 865 |
| Minimum | 8 | 1254 | 658 | 441 | 54 | 1267 | 858 |
| Mean | 162 | 7165 | 913 | 587 | 1088 | 1373 | 862 |
| SEM | 61.56 | 166.67 | 49.38 | 88.64 | 123 | 25 | 3.6 |
| TProK | |||||||
| N | 10 | 6 | 8 | 6 | 13 | 9 | 1 |
| Maximum | 953 | 862 | 560 | 346 | 1368 | 1400 | 220 |
| Minimum | 32 | 650 | 326 | 208 | 545 | 901 | 220 |
| Mean | 281 | 768 | 409 | 273 | 1031 | 1225 | 220 |
| SEM | 96.56 | 32.68 | 25 | 25 | 63.33 | 59.62 | 0 |
TK1, tissue kallikrein; TProK, tissue prokallikrein.
DISCUSSION
Squamous cell carcinoma is the predominant histological type of oesophageal cancer world wide.14,15 There are at least three histological grades of this tumour, namely: well, moderately, and poorly differentiated. Of these, the moderately differentiated form was the most prevalent in our study. Adenocarcinoma and adenosquamous carcinoma occurred in very few patients. Of the tumours examined, only one specimen was that of a smooth muscle carcinoma that comprised bizarre tumour giant cells infiltrating the smooth muscle layer. Intercellular bridges of keratin pearls known to occur in differentiated tumours of the cervix, endometrium, and bladder were also seen in these oesophageal carcinoma samples.
In normal tissue, TK1 immunolabelling was seen only in the epithelial layer of the submucosa, and not in the basal epithelium. In the tumour epithelium, both forms of the enzyme were seen, primarily in pleomorphic cells of the upper epithelium. However, the reduced intensity of labelling compared with normal cells suggests that these cells lose the capacity to transcribe the proenzyme. Giant cell carcinomas are mostly poorly differentiated and are characterised by bizarre, degenerating giant tumour cells that infiltrate the muscular tissue. The dominance of giant cells is indicative of an aggressive tumour with a relatively poor prognosis,16 as was the case here.
Very intense labelling was seen in activated mast cells (verified by the Giemsa stain). This unique finding of intense labelling of mast cells by the specific antibodies to active TK1, TProK, and the kinin receptors is the first indication of a possible role for the kallikrein–kinin cascade in carcinogenic angiogenesis. Mast cell infiltration is thought to cause prominent proliferation of capillaries (angiogenesis) and venules, probably initiated by release of the angiogenic factor, vascular endothelial growth factor, which enhances the expansive progression of tumours.17–19
Mast cells play a dual role, one of which is to secrete mediators during degranulation that are mitogenic and lead to diapedesis of cancer cells.20 The expression of TK1 and TProK in mast cells, and the induction of the kallikrein gene in tumour cells may be important in the infiltration and metastatic progression of oesophageal cancer. It has been reported that there is a distinct association between the intensification of neoangiogenesis at the tumour periphery and increased numbers of mast cells.21 There is much evidence that angiogenesis is related to mast cell function. Mast cells accumulate in many angiogenesis dependent situations, including tumour growth, wound healing, and tissue repair. Several mast cell mediators are angiogenic and regulate endothelial cell proliferation and function. Stem cell factor, vascular endothelial growth factor, epidermal growth factor, basic fibroblast growth factor, and platelet derived growth factor induce chemotactic migration of mast cells to the sites of neovascularisation. Mast cell products such as the proteolytic enzyme tryptase also degrade connective tissue matrix to provide space for neovascular sprouts.17 Mast cell infiltration is thought to correlate with poor prognosis in certain cancers. However, recent evidence suggests that mast cells may also participate in immune surveillance against cancer cells by triggering caspase independent apoptosis via a cell surface molecule, consistent with a role for mast cells as antitumour effector cells.22
Recent studies have suggested the possibility of increased TK1 expression in cancer, arising from the induction of one or more of the kallikrein genes.23,24 TK1 has been localised in gastric carcinomas,25 Lewis lung tumours,26 ductal breast cancer cells,27 and pituitary prolactin secreting adenomas.28 Embryologically, the cells involved in these cancers are derived from the endoderm, and share a common cellular ancestry with oesophageal carcinoma cells. In agreement with this concept is our localisation of TK1 and TProK to oesophageal carcinoma.
In addition, TK1 is expressed in prostate and endometrial cancers.27 Two other kallikrein genes are expressed in the prostate: KLK2 and KLK3 (prostate specific antigen).28 Recently, it has been reported that KLK2 is expressed in prostate cancer, and that its expression is incrementally increased from benign epithelium to high grade prostatic intraepithelial neoplasia. Expression of KLK2 indicates that the protein it encodes is both prostate localised and tumour associated.29 Although our study indicates that the TK1 protein is expressed in oesophageal tumours, we still need to establish whether cancer cells release the enzyme into the interstitium to form mitogenic kinins. The kallikrein gene family is large and has at least 15 genes.2,30 Conceptual support for the presence of active TK1 in oesophageal carcinoma is derived from the detection by sensitive and specific enzyme linked immunosorbent assay of each of these kallikreins, namely hK8,31 hK7,32 hK5,33 and hK13,34 in the serum and in tissues, with the oesophagus having one of the highest concentrations. It has also been reported that this assay detects the free forms of kallikrein in the circulation. Raised concentrations of circulating TK1 may prove to be a marker for all those carcinomas in which there is induction of the kallikrein genes—for example, prostate and oesophageal carcinomas.
It has been reported that in vitro TK1 activates matrix degrading metalloproteinases present in carcinoma cells.35 Our study therefore supports the notion that TK1 is implicated in the process of tumorigenesis, through the cell differentiating and growth effects of kinins.4 Expression of the TK1 gene (KLK1), and the subsequent formation of vasoactive kinin peptides, could stimulate proliferation of tumour cells and, by increasing vascular permeability, enhance metastasis. The detection of the kinin B1 and B2 receptors in oesophageal carcinoma cells, and the observation of increased kinin receptor expression as a result of oncogenic transformation4 provides further evidence for a mitogenic role for kinins in tumour tissue. There have been suggestions that transformation of cells in vitro by the ras oncogene, which is mutated in a large number of human tumours,36 is associated with increased bradykinin receptor expression.37 Taken together with the known release of bradykinin at sites of tissue injury and inflammation,1,38,39 this suggests a role for bradykinin in cell growth control during tumorigenesis.
Bradykinin receptors mediate most of the diverse biological actions of kinins, and many of the biological roles attributed to endogenous kinins. The recent major advances in the area of bradykinin receptor pharmacology have resulted from the use of effective bradykinin receptor antagonists through molecular cloning, and producing colonies of knockout mice with deletion of the B1 and/or B2 receptors.40 The two mammalian kinins, kallidin and bradykinin, influence the cardinal features of inflammation and several other cellular functions. Kinins act as mitogens, stimulating DNA synthesis and thereby promoting cell proliferation. The ability of kinins to induce cell division could enhance the spread of cancerous cells and increase proliferation of epidermal cells in disease. Kinins also appear to play an important role in several other pathological states, namely: postgastrectomy dumping syndrome, inflammatory bowel diseases, carcinoid, anaphylactic shock, and septic shock.
Take home messages.
We have shown for the first time that tissue kallikrein and the kinin B1 and B2 receptors are expressed in oesophageal carcinoma, and their expression is upregulated in mast cells and giant cells of these tumours
Tissue kallikrein released from tumour cells enzymatically generates mitogenic kinins from its endogenous substrate, kininogen, so that it is possible that third generation kinin receptor antagonists, which have been shown to be cytotoxic to cancer cells, may be useful therapeutic agents in this disease
In conclusion, our results are the first to demonstrate the expression of TK1 and the kinin B1 and B2 receptors in oesophageal carcinoma. Inhibitors of TK1 will be of particular value in preventing the regulatory control that TK1 could exert on the process of tumorigenesis. The identification of kinin receptors in oesophageal cancer may have therapeutic implications leading to the possible use of third generation kinin receptor antagonists, which have recently been shown to be active against small cell carcinomas in vivo, and have been shown to be apoptotic to cancer cells in vitro.
Abbreviations
DAB, diaminobenzidine
DIG, digoxygenin
HUK, human urinary kallikrein
PBS, phosphate buffered saline
PCR, polymerase chain reaction
SSC, saline sodium citrate
TK, tissue kallikrein
rTK, recombinant tissue kallikrein
TProK, tissue prokallikrein
REFERENCES
- 1.Bhoola KD, Figueroa CD, Worthy K. Bioregulation of kinins: kallikreins, kininogens, and kininases. Pharmacol Rev 1992;44:1–80. [PubMed] [Google Scholar]
- 2.Clements J, Hooper J, Dong Y, et al. The expanded human kallikrein (KLK) gene family: genomic organization, tissue-specific expression and potential functions. Biol Chem 2001;382:5–14. [DOI] [PubMed] [Google Scholar]
- 3.Roberts RA. Bradykinin receptors: characterisation, distribution and mechanisms of signal transduction. Prog Growth Factor Res 1989;1:237–252. [DOI] [PubMed] [Google Scholar]
- 4.Roberts RA, Gullick WJ. Bradykinin receptor and sensitivity to ligand stimulation of mitogenesis is increased by expression of a mutant ras oncogene. J Cell Sci 1989;94:527–35. [DOI] [PubMed] [Google Scholar]
- 5.Bernitez-Bribiesca L, Martinez G, Ruiz M, et al. Proteinase activity in invasive cancer of the breast. Correlation with tumor progression. Arch Med Res 1995;26:S163–8. [PubMed] [Google Scholar]
- 6.Tsuboi R, Yamaguchi T, Kurita Y, et al. Comparison of proteinase activities in squamous cell carcinoma, basal cell epithelioma and seborrheic keratosis. J Invest Dermatol 1988;6:869–72. [DOI] [PubMed] [Google Scholar]
- 7.Werb Z, Vu TH. Rinkenberger JL, et al. Matrix-degrading proteases and angiogenesis during development and tumor formation. Acta Pathol Microbiol Immunol Scand 1999;107:11–18. [DOI] [PubMed] [Google Scholar]
- 8.Dano K, Romer J, Nielsen BS, et al. Cancer invasion and tissue remodelling—cooperation of protease system and cell types. Acta Pathol Microbiol Immunol Scand 1999;107:120–7. [DOI] [PubMed] [Google Scholar]
- 9.Parkin DM, Laara E, Muir CS. Estimates of the world-wide frequency of sixteen major cancers in 1980. Int J Cancer 1988;41:184–97. [DOI] [PubMed] [Google Scholar]
- 10.Naidoo Y, Snyman C, Raidoo R, et al. Cellular visualization of tissue prokallikrein in human neutrophils and myelocytes. Br J Haematol 1999;105:599–612. [DOI] [PubMed] [Google Scholar]
- 11.Angermann AR, Rahn HP, Hektor T, et al. Purification and characterization of human salivary-gland prokallikrein from recombinant baculovirus-infected insect cells. Eur J Biochem 1992;206:225–33. [DOI] [PubMed] [Google Scholar]
- 12.Schachter M, Maranda B, Moriwaki C. Localisation of kallikrein in the coagulating and submandibular glands of the guinea-pig. J Histochem Cytochem 1978;26:318–21. [DOI] [PubMed] [Google Scholar]
- 13.Henderson LM, Carlos D, Figueroa CD, et al. Assembly of the contact-phase factors on the surface of the human neutrophil membrane. Blood 1994;84:474–82. [PubMed] [Google Scholar]
- 14.Powell J, McConkey CC. Increasing incidence of adenocarcinoma of the gastric cardia and adjacent sites. Br J Cancer 1990;62:440–3. [DOI] [PMC free article] [PubMed] [Google Scholar]
- 15.Blot WJ, Devassa SS, Fraumeni JF. Continuing climb in rates of oesophageal adenocarcinoma: an update [letter]. JAMA 1993;270:1320. [PubMed] [Google Scholar]
- 16.Mosnier JF, Balique JB. Pleomorphic giant cell carcinoma of the esophagus with coexpression of cytokeratin and vimentin and neuroendocrine differentiation. Arch Pathol Lab Med 2004;124:135–8. [DOI] [PubMed] [Google Scholar]
- 17.Hiromatsu Y, Toda S. Mast cells and angiogenesis. Microsc Res Tech 2003;60:64–9. [DOI] [PubMed] [Google Scholar]
- 18.Elpeck G, Gelen T, Aksoy NH, et al. The prognostic relevance of angiogenesis and mast cells in squamous cell carcinoma of the oesophagus. J Clin Pathol 2001;54:940–4. [DOI] [PMC free article] [PubMed] [Google Scholar]
- 19.Tomita M, Matsuzaki Y,, Edagawa M, et al.. Association of mast cells with tumor angiogenesis in oesophageal squamous cell carcinoma. Dis Esophagus 2001;14:135–8. [DOI] [PubMed] [Google Scholar]
- 20.Theoharis CT, Conti P. Mast cells: the Jekyll and Hyde of tumor growth. Trends Immunol 2004;25:235–41. [DOI] [PubMed] [Google Scholar]
- 21.Sawicki B, Kasacka I, Chyczewski I. Preliminary evaluation of mast cells and angiogenesis processes in experimental fibrosarcoma. Folia Histochem Cytobiol 2002;40:197–8. [PubMed] [Google Scholar]
- 22.Gallager SJ, Marshall JS, Hoskin DW. Human mast cells induce caspase-independent DNA fragmentation in leukemia T cells. Oncol Rep 2003;10:1019–23. [PubMed] [Google Scholar]
- 23.Diamandis EP, Yousef GM, Luo I, et al. The new human kallikrein gene family: implications in carcinogenesis. Trends Endocrinol Metab 2000;11:54–60. [DOI] [PubMed] [Google Scholar]
- 24.Bhoola K, Ramsaroop R, Plendl J, et al. Kallikrein and kinin receptor expression in inflammation and cancer. Biol Chem 2001;382:77–9. [DOI] [PubMed] [Google Scholar]
- 25.Sawant S, Snyman C, Bhoola K. Comparison of tissue kallikrein and kinin receptor expression in gastric ulcers and carcinomas. Int Immunopharmacol 2001;1:2063–80. [DOI] [PubMed] [Google Scholar]
- 26.Uetsuji S, Yamamura M, Takai S, et al. Effect of aprotinin on metastasis of Lewis lung tumor in mice. Surg Today 1992;22:439–42. [DOI] [PubMed] [Google Scholar]
- 27.Rehbock J, Bucinger P, Herman A, et al. Identification of immunoreactive tissue kallikrein in human ductal breast carcinomas. J Cancer Res Clin Oncol 1995;121:64–8. [DOI] [PubMed] [Google Scholar]
- 28.Jones TH, Figueroa CD, Smith CM, et al. Tissue kallikrein is associated with prolactin-secreting cells within human growth hormone-secreting adenomas. J Endocrinol 134:149–54. [DOI] [PubMed]
- 29.Clements J, Mukhtar A. Tissue kallikrein and the bradykinin B2 receptor are expressed in endometrial and prostate cancers. Immunopharmacology 1997;36:217–20. [DOI] [PubMed] [Google Scholar]
- 30.Darson MF, Parcelli A, Roche P, et al. Kallikrein 2 (hK2) expression in prostatic intraepithelial neoplasia and adenocarcinoma: a novel prostate cancer marker. Urology 1997;49:857–62. [DOI] [PubMed] [Google Scholar]
- 31.Kishi T, Soosaipillai A, Grass L, et al. Development of an immunofluorometric assay and quantification of human kallikrein 7 in tissue extracts and biological fluids. Clin Chem 2004;50:709–16. [DOI] [PubMed] [Google Scholar]
- 32.Kishi T, Grass L, Soosaipillai A, et al. Human kallikrein 8: immunoassay development and identification in tissue extracts and biological fluids. Clin Chem 2003;49:87–96. [DOI] [PubMed] [Google Scholar]
- 33.Yousef GM, Polymeris ME, Grass L, et al. Human kallikrein 5: a potential novel serum biomarker for breast and ovarian cancer. Cancer Res 2003;63:3958–65. [PubMed] [Google Scholar]
- 34.Kapadia C, Chang A, Soosaipillai A, et al. Human kallikrein 13: production and purification of recombinant protein and monoclonal and polyclonal antibodies, and development of a sensitive and specific immunofluorometric assay. Clin Chem 2003;49:77–86. [DOI] [PubMed] [Google Scholar]
- 35.Hermann A, Buchinger P, Rehbock J. Visualization of tissue kallikrein in human breast carcinoma by two-dimensional western blotting and immunohistochemistry. Biol Chem Hoppe Seyler 1995;376:365–70. [DOI] [PubMed] [Google Scholar]
- 36.Hembree TN, Leeb-Lundberg LM. Regulation of bradykinin B2 receptors by the ras oncogene: evidence for multiple mechanisms. J Cell Physiol 1996;169:248–55. [DOI] [PubMed] [Google Scholar]
- 37.Parries G, Hoebel R, Racker E. Opposing effects of ras oncogene on growth factor-stimulated phosphoinositide hydrolysis: desensitization to platelet-derived growth factor and enhanced sensitivity to bradykinin. Proc Natl Acad Sci U S A 1987;84:2648–52. [DOI] [PMC free article] [PubMed] [Google Scholar]
- 38.Hargreaves KM, Troullos ES, Dionne RA, et al. Bradykinin is increased during acute and chronic inflammation: therapeutic implications. Clin Pharmacol Ther 1988;44:613–21. [DOI] [PubMed] [Google Scholar]
- 39.Stuardo M, Gonzalez CB, Nualart F, et al. Stimulated human neutrophils form biologically active kinin peptides from high and low molecular weight kininogens. J Leukoc Biol 2004;75:631–40. [DOI] [PubMed] [Google Scholar]
- 40.Borkowski JA, Ransom RW, Seabrook GR, et al. Targeted disruption of a B2 bradykinin receptor gene in mice eliminates bradykinin action in smooth muscle and neurons. J Biol Chem 1995;270:13706–10. [DOI] [PubMed] [Google Scholar]