Abstract
Aims: To establish a three dimensional reconstruction of an invasive breast carcinoma using basic laboratory equipment to evaluate and characterise the spatial arrangement of the parenchymal cells of the breast.
Methods: One hundred and twenty eight sequential 4 μm sections (20 μm apart) of the tumour were stained immunohistochemically with an epithelial specific marker (AE1/AE3) or tumour specific marker (c-erbB-2) to reconstruct two different three dimensional images of the normal and malignant parenchymal cells. Sections were digitally imaged using a microscope, scanner, and digital camera linked to a conventional personal computer. Accurate alignment of the digitalised images was carried out using a semiautomatic graphical method of manual interaction, using the cross correlation coefficient as a goodness of fit measure, and an automatic search algorithm using the Fibonacci search algorithm for automatic alignment. The volume was reconstructed using maximum, minimum point projection and “back to front” opacity blending.
Results: The quality of the reconstructed images was distinct and perfect, providing a comprehensive and explicit view of the normal and malignant parenchymal tissues of the breast that is not possible by viewing two dimensional histological sections. Specifically, this approach showed the spatial arrangement of the tumour cells and their relation to the surrounding tissues at a high resolution.
Conclusion: This simple and reproducible approach enables the spread and infiltration of invasive carcinoma to be understood and could also be used to analyse the spatial relation between atypical hyperplastic and malignant in situ lesions of the breast.
Keywords: breast cancer, computer assisted three dimensional reconstruction, invasion, immunohistochemistry
Breast cancer growth and spread is not always uniform and different growth patterns for invasive and in situ breast carcinoma (DCIS) have been proposed.1–3 High grade DCIS grows and spreads continuously throughout the glandular tree, whereas low grade DCIS grows multifocally and typically shows a multicentric distribution.1,2,4–6 Possible ductal anastomoses in the ductal/lobular system that spread between ducts may be a risk factor for extensive intraductal spread, and when this exceeds 20% of the total tumour it is a predictor of local tumour recurrence.6,7 The introduction of three dimensional reconstruction techniques has greatly improved the understanding of breast carcinoma growth patterns and its spatial arrangement.
“There is a need for a technique that produces high quality imaging, comparable to confocal laser scanning microscopy, which is readily available and cost effective”
Several methods of three dimensional reconstruction of tissue from continuous two dimensional images have been developed. Graphic methods using slides that are magnified and projected on tracing paper have been used in studies of intraductal papilloma of the breast.2,8 Confocal laser scanning microscopy (CLSM) is becoming more widely used to produce three dimensional tissue reconstructions, although the processing and storage of image data is expensive and the equipment is not routinely available.9,10 Therefore, there is a need for a technique that produces high quality imaging, comparable to CLSM, which is readily available and cost effective. Although previous three dimensional reconstruction studies, using serial section microscopy, usually experienced difficulties with alignment, the recent advances in computer technology now allow visualisation of stacked sectional images on screen and precise three dimensional reconstruction of these images.
This technology can provide detailed three dimensional reconstructions, similar to CLSM, which do not require expensive equipment. As with confocal microscopy, the complete image assembly, or subsets of it, can be viewed from any angle and rotated in real time, enabling exploration of the three dimensional structure. Computer assisted three dimensional reconstruction of histological sections has successfully been used before to study neural ganglia in drosophila using basic laboratory equipment.9,11 In addition, reconstruction of the three dimensional image of sections stained with normal and tumour specific markers may have great impact on understanding the spatial arrangement of the malignant cells and their relation with the surrounding tissue.
In our study, we have adapted this technique to reconstruct a three dimensional image of an invasive breast cancer using sequential immunohistochemically stained sections in an attempt to validate this technique for the evaluation of the pattern of spread of malignant breast tissues.
MATERIAL AND METHODS
Immunohistochemical analysis
A 1 × 1 × 1 cm sample of invasive ductal breast carcinoma of no special type was fixed in Baker’s formal calcium for 24 hours. Sequential sections (20 µm apart and 4 μm in thickness) were stained immunohistochemically using the standard streptavidin–biotin complex method, as described previously.12 Briefly, endogenous peroxidase activity was blocked by incubation in a 0.3% hydrogen peroxide/methanol buffer. Antigen retrieval was carried out by microwave treatment in sodium citrate buffer (pH 6.0) for 20 minutes. The slides were incubated with normal swine serum (NSS) in Tris buffered saline (TBS) (1/5 vol/vol), followed by primary antibody for 45 minutes: mouse monoclonal antihuman cytokeratin (clone AE1/AE3) used in at an optimal dilution of 1/100 in NSS/TBS or anti-c-erbB-2 antibody, diluted 1/250 in NSS/TBS (both antibodies, DakoCytomation, Ely, UK). Sections were incubated with a secondary antibody (biotinylated goat antimouse/rabbit immunoglobulin; Duet K0492; 1/100 dilution; DakoCytomation) for 30 minutes. 3-3′Diaminobenzidine tetrahydrochloride (liquid DAB plus; K3468; DakoCytomation) was used as chromogen. Counterstaining with haematoxylin was omitted because it masked the immunostaining so that tumour cells could not be distinguished from normal tissue.
Digital photomicrograph capture
JPEG colour digital photomicrographs of each immunostained section were produced with a Sony DFW-X 700 digital camera (Sony Electronics, UK) connected to a Leica DMRX microscope using a ×5 objective lens and PathSight software (Fairfield Imaging, Medical Solutions PLC, Nottingham, UK) and a computer with an Intel Pentium 4 Processor and 3 GHz clock speed. A shade correction tool was used when scanning each slide to ensure uniform background colour. All slides were scanned in the same manner, using a standard large sized rectangular scanning area (6.1 × 4.0 cm) to overcome the different location of tissue sections on the slides.
Conversion into three dimensional images
The JPEG file of each section was converted into a 256 greyscale 8 bit TIFF file using three dimensional FI software (Fairfield Imaging). Each TIFF image was rotationally and translationally orientated to the previous sequential image using FiAlign software (Fairfield Imaging). The aligned three dimensional images were converted into a three dimensional image by volumetric rendering using FiRender software (Fairfield Imaging). Volumetric rendering converts two dimensional pixels into three dimensional voxels, the smallest distinguishable box shaped part of a three dimensional space. Back to front opacity rendering was also used to alter the transparency of individual voxels throughout the image. This resulted in greater clarity of the three dimensional image and enhanced specific features of the tissue. The voxel size was 27 × 27 × 24 μm. The dataset was approximately 130 Mb in total. Colours were also assigned to voxel values or ranges of voxel values to produce coloured images. For custom angle visualisation, the image was rotated around the axis at any angle using FiRender. Filters were also applied to increase contrast between the areas of malignant and normal tissues in the three dimensional volume rendered image. To enhance the visualisation of the three dimensional image, especially with respect to the separation of pathological features, the rendered dataset images of the two antibodies used in our study were merged using FiAlign.
Our study was approved by the Nottingham local research ethics committee.
RESULTS
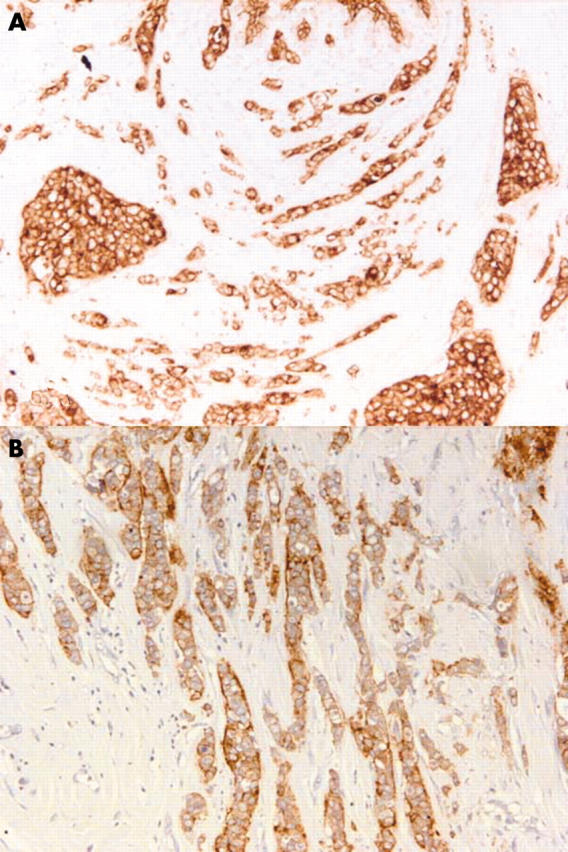
The breast carcinoma sample used was chosen on the basis of having invasive carcinoma of no special type associated with DCIS and showing positive staining for c-erbB-2 antibody. Sequential sections were stained with the broad spectrum anticytokeratin antibody (AE1/AE3) to provide an overview of the normal, benign, and malignant parenchymal cells, whereas anti-c-erbB-2 antibody stained malignant tumour cells only (fig 1).
Figure 1.

Non-specific type invasive breast carcinoma immunohistochemically stained for (A) AE1/AE3 (no counterstain) and (B) C-erb-B2. Original magnification, ×20.
Digital photographs of the immunohistochemically stained sections were taken. For alignment, a field frame was placed in all sections and images were aligned by identification and localisation of existing structures regarding their specific characteristics—including number, position, morphology, and spatial distribution—with the aid of the field frame. Collected volume data were based on observations of aligned two dimensional sections. FiAlign successfully aligned all sections with a mean cross correlation coefficient value of 99.5%. Because sections were cut at a 20 μm distance, there was no need for artificial reconstruction of the missing space between them. The images were volume rendered to produce the three dimensional reconstructed image of the specimen. Several colour blended palette combinations (for example, blue/green) were applied to the voxel values of the volume rendered images.
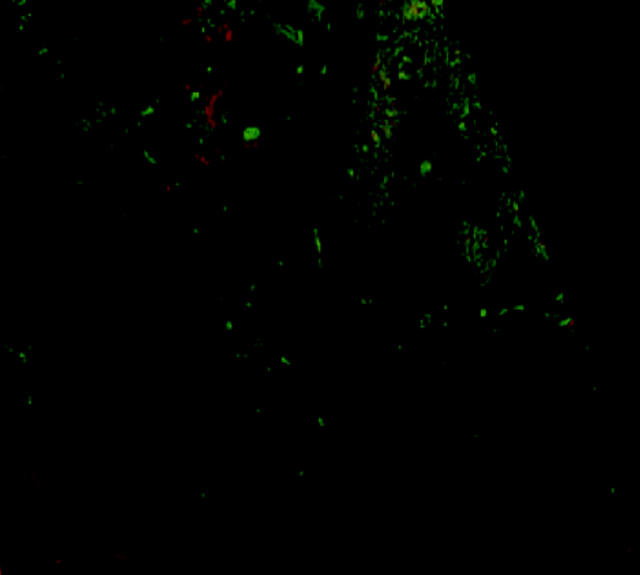
Sections stained with the AE1/AE3 antibody were used to produce an overview of the spatial arrangement of the whole parenchymal area and validate the three dimensional reconstruction (fig 2). FiRender software was used to change several factors to achieve a clear distinction between the stained tissues. Unwanted background was removed by accurately defining the area of interest, and the opacity curve of the 256 grey scale voxels was varied to enhance the definition of particular features. However, it was difficult to differentiate between invasive carcinoma, DCIS, and fibrocystic disease using a non-specific epithelial cell marker.
Figure 2.
Volume rendered three dimensional reconstruction of a non-specific type invasive breast carcinoma stained for AE1/AE3 showing the spatial arrangement of all parenchymal tissues.
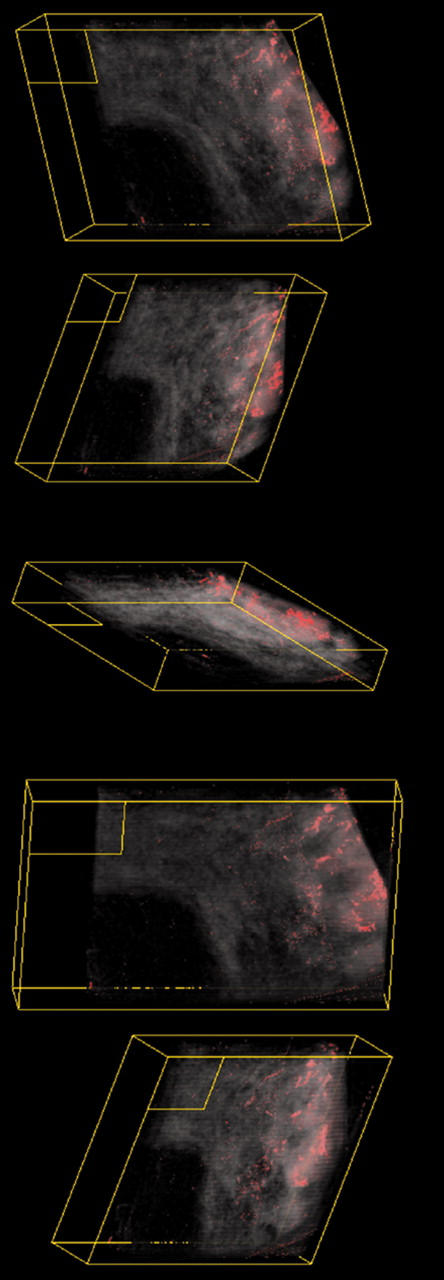
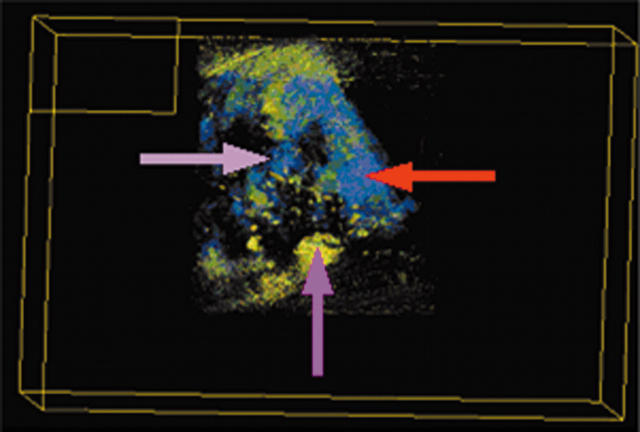
Using the tumour specific marker c-erbB-2, it was possible to identify and distinguish the areas of malignant tissue and their spatial arrangement (fig 3). Using the median filter alterations in brightness and contrast and block filling the assigned voxel values of the tumour areas, the areas of malignant tissue were clearly distinct from the surrounding non-malignant tissue. To consider the area of malignant cells and its relation with the surrounding non-tumorous tissues, we combined the three dimensional reconstructions of both sets of stained sections using FiAlign (fig 4). The red colour denotes the parenchymal tissue (AE1/AE3 staining) and the green denotes the malignant tissue (c-erbB-2 staining). High resolution versions of figs 2–4, together with a three dimensional animated image, can be viewed at our website (http://www.nottingham.ac.uk/~mrzarg/kurien_jcp2005.htm).
Figure 3.

Volume rendered three dimensional images at different angles of a non-specific type invasive breast tumour stained for c-erbB2 using a red and black palette to identify and distinguish the areas of malignant tissues and their spatial arrangement.
Figure 4.
Visualisation of invasive carcinoma using volume rendered three dimensional images of a non-specific type invasive breast tumour stained for AE1/AE3 and c-erbB-2.
DISCUSSION
We have successfully reconstructed three dimensional images of a breast carcinoma by aligning sequential immunohistochemically stained sections with a simple and reproducible technique using routine laboratory equipment. We tried to overcome the problems that interfere with the proper alignment of sections that are usually encountered during three dimensional reconstruction of serial sections. All sections were handled simultaneously to minimise the problem of sample shrinkage during processing and the variable degree of stretching owing to partial rehydration of different sections.13 In addition, inaccurate alignment of serial sections was avoided by using sequential sections 20 μm apart with the identification of tissue structures and field frame. We also used an identical large scanning area for all scans—sufficient to cover the whole section on each slide regardless of position.
The montage technique to acquire low power overview images has the advantage that resolution and clarity of images can be increased over that of images captured directly using a low power objective because of the more ideal pairing of the CCD used for image capture and the other optical components of the microscope. The disadvantages of the montage technique are that it increases the time taken to acquire the images, and any illumination issues of the microscope field can present a visualisation problem, although the system compensated for these by the use of shade correction. The alignment of the serial sections only considered the translation and rotational aspects; in practice, the placing of the cut serial section on the microscope slide can warp the sections, and this can result in reconstruction errors.
Voxel rendering allowed the structure within the volume to be viewed and enabled detailed observations to be made. Although instant real time rotation was not possible, image rotation was less than one second for each rotational change. In addition, the three dimensional image could be zoomed, but because the reconstruction is voxel based rather than geometry based, the image became pixelated or blurred even with a bi-cubic interpolation function. Because images produced by voxel rendering do not provide the necessary clarity for the causal observer, knowledge of the specimen structure under review is required. Surface rendering would produce a clearer image that enables a more interactive review. Geometric rendering would require simplification of the dataset, and the selection of a threshold used for the generation of the polygon mesh—this would result in loss of data and the subtleties in this complex dataset to be lost.
The AE1/AE3 antibody enabled the breast parenchymal tissues to be recreated, whereas the use of anti-c-erbB2 allowed better visualisation of the malignant cells only. We found that the quality of images produced was improved by using automated immunohistochemical staining, which ensured reproducibility of staining and consistency of staining intensity in the digitalised images of the slides. Histogram modification techniques might help reduce the variation in staining intensity between slides. Using three dimensional reconstruction combined with double label immunostaining, it was possible to study the spread, growth, and infiltration of malignant lesions of the breast, allowing structures to be observed from different angles, and their spatial position, number, morphology, special characteristics, and volume to be estimated, in addition to creating a three dimensional image, thus bring the usability of this technique in line with CLSM. This technique could also be used on a network/internet server, although the processing speed would be lower.
The conversion of JPEG files to an 8 bit greyscale TIFF file using the three dimensional FI software was not ideal because the program assigns only one out of a possible 256 intensity values to each voxel. The assignment of intensity values leads to a loss of colour information in the final image. This leads to an overlap in voxel values displayed in the three dimensional images, resulting in specific colours being designated to both areas of tumour and areas of normal benign tissue, making important structures difficult to differentiate when using the AE1/AE3 antibody. In the JPEG map files there are at least 2 × 1024 different colours available, but only 256 colours were available to produce the three dimensional image. With the use of the C-erbB-2 antibody this problem is overcome because of the vast difference in voxel values given to the tumour and normal areas. Performing the process in colour instead of reducing the colours from 2 × 1024 to 256 intensity values may improve the quality of the images produced. However, this would require greater computer processing power and storage capabilities. Using up to 2000 voxel intensity values would strengthen the three dimensional reconstruction of the images. The remapping of colour images to grey level intensity images introduced difficulties in the reconstruction; however, true colour rendering systems are difficult to control. A possible compromise would be to convert the colour image not purely to an intensity image but to an 8 bit image that maintained colour information.
“The three dimensional reconstruction methods used here can be completed using images captured from any high quality microscope imaging station, with the additional rendering hardware and software costing approximately £5000”
Although we used a relatively thin sample, we have no doubt that the application could handle at least a dataset double this size with appropriate additional computer memory. A distance of 20 μm between sections was used to have reasonable z resolution and not to distort the aspect ratio point with respect to x y resolution. If the gap between samples were to be increased, then a reduction in the z resolution would occur; this would produce a dataset with poor aspect ratio, which would require resampling.
The recent reconstruction of three dimensional specimens by Fernandez-Gonzalez et al was completed using surface rendering techniques in which a threshold was set and a geometry generation method, such as marching cubes, was used to generate the surface to be rendered.14 Reducing the amount of data has an advantage in the display and visualisation of the simplified dataset. However, it is not possible to produce a geometric surface that can be fitted to non-solid objects or areas such as those commonly seen in histological sections. This is contrast to our study, where voxel rendering was used to allow the visualisation of the specimen data in as near to original form as possible.
Our three dimensional reconstruction of serial sections of a biological structure using basic laboratory equipment was extremely successful. The images produced were comparable to those produced by CLSM and could be manipulated in a similar manner, and more cost effectively. The three dimensional reconstruction methods used here can be completed using images captured from any high quality microscope imaging station, with the additional rendering hardware and software costing approximately £5000. Furthermore, we believe that using this technique combined with double labelling could provide an enhanced and more accurate visualisation of the pattern of spread of in situ lesions of the breast. Using antibodies directed at alternative targets, such as invasion, could provide a better understanding of the process of malignant breast transformation.
Take home messages.
We have devised a simple and reproducible technique for the three dimensional reconstruction of invasive breast carcinoma using basic laboratory equipment and sequential sections of tumour tissue
Combining this technique with double labelling could provide an enhanced and more accurate visualisation of the pattern of spread of in situ lesions of the breast
Using antibodies directed at alternative targets, such as invasion, could provide a better understanding of the process of malignant breast transformation
Abbreviations
CLSM, confocal laser scanning microscopy
DCIS, ductal carcinoma in situ
NSS, normal swine serum
TBS, Tris buffered saline
Competing interests: Professor I O Ellis is the Medical Director of Medical Solutions PLC and has responsibility for the strategic direction and medical supervision of the company’s diagnostic pathology and laboratory services. There are no other competing interests.
REFERENCES
- 1.Ohtake T, Kimijima I, Fukushima T, et al. Computer-assisted complete three-dimensional reconstruction of the mammary ductal/lobular systems: implications of ductal anastomoses for breast-conserving surgery. Cancer 2001;91:2263–72. [DOI] [PubMed] [Google Scholar]
- 2.Faverly DR, Burgers L, Bult P, et al. Three dimensional imaging of mammary ductal carcinoma in situ: clinical implications. Semin Diagn Pathol 1994;11:193–8. [PubMed] [Google Scholar]
- 3.Mai KT, Perkins DG, Mirsky D. Location and extent of positive resection margins and ductal carcinoma in situ in lumpectomy specimens of ductal breast carcinoma examined with a microscopic three-dimensional view. Breast J 2003;9:33–8. [DOI] [PubMed] [Google Scholar]
- 4.Holland R, Hendriks JH, Vebeek AL, et al. Extent, distribution, and mammographic/histological correlations of breast ductal carcinoma in situ. Lancet 1990;335:519–22. [DOI] [PubMed] [Google Scholar]
- 5.Jenkinson AD, Al-Mufti RA, Mohsen Y, et al. Does intraductal breast cancer spread in a segmental distribution? An analysis of residual tumour burden following segmental mastectomy using tumour bed biopsies. Eur J Surg Oncol 2001;27:21–5. [DOI] [PubMed] [Google Scholar]
- 6.Dixon M. ABC of breast diseases. London: BMJ Publishing Group, 2000.
- 7.Ohtake T, Abe R, Kimijima I, et al. Intraductal extension of primary invasive breast carcinoma treated by breast-conservative surgery. Computer graphic three-dimensional reconstruction of the mammary duct-lobular systems. Cancer 1995;76:32–45. [DOI] [PubMed] [Google Scholar]
- 8.Ohuchi N, Abe R, Kasai M. Possible cancerous change of intraductal papillomas of the breast. A 3-D reconstruction study of 25 cases. Cancer 1984;54:605–11. [DOI] [PubMed] [Google Scholar]
- 9.Streicher J, Weninger WJ, Muller GB. External marker-based automatic congruencing: a new method of 3D reconstruction from serial sections. Anat Rec 1997;248:583–602. [DOI] [PubMed] [Google Scholar]
- 10.Baak JP, Wisse-Brekelmans EC, Uyterlinde AM, et al. Evaluation of the prognostic value of morphometric features and cellular DNA content in FIGO I ovarian cancer patients. Anal Quant Cytol Histol 1987;9:287–90. [PubMed] [Google Scholar]
- 11.Streicher J, Donat MA, Strauss B, et al. Computer-based three-dimensional visualization of developmental gene expression. Nat Genet 2000;25:147–52. [DOI] [PubMed] [Google Scholar]
- 12.Madjd Z, Pinder SE, Paish C, et al. Loss of CD59 expression in breast tumours correlates with poor survival. J Pathol 2003;200:633–9. [DOI] [PubMed] [Google Scholar]
- 13.Deverell MH, Salisbury JR, Cookson MJ, et al. Three-dimensional reconstruction: methods of improving image registration and interpretation. Anal Cell Pathol 1993;5:253–63. [PubMed] [Google Scholar]
- 14.Fernandez-Gonzalez R, Jones A, Garcia-Rodriguez E, et al. System for combined three-dimensional morphological and molecular analysis of thick tissue specimens. Microsc Res Tech 2002;59:522–30. [DOI] [PubMed] [Google Scholar]


