Abstract
Background: Gastrin G cells and somatostatin D cells are important regulators of gastric acid secretion and alterations in their relative numbers may play a key role in gastroduodenal disease.
Aim: To investigate the effect of Helicobacter pylori infection on the density of immunoreactive G and D cells in gastric antral and corpus biopsies from patients with dyspeptic complaints.
Methods: One hundred and twenty two patients with dyspeptic complaints had two antrum and two corpus biopsies taken during upper endoscopy. The severity of inflammation and the density of H pylori were evaluated semiquantitatively. In addition, the density and distribution of neuroendocrine cells, especially G and D cells, were examined using immunohistochemistry. Patients were divided into three groups, those with H pylori positive gastritis, H pylori negative gastritis, and histologically normal gastric mucosa.
Results: The number of immunoreactive G cells was significantly higher and the number of immunoreactive D cells lower in patients with H pylori positive gastritis compared with H pylori negative gastritis or histological normal gastric mucosa. The percentage of G cells as a percentage of mucosal endocrine cells was also raised and that of D cells was decreased.
Conclusions: Helicobacter pylori infection produces alterations in the number of endocrine cells responsible for regulating acid secretion in relation to intragastric pH and feeding. The alterations correlate best with the severity of inflammation and not with H pylori density.
Keywords: gastritis, Helicobacter pylori, gastrin, somatostatin, chromogranin
The secretion of acid is an important function of the human stomach. In humans, although the rate of secretion varies, acid is continuously secreted by the gastric mucosa. During periods of fasting, the rate of acid secretion is low but sufficient to maintain an intragastric pH below 2. The regulation of gastric acid secretion is achieved by the interplay between two major gastric endocrine cells: the gastrin G cell and the somatostatin D cell. Regulation of these cells occurs via stimulatory or inhibitory paracrine, endocrine, and neural pathways. When food enters the stomach, the protein component stimulates G cells situated in the antral region of the stomach to release the hormone gastrin, which stimulates the enterochromaffin-like cells to release histamine and stimulates parietal cells to secrete acid. As the acidity of the stomach and duodenum increases, protective feedback pathways are activated to inhibit further acid secretion.1 One important acid mediated inhibitory control is related to the release of somatostatin by D cells.2–4 Somatostatin exerts paracrine inhibitory control on gastrin release by the antral G cells.5
“The regulation of gastric acid secretion is achieved by the interplay between two major gastric endocrine cells: the gastrin G cell and the somatostatin D cell”
Helicobacter pylori infection interferes with these physiological control processes, resulting in alterations of gastric acid secretion. Several clinical and animal studies6,7,8,9,10,11,12,13,14 have been performed to examine the effect of H pylori infection on the regulation of gastric acid secretion. Helicobacter pylori is associated with increases in both fasting and meal stimulated gastrin values. In addition, the normal physiological negative feedback control of secretion is impaired. These phenomena are reversible—after H pylori eradication, gastrin concentrations normalise and normal feedback control of gastrin secretion is restored.15–17 Therefore, the purpose of our study was to investigate the relation between H pylori status, the type and severity of gastric inflammation, and the location and number of G and D cells in the gastric mucosa. These studies were designed to characterise and clarify the mechanism of altered acid secretion as a result of H pylori infection.
MATERIAL AND METHODS
Trial design
One hundred and seventy three patients (female to male ratio, 1.25) between the ages of 17 and 78 years (mean, 42; SD, 15.6) undergoing endoscopy for evaluation of dyspepsia were recruited from Dutch family doctors in 1993. Patients who had reflux oesophagitis, peptic ulcers, and malignancy were excluded from our study. Ethics committee approval and informed consent were obtained from each patient. We compared the presence and severity of gastritis with the presence and density of immunoreactive endocrine cells in the gastric mucosa.
Endoscopy
All the patients underwent upper gastrointestinal endoscopy. Two antral and two corpus biopsies were obtained. The biopsies were used for histological evaluation and for immunohistological staining for gastrin, somatostatin, and chromogranin. An additional biopsy was obtained for the rapid urease test (CLOtest).
Histological examination
Specimens were fixed in 10% formalin and routinely processed. Paraffin wax embedded sections were cut into 3–4 μm thick serial sections and stained with haematoxylin and eosin. Giemsa staining was routinely performed to detect the presence or absence of H pylori. The sections were interpreted by two experienced pathologists (TK and YL), who were unaware of the clinical and endoscopic findings.
The following four parameters were evaluated and graded, as suggested by the Sydney system: (1) chronic inflammation, which is scored on the basis of the chronic inflammatory infiltrate in the lamina propria; (2) active component of inflammation through assessing the polymorphonuclear leucocytes (neutrophilic infiltration); (3) atrophy, which is scored on the basis of the proportional loss of the specialised gastric glands, with or without replacement of intestinal metaplastic tissue; areas with lymphoid follicles, dense infiltration, or both were not graded for atrophy; and (4) intestinal metaplasia, which was scored as absent or occupying less than one third, more than one third, or more than two thirds of the mucosa present. For both antrum and corpus, biopsies were assessed semiquantitatively by a score (0, absent; 1–2, mild; 3–4, moderate; and 5–6, severe). The density of H pylori in each Giemsa stained specimen was graded as suggested by Marshall and Warren18 as no bacteria (grade 0), occasional bacteria found after searching (grade1, +), scattered bacteria in most high power fields or occasional groups of numerous bacteria (grade 2, ++), and numerous bacteria in most high power fields (grade 3, +++).
All subjects were divided into three categories on the basis of histology and the results of the rapid urease test as those with: H pylori positive gastritis, H pylori negative gastritis, and histological normal gastric mucosa. Patients were classified as positive for H pylori if one of the two tests (CLO and Giemsa staining) was positive and as negative if both tests were negative.
Immunohistochemistry
Mucosal biopsies were immunostained with polyclonal antibodies to gastrin, somatostatin, and chromogranin by the avidin–biotin complex (ABC) method (DakoCorp, Copenhagen, Denmark). In brief, sections were dewaxed and rehydrated in graded alcohols. Endogenous peroxidase activity was quenched, antigen retrieval was performed by heating for 10 minutes at 100°C in 0.01M sodium citrate, and non-specific staining was reduced by a blocking step. The rabbit antibodies against gastrin (1/1000 dilution), somatostatin (1/1600 dilution), and chromogranin (1/1000 dilution) were applied in phosphate buffered saline containing 1% bovine serum albumin and 0.1% Triton and incubated overnight at 4°C (all three antibodies were from DakoCorp). The following day, a three step detection method was used as described previously, using a biotinylated goat antirabbit immunoglobulin antibody (Dako; 1/500 dilution). Detection was performed with horseradish peroxidase conjugated ABC (Dako) for 60 minutes and peroxidase activity was detected with diaminobenzidine (fast DAB; Sigma, St Louis, Missouri, USA), according to the manufacturer’s instructions, resulting in the formation of a brown reaction product. Finally, the sections were briefly counterstained with haematoxylin, dehydrated in graded alcohols, and mounted. Further controls consisted of omitting the primary and secondary antibodies and the use of an appropriate immunoglobulin control.
Only sections showing the entire axis from the superficial luminal epithelium to the muscularis mucosae were examined. Cells that stained positive for gastrin G cells, somatostatin D cells, and chromogranin endocrine cells were counted in a minimum of three high power fields for each specimen, without reference to the clinical histories. Each cell was identified as a G, D, or endocrine cell type if a dark brown granular reaction was produced by the ABC method. The numbers of endocrine cells were evaluated by two pathologists (TK and YL). Ten well oriented vertical glands in each field were counted. The results were expressed as the total number of cells counted/10 adjacent glands. If the glandular structure was not well oriented, we counted two areas (the area with the most and the area with the least intensive 10 adjacent glands) and calculated the mean. The average number of positively counted cells for each 10 vertical glands was compared between groups. Moreover, the distribution of the cells was also reported (even or uneven).
Statistical analyses
Data were analysed using the SPSS statistical package. The χ2 test was used to calculate the difference between G and D cells with respect to H pylori status, the Mann-Whitney U test for analysing the difference in the grading of gastritis features, and the Spearman rank correlation test for analysing the correlation between different gastritis features and H pylori status, and between G and D cells. A p value less than 0.05 was considered to be significant.
RESULTS
In total, 122 of the 194 patients who underwent endoscopy for dyspeptic complaints were used in our analyses. Table 1 shows the characteristics of the patients studied. The age and sex distribution did not differ significantly among the different groups.
Table 1.
Characteristics of the patients
| Status | No of patients | Mean (SD) age (years) | Sex (F/M) |
| H pylori (+) | 58 | 47.4 (15) | 0.9 (27/31) |
| H pylori (−) | |||
| Chronic gastritis | 17 | 44.0 (16) | 0.9 (8/9) |
| Normal (no gastritis) | 47 | 41.7 (14) | 0.8 (21/26) |
Helicobacter pylori status and histopathological changes
Helicobacter pylori infection was found in 58 patients (58 of 122; 47.5%) with both procedures (CLO and Giemsa staining), with the remaining 64 individuals being H pylori negative (64 of 122; 52.5%). Among the non-infected individuals, 47 had no histological changes, and 17 had features of chronic gastritis.
The histological scores for chronic inflammation, activity, atrophy, and intestinal metaplasia were higher in H pylori positive than in H pylori negative patients (p < 0.05) and H pylori infection was significantly associated with increased antral inflammation and activity (p < 0.01). Mucosal atrophy was more prevalent in patients with H pylori infection than those without. Antral atrophy was more pronounced than corpus atrophy (p < 0.01).
Expression of gastrin, somatostatin, and chromogranin
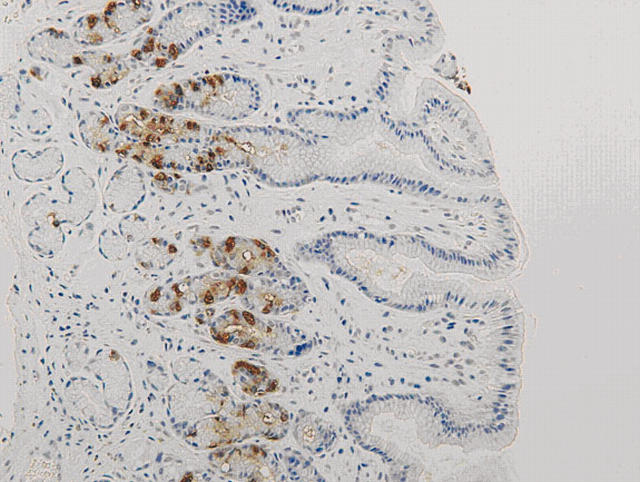
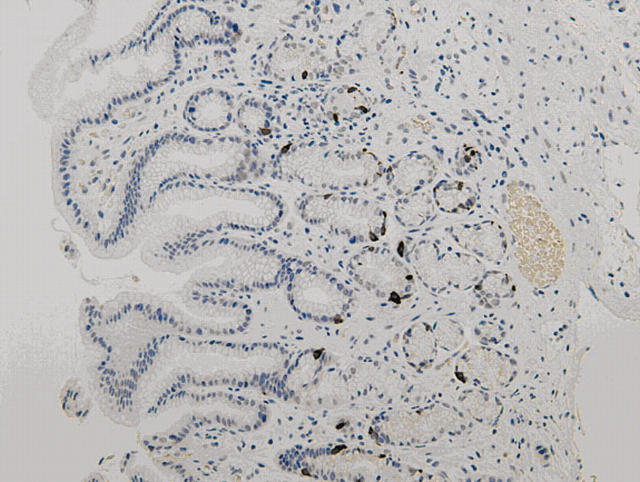
There was no immunoreactivity when the primary antibodies were omitted from the staining procedure. The staining patterns for gastrin, somatostatin, and chromogranin were similar. Positive cells revealed cytoplasmic staining. Most of the positive cells were located in the middle third of the gastric glands, with few in the upper or deeper parts (figs 1, 2). However in H pylori positive patients, the distribution of chromogranin and gastrin positive cells moved slightly upwards to just beneath the foveolar gastric pit. G cells were only present in the antrum, whereas D cells and chromogranin positive cells were expressed both in the antrum and the corpus.
Figure 1.
Antral mucosa stained for gastrin positive G cells (original magnification, ×80).
Figure 2.
Antral mucosa stained for somatostatin positive D cells (original magnification, ×80).
The H pylori infected individuals had significantly higher numbers of immunoreactive G cells and lower numbers of immunoreactive D cells than both those with non-infected gastritis and those with histological normal gastric mucosa. Significant differences existed between infected and non-infected individuals or normal groups both for immunoreactive G cells and D cells (table 2). A significant correlation was found between antrum immunoreactive G cells and D cells (correlation coefficient, 0.29) (p < 0.01).
Table 2.
Density of the endocrine cells, gastrin, and somatostatin in Helicobacter pylori infected patients, non-infected patients, and normal subjects
| Status | No of subjects | Chromogranin cell density | G cell density | D cell density | ||
| Antrum | Corpus | Antrum | Corpus | |||
| H pylori (+) | 58 | 49.1 (21) | 22.2 (15) | 34.4 (19)* | 2.4 (2)* | 0.7 (1) |
| H pylori (−) | ||||||
| Chronic gastritis | 17 | 49.0 (19) | 28.2 (16) | 23.1 (10) | 7.4 (5) | 1.6 (2) |
| Normal (no gastritis) | 47 | 50.5 (22) | 19.1 (9) | 26.3 (13) | 8.8 (6) | 1.6 (2) |
Cell density values are mean (SD).
*Significant difference (p<0.01).
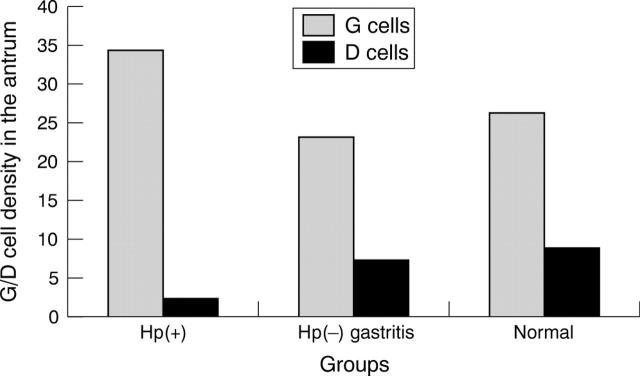
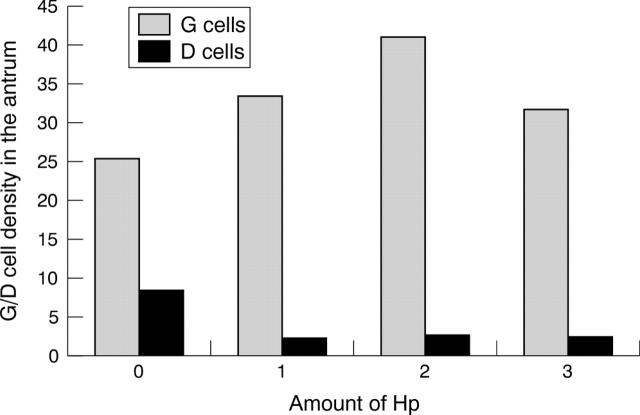
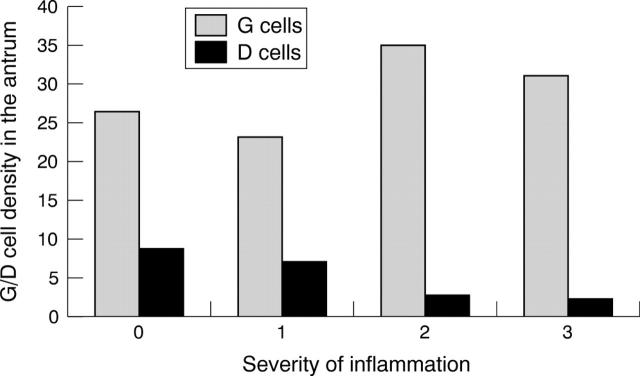
Figure 3 compares the density of immunoreactive G cells and D cells in each group. The number of immunoreactive G cells was highest among H pylori infected patients and lowest among those with normal gastric mucosa. In contrast, the lowest score for immunoreactive D cells was seen in H pylori infected patients. The mean density of immunoreactive G cells and immunoreactive D cells in patients with H pylori negative chronic gastritis and with normal mucosa were not significantly different. Figure 4 summarises the density of immunoreactive G cells and D cells in relation to the density of H pylori. Although the number of immunoreactive G cells was higher and the number of D cells lower in those with H pylori infection compared with the H pylori negative group, there was no evidence of a linear relation between H pylori density and the density of either immunoreactive G or D cells. In contrast, the density of immunoreactive G and D cells was similar among those without inflammation and those with minimal inflammation (grade 1) (fig 5). Immunoreactive G cell density increased and D cell density decreased among those with moderate or severe inflammation (fig 5).
Figure 3.
The mean density of gastric G cells and somatostatin D cells in the antrum in the Helicobacter pylori positive and negative (Hp(+) and Hp(−), respectively) and normal groups.
Figure 4.
The density of gastric G cells and somatostatin D cells in the antrum in relation to the amount of Helicobacter pylori (Hp).
Figure 5.
The density of gastric G cells and somatostatin D cells in the antrum in relation to the severity of inflammation.
Percentage of G and D cells in the stomach
In addition to gastrin and somatostatin, chromogranin was used to identify all endocrine cells. The mean (SD) number of chromogranin positive cells was 49.1 (21) in H pylori infected patients, 49.0 (19) in non-infected gastritis patients, and 50.5 (22) in those with normal mucosa (p > 0.05).
The percentage of G cells and D cells of all endocrine cells in the stomach was 52.0% and 17.5% in normal individuals, and 47.1% and 15% in the H pylori negative group. However in the H pylori infected subjects, 70.1% of chromogranin positive cells were G cells and only 4.9% were D cells. The difference between H pylori infected and non-infected or normal individuals was significant (p < 0.01; table 3).
Table 3.
Percentage of gastrin and somatostatin positive cells of the total number of endocrine cells in Helicobacter pylori infected and non-infected subjects
| Status | No of subjects | % G cells | % D cells | |
| Antrum | Corpus | |||
| H pylori (+) | 58 | 70.1% | 4.9%* | 3.1% |
| H pylori (−) | ||||
| Chronic gastritis | 17 | 47.1% | 15% | 5.6% |
| Normal (no gastritis) | 47 | 52.0% | 17.5% | 8.3% |
*Significant difference (p<0.01).
DISCUSSION
Gastrin G and somatostatin D cells are the major endocrine cells in the stomach known to play an important role in acid secretion.19 Normally, about 50% of the endocrine cell population of the antrum is made up of G cells and 15% of D cells. In the corpus mucosa, enterochromaffin-like cells form a major proportion of the endocrine cells.19 However, no study has been carried out to define the exact percentages of these endocrine cells. In our study, approximately 52% of all the endocrine cells in the antrum were G cells and 17.5% were D cells. In the corpus, 8.3% of cells were D cells and no immunoreactive G cells were found. These results are comparable to other studies.2 We also confirmed that the percentages of G and D cells were altered in H pylori infected gastric mucosa, with an increase in the proportion of G cells and a decrease in D cells.
Gastrin is released from G cells in the gastric antrum and acts via the circulation to stimulate acid secretion. Both H pylori infection and acid secretion are related to the development of duodenal ulcers, prompting several investigators to examine the effect of H pylori infection on the control of acid secretion. In 1989, Levi et al reported that both basal and stimulated acid secretion plasma gastrin values were significantly higher in H pylori positive patients than in H pylori negative ones.20 These data were rapidly confirmed, and it was also shown that this increase was reversed after H pylori eradication.6,21–25 Studies of antral biopsies from H pylori infected individuals have shown that gastrin synthesis is increased.26
“Overall, our data are consistent with the notion that the major defect leading to enhanced gastrin concentrations is related to disruption of the inhibitory effect of somatostatin on the G cell”
Normally, gastrin release is suppressed when the luminal antral pH falls below 3. In addition, there is an inhibitory control exerted on gastrin release by cholecytokinin. The inhibition of gastrin release exerted by both gastric acid and cholecytokinin is mediated mainly via the release of somatostatin by D cells within the antral mucosa. Several studies have now demonstrated lowered concentrations of somatostatin within the antral mucosa of subjects with H pylori antral gastritis.8,10,12,13,15,16,27 In addition, somatostatin mRNA concentrations are lowered, indicating a reduced synthesis of this inhibitory hormone.10,13 These findings are consistent with our results that the density of D cells was significantly lower in H pylori infected patients than in uninfected patients and normal individuals, whereas the density of G cells was significantly increased. The mechanism responsible for increased gastrin secretion and reduced somatostatin secretion remains unclear. Hypotheses have included a stimulatory effect of H pylori urease on gastrin release, but this is unlikely because we were unable to show an association between H pylori density and the density of immunoreactive G and D cells. The fact that there was an association with the severity of inflammation is more consistent with a role for cytokines released by inflammatory cells (for example, interleukin 1β, tumour necrosis factor α, and interferon γ).28 The increase in inflammation associated with the presence of more virulent H pylori types (such as those containing the Cag pathogenicity island) would also be expected to have a more profound effect on gastrin/somatostatin homeostasis.
In some subjects, H pylori infection results in antral predominant gastritis, with increased acid secretion and a propensity to duodenal ulcer disease; in others it results in body gastritis with low acid secretion and a predisposition to atrophic gastritis and gastric cancer, whereas in most subjects it results in mixed gastritis, with no overall change in acid secretion. The net effect on acid secretion presumably depends on which mechanism predominates. Because patients’ numbers in some subgroups were limited in our study, we could not analyse the group regarding the distribution as antral predominant gastritis, pangastritis, or corpus gastritis.
Take home messages.
Helicobacter pylori infection produces alterations in the number of endocrine cells responsible for regulating acid secretion: gastrin G cells are increased in number and somatostatin D cells are decreased
These alterations correlate best with the severity of inflammation and not with H pylori density
Further studies are needed to examine the pattern of D and G cells in a wider spectrum of H pylori infected gastric tissues, and to compare the different strains of H pylori
Overall, our data are consistent with the notion that the major defect leading to enhanced gastrin concentrations is related to disruption of the inhibitory effect of somatostatin on the G cell. It appears that H pylori antral gastritis increases gastrin by producing a deficiency of antral somatostatin and of the normal inhibitory influence of this hormone on gastrin release.
Our study showed that the total numbers of G cells were significantly higher in H pylori infection. However, others have suggested that the numbers are unchanged.11,15,29,30 The reasons for these differences are unclear. Possibilities include patient selection, as reflected in differences in the pattern and severity of gastritis among those examined. We found that the changes were most pronounced in those with the most severe inflammation. We speculate that the changes in cell numbers may in fact be a dynamic process. Initially, the density of G cells increases, but may later fall if antral atrophy occurs.31,32 Subsequent studies are needed to examine the pattern of D and G cells in a wider spectrum of H pylori induced histologically damaged gastric mucosal tissues, and to compare the possible role of different strains of H pylori.
Acknowledgments
We are grateful to Dr DY Graham for critical reading of the manuscript and his useful comments.
Abbreviations
ABC, avidin–biotin complex
D, somatostatin
G, gastrin
REFERENCES
- 1.Hersey SJ, Sachs GSJ. Gastric acid secretion. Physiol Rev 1995;75:155–89. [DOI] [PubMed] [Google Scholar]
- 2.Lloyd KC, Wang J, Aurang K, et al. Activation of somatostatin receptor subtype 2 inhibits acid secretion in rats. Am J Physiol 1995;268:G102–6. [DOI] [PubMed] [Google Scholar]
- 3.Martinze V, Curi AP, Torkian Bschaeffer JM, et al. High basal gastric acid secretion in somatostatin receptor subtype 2 knockout mice. Gastroenterology 1998;114:1125–32. [DOI] [PubMed] [Google Scholar]
- 4.Schubert ML, Edwards NF, Makhlouf GM. Regulation of gastric somatostatin secretion in the mouse by luminal acidity: a local feedback mechanism. Gastroenterology 1988;94:317–22. [DOI] [PubMed] [Google Scholar]
- 5.Wu SV, Giraud A, Mogard M, et al. Effects of inhibition of gastric secretion on antral gastrin and somatostatin gene expression in rats. Am J Physiol 1990;258:G788–93. [DOI] [PubMed] [Google Scholar]
- 6.Feldman M, Cryer B, Lee E. Effects of Helicobacter pylori gastritis on gastric secretion in healthy human beings. Am J Physiol 1998;274:G1011–17. [DOI] [PubMed] [Google Scholar]
- 7.Peterson WL, Barnett CC, Evans DI Jr, et al. Acid secretion and serum gastrin in normal subjects and patients with duodenal ulcer: the role of Helicobacter pylori. Am J Gastroenterol 1993;88:2038–43. [PubMed] [Google Scholar]
- 8.Gibbons AH, Legon S, Walker MM, et al. The effect of gastrin-releasing peptide on gastrin and somatostatin messenger RNAs in humans infected with Helicobacter pylori. Gastroenterology 1997;112:1940–7. [DOI] [PubMed] [Google Scholar]
- 9.Mihaljevic S, Katicic M, Karner I, et al. The influence of Helicobacter pylori infection on gastrin and somatostatin values present in serum. Hepatogastroenterology 2000;47:1482–4. [PubMed] [Google Scholar]
- 10.Sumii M, Summi K, Tari A, et al. Expression of antral gastrin and somatostatin mRNA in Helicobacter pylori-infected subjects. Am J Gastroenterol 1994;89:1515–19. [PubMed] [Google Scholar]
- 11.Tzaneva M. Light and electron microscopic immunohistochemical investigation on G and D cells in antral mucosa in Helicobacter pylori-related gastritis. Exp Toxicol Pathol 2001;52:523–8. [DOI] [PubMed] [Google Scholar]
- 12.Kaneko H, Nakada K, Mitsuma T, et al. Helicobacter pylori infection induces a decrease in immunoreactive-somatostatin concentration of human stomach. Dig Dis Sci 1992;37:409–16. [DOI] [PubMed] [Google Scholar]
- 13.Moss SF, Legon S, Bishop AE, et al. Effect of Helicobacter pylori on gastric somatostatin in duodenal ulcer disease. Lancet 1992;340:930–2. [DOI] [PubMed] [Google Scholar]
- 14.Odum L, Petersen HD, Andersen IB, et al. Gastrin and somatostatin in Helicobacter pylori infected antral mucosa. Gut 1994;35:615–18. [DOI] [PMC free article] [PubMed] [Google Scholar]
- 15.Queiroz DMM, Mendes EN, Rocha GA, et al. Effect of Helicobacter pylori eradication on antral gastrin- and somatostatin-immunoreactive cell density and gastrin and somatostatin concentrations. Scand J Gastroenterol 1993;28:858–64. [DOI] [PubMed] [Google Scholar]
- 16.Tham TC, Chen L, Dennison N, et al. Effect of Helicobacter pylori eradication on antral somatostatin cell density in humans. Eur J Gastroenterol Hepatol 1998;10:289–91. [DOI] [PubMed] [Google Scholar]
- 17.Queiroz DM, Moura SB, Mendes EN, et al. Effect of Helicobacter pylori eradication on G cell and D cell density in children. Lancet 1994;343:1191–3. [DOI] [PubMed] [Google Scholar]
- 18.Marshall BJ, Warren JR. Unidentified curved bacilli in the stomach of patients with gastritis and peptic ulceration. Lancet 1984;2:1311–15. [DOI] [PubMed] [Google Scholar]
- 19.Owen DA. Stomach. In: Stephen S, Sternberg S, eds. Histology for pathologists. New York: Raven Press, 1992:533–45.
- 20.Levi S, Beardshall K, Haddad G, et al. Campylobacter pylori and duodenal ulcers: the gastrin link. Lancet 1989;i:1167–8. [DOI] [PubMed] [Google Scholar]
- 21.Parenter F, Maconi G, Sangaletti O, et al. Behaviour of acid secretion, gastrin release, serum pepsinogen I and gastric emptying of liquids over six months from eradication of Helicobacter pylori in duodenal ulcer patients. A controlled study. Gut 1995;37:210–15. [DOI] [PMC free article] [PubMed] [Google Scholar]
- 22.Moss SF, Calam J. Acid secretion and sensitivity to gastrin in patients with duodenal ulcer: effect of eradication of Helicobacter pylori. Gut 1993;34:888–92. [DOI] [PMC free article] [PubMed] [Google Scholar]
- 23.Iijiman K, Ohara S, Sekine H, et al. Changes in gastric acid secretion assayed by endoscopic gastric test before and after Helicobacter pylori eradication. Gut 2000;46:20–6. [DOI] [PMC free article] [PubMed] [Google Scholar]
- 24.Gisbert JP, Boixeda D, Al-Mostafa A, et al. Basal and stimulated gastrin and pepsinogen levels after eradication of Helicobacter pylori: a 1-year follow-up study. Eur J Gastroenterol Hepatol 1999;11:189–200. [DOI] [PubMed] [Google Scholar]
- 25.Furata T, Baba S, Takashima M, et al. Effects of Helicobacter pylori infection on gastric juice pH. Scand J Gastroenterol 1998;33:357–63. [DOI] [PubMed] [Google Scholar]
- 26.Sankey EA, Helliwell PA, Dhillon AP. Immunostaining of antral gastrin cells is quantitatively increased in Helicobacter pylori gastritis. Histopathology 1990;16:151–5. [DOI] [PubMed] [Google Scholar]
- 27.Graham DY, Go MF, Lew GM, et al. Helicobacter pylori infection and exaggerated gastrin release. Effects of inflammation and progastrin processing. Scand J Gastroenterol 1993;28:690–4. [DOI] [PubMed] [Google Scholar]
- 28.Blaser MJ. Hypotheses on the pathogenesis and natural history of Helicobacter pylori-induced inflammation. Gastroenterology 1992;102:720–7. [DOI] [PubMed] [Google Scholar]
- 29.Graham DY, Lew GM, Lechago J. Antral G cell and D cell numbers in Helicobacter pylori infection: effect of H. pylori eradication. Gastroenterology 1993;104:1655–60. [DOI] [PubMed] [Google Scholar]
- 30.Sirigu F, Capeccioni S, Masia AM, et al. Effect of Helicobacter pylori colonization on quantitative distribution of antral G cells in apparently healthy subjects and in duodenal ulcer patients. A morphometric study. Ital J Gastroenterol 1993;25:318–20. [PubMed] [Google Scholar]
- 31.Vaananen H, Vauhkonen M, Helske T, et al. Non-endoscopic diagnosis of atrophic gastritis with a blood test. Correlation between gastric histology and serum levels of gastrin-17 and pepsinogen I: a multicentre study. Eur J Gastroenterol Hepatol 2003;15:885–91. [DOI] [PubMed] [Google Scholar]
- 32.Sipponen P, Ranta P, Helske T, et al. Serum levels of amidated gastrin-17 and pepsinogen I in atrophic gastritis: an observational case–control study. Scand J Gastroenterol 2002;37:785–91. [PubMed] [Google Scholar]


