In the recent paper by Feltgen and colleagues,1 the intraocular pressure (IOP) was measured by Goldmann applanation tonometry and by using a cannula inserted into the anterior chamber connected with a pressure transducer. Thus, the measurement took place omitting a possible influence of the cornea on the result. Marx et al2 believed that by intracameral measurement the “true” intraocular pressure may be measured. Feltgen et al share his opinion. They believe, therefore, that they have compared the intraocular pressure measured with and without the possible influence of the cornea.
Feltgen et al write in their conclusion: “There is no systematic error of applanation tonometry with increasing central corneal thickness (CCT). Therefore it is inadequate to recalculate IOP based on regression formula of applanatory IOP versus CCT.” They base their conclusion on their results. In our opinion their paper shows the following methodological deficits: (1) Both methods used for measuring IOP are not up to the demands of the scientific technique of measurement; (2) their intracamerally measured IOP values do not reflect the true IOP because of bias; (3) a non-significant regression coefficient does not prove that the slope is actually 0 and, therefore, by a non-significant regression coefficient it is not proved that applanatory readings are not influenced by CCT; (4) the goodness of fit of the linear regression model is insufficient; and (5) an important covariate (true IOP value) was omitted in the linear regression. We would like to discuss these points in detail.
In the study of Feltgen et al the only criterion for the quality of measurement is the stability of the readings on the monitor. However, it is not sufficient to conclude from the presence of stability that the scale readings represent the “true” pressure value that is at the tip of the cannula. If there were a barrier inside the cannula the reading on the monitor would also be stable but would not represent the pressure at the tip. There are many pitfalls in pressure measurements by thin tubes that we know from our own studies.3,4 Minute air bubbles or tiny particles influence the result a great deal. If we want to know that a display reading represents the quantity in question then we have to guarantee that the measurement system has the opportunity to react freely to changes in the quantity. This guarantee can be obtained by feeding a known signal to the input of the system and by observing the output. If the output reacts in the expected way then the guarantee is given. Ehlers et al5 realised this in their rabbit experiments and we in electrophysiology.6–9 As long as this demand is not met the results are not definitive, giving cause for criticism and leading to misinterpretations.
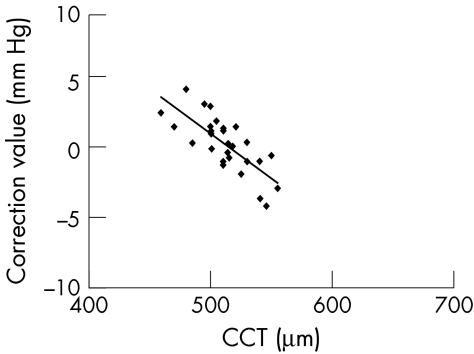
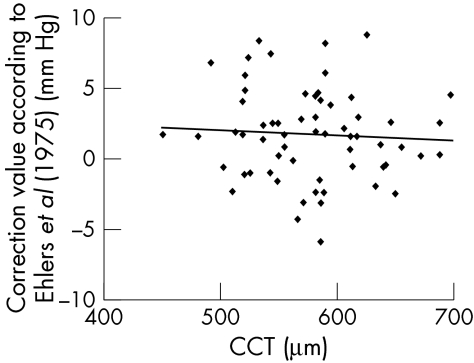
Feltgen et al write in their paper (p 86): “ …however, we believe intracamerally measured IOP values reflect the `true' IOP more accurately.” Scientific facts should not be a matter of belief. The belief of the authors in the values they measured is not justified. In the study under discussion their figure 2 shows the scatter plot of the pressure differences versus central corneal thickness. From this diagram and from their statistical calculations the authors draw their conclusions. Their results are quite different from those of Ehlers et al5 shown in figure 4 of their paper. Thus we must compare these two data sets. To facilitate this task, we have digitised the data presented in the figures of Feltgen et al and of Ehlers et al. They are shown here in Figures 1 and 2 on the same scale. The difference is striking.
Figure 2 .
Dependence of differences in IOP measurements from CCT. Data of figure 4 of Ehlers et al5 obtained by digitisation. All data points could be identified. Thus n = 29. Same scale as in Figure 1.
Figure 1 .
Dependence of differences in IOP measurements from CCT. Data of figure 2 of Feltgen et al obtained by digitisation; 68 of the 73 data points could be identified. The four outliers shown by Feltgen et al as open circles are omitted. These outliers would have made the use of the same scale in both diagrams more difficult. Thus n = 64. Same scale as in Figure 2.
Let's first consider a possible reason from the physical point of view. Ehlers et al5 reduced the pressure measurement to a basic physical quantity, here to the length of a water column. We can, therefore, trust the results of Ehlers et al more than the results of Feltgen et al who used a pressure transducer which has a zero point fluctuation up to 4.5 mm Hg (Abbott GmbH, data file). It is recommended also by the manufacturer that the zero point of the measurement system has to be determined for each patient by comparison with a water column (Dr Beer, Abbott GmbH, Wiesbaden, personal communication). This procedure is not described by Feltgen et al.
Therefore, none of the methods used in the article by Feltgen et al may be called a reference method and all methods may be prone to error and bias. Hence, analysis of differences in IOP between these models is inappropriate in order to decide on the necessity of a conversion formula.
Further, the variability of differences is large, which is probably the result of errors in the intracameral measurement of IOP. Regression lines with a small non-significant slope (0.38 mm Hg IOP difference per 0.1 mm cornea thickness in the article by Feltgen et al may occur in both situations where variability is both high and low. Only, in the latter case, when—as a consequence of the small variability—the confidence interval for the slope is narrow, may this be interpreted in the way that the covariate included in the model (that is, CCT) has no effect. If the variability is high and the slope is approximately 0, this may lead to the conclusion that IOP measurement is inappropriate because of too large an error. This conclusion is allowed if no other essential covariates were overlooked. If variability is high and the slope of the regression line is near 0, a large p value may not be interpreted as a proof of no effect of the covariate considered in the regression model. For better interpretation of the results a confidence interval for the estimated slope would have been much more appropriate than a p value.
As a consequence, the differences between measurements from applanation tonometry and a reference method, like the intraocular hydrostatic pressure done by Ehlers et al, should be evaluated first. If measurements by applanatory IOP are highly correlated with measurements by the reference method a conversion formula may be derived from linear regression. Under the assumption of small variability of residuals (difference between observed value and regression line)—that is, a satisfactory goodness of fit (for example, r2≥60%), results may lead to the recommendation of the use of a conversion formula. In contrast, Feltgen et al report an r2 of 0.2%. Only for small residuals, a slope approximately 0, and a confidence interval with limits near to 0, may the recommendation that a conversion formula is not necessary be given.
Moreover, the large variability in IOP differences may occur because Feltgen et al did not adjust for “true” intraocular hydrostatic pressure as Ehlers et al did. Since Ehlers et al calculated separate linear regression models for 10 mm Hg and 30 mm Hg which resulted in different intercepts and slope parameters, this might be another source of variation in the IOP differences from Feltgen et al which were unadjusted.
We hope our arguments are convincing and ask that you bring them to the attention of your readers.
References
- 1.Feltgen N, Leifert D, Funk J. Correlation between central corneal thickness, applanation tonometry, and direct intracameral IOP readings. Br J Ophthalmol 2001;85:85–7. [DOI] [PMC free article] [PubMed] [Google Scholar]
- 2.Marx W, Madjlessi F, Reinhard T, et al. [More than four years' experience with electronic intraocular needle tonometry] Mehr als vier Jahre Erfahrung mit der elektronischen intraokularen Nadel-Druckmessung bei irregularen Hornhauten. Ophthalmologe 1999;96:498–502. [DOI] [PubMed] [Google Scholar]
- 3.Stodtmeister R, Kästner R, Pillunat LE. Saugnapfmethoden. In: Straub W, Kroll P, Küchle HJ, eds. Augenärztliche Untersuchungsmethoden. 1st ed. Stuttgart: Ferdinand Enke, 1995:436–61.
- 4.Stodtmeister R, Hornberger M, Hofer M, et al. Okulo-Oszillo-Dynamographie nach Ulrich und Ulrich: Ergebnisse bei Augengesunden. Klin Monatsbl Augenheilkd 1988;192:219–33. [DOI] [PubMed] [Google Scholar]
- 5.Ehlers N, Bramsen T, Sperling S. Applanation tonometry and central corneal thickness. Acta Ophthalmol (Copenh) 1975;53:34–43. [DOI] [PubMed] [Google Scholar]
- 6.Stodtmeister R, Wilmanns I. Bandpass measurements in the electroretinographic electrode circuit. Albrecht Von Graefes Arch Klin Exp Ophthalmol 1978;208:263–7. [DOI] [PubMed] [Google Scholar]
- 7.Stodtmeister R, Wilmanns I. Changes of the current pathways in the eye due to coating agents during electroretinography. Albrecht Von Graefes Arch Klin Exp Ophthalmol 1978;208:255–60. [DOI] [PubMed] [Google Scholar]
- 8.Stodtmeister R, Wilmanns I, Koenig A, et al. EEG-Registrierung beim Hirntod. Prakt Anaesth 1978;13:446–9. [PubMed] [Google Scholar]
- 9.Wilmanns I, Stodtmeister R. Ein neues Verfahren zur Kalibrierung elektrophysiologischer Untersuchungseinheiten. Albrecht Von Graefes Arch Klin Exp Ophthalmol 1977;205:33–9. [DOI] [PubMed] [Google Scholar]


