Abstract
Aims: To assess the intraobserver agreement, interobserver agreement, and the agreement between a digital stereo optic disc camera (Discam) and Heidelberg retina tomograph (HRT) in measuring area cup-disc ratio (ACDR) and radial cup-disc ratio (RCDR) by two observers.
Methods: The optic discs of 78 eyes of 39 people (17 cases of primary open angle glaucoma, eight normal tension glaucoma, two ocular hypertension, and 12 normal subjects) were imaged with Discam and HRT. Two observers independently drew the disc margins on the HRT mean topography images and the disc and cup margins on the Discam images. ACDR and the RCDR at various angles were measured with the two systems. Intraobserver agreement, interobserver agreement, and the agreement between the two systems were assessed by 95% tolerance limit of changes (TC) and intraclass correlation coefficient (ICC).
Results: Eight eyes were excluded due to poor image quality (six Discam and two HRT). 70 eyes were analysed. The intraobserver ACDR agreement was almost perfect in both systems (ICCs = 0.97 and 0.92, and TCs = 11.0% and 15.1% in HRT and Discam respectively). The interobserver ACDR agreement was almost perfect in HRT (ICC = 0.97) and substantial in Discam (ICC = 0.79), (TCs = 10.5% and 24.5% respectively). The ACDR agreement between the two systems was substantial in observer A (ICC = 0.67) and moderate in observer B (ICC = 0.53), (TCs = 24.8% and 46.7% respectively). The HRT measured the ACDR significantly larger than the Discam (p <0.001), and the differences were significantly larger in the glaucomatous group (p <0.001). RCDR agreement between the two systems was fair to substantial in observer A (ICC = 0.36 to 0.74) and slight to moderate in observer B (ICC = 0.12 to 0.45). Both observers achieved the best RCDR agreement between the two systems at the inferior optic disc position.
Conclusion: There is almost perfect intraobserver agreement in each system. The interobserver agreement was better with the HRT than the Discam. There was substantial variation in ACDR and RCDR agreement between the two systems measured by the two observers. The variation in ACDR and RCDR measurements between the two systems may be too large for interchangeable use in a clinical setting.
Keywords: optic discs, Discam, Heidelberg retina tomograph
Optic disc assessment is important for early detection, monitoring, and management of glaucoma patients. Clinical evaluation of optic disc parameters with direct or indirect ophthalmoscopy has been shown to be poor among glaucoma specialists.1,2 The use of stereoscopic optic disc photography to assess optic discs has been shown to reduce the variability in assessing the vertical and horizontal cup-disc ratios.3,4 However, intraobserver agreement has been shown to be better than the interobserver agreement, and the interobserver agreement improves with observer experience.5 Recently, a digital optic disc stereoscopic camera known as Discam (Marcher Enterprises Ltd, Hereford, UK) has become available. This device allows rapid acquisition and storage of a pair of monochromatic stereoscopic optic disc images. The observer draws the disc and cup margins on the monitor for the computer to compute various cup-disc ratio parameters. Shuttleworth et al recently reported good intraobserver and interobserver agreement with this device.6
The development of the scanning laser ophthalmoscope in the late 1980s has provided a more objective and repeatable way of assessing optic disc parameters. Previous studies have shown high reproducibility with this device.7,8 Agreement between cup-disc ratios measured by stereoscopic optic disc photography and Heidelberg retina tomograph has been investigated in the past.9,10 However, as far as we know, there has been no report on the agreement in cup-disc ratio parameters between the scanning laser tomography and the digital stereoscopic optic disc camera. In this study we assessed intraobserver agreement, interobserver agreement in each system and agreement between the two systems.
METHODS
Seventy eight eyes of 27 patients from the glaucoma clinic and 12 normal volunteer subjects were recruited in the study. Subjects in this study were recruited in accordance with the tenets of the Helsinki agreement. The research was approved by the ethics committee of Queen's Medical Centre, University Hospital NHS Trust. All patients from the glaucoma clinic had automated central 24 degrees visual fields plotted with Humphrey field analyser (Humphrey Instruments Inc, San Leandro, CA, USA) within 6 months of examination. Primary open angle glaucoma (n=17) was defined as (i) an intraocular pressure consistently above 21 mm Hg without antiglaucoma treatment, (ii) normal drainage angle and anterior chamber appearance with no apparent ocular abnormality that may account for the elevated IOPs, (iii) typical glaucomatous visual field defects and/or optic nerve head damage. Normal tension glaucoma (n=8) was defined as (I) an IOP never documented above 21 mm Hg, (ii) normal drainage angle and anterior chamber appearance, (iii) typical glaucomatous optic nerve head damage and visual field damage. Ocular hypertension (n=2) was defined as (i) an IOP above 21 mm Hg on two or more occasions, (ii) normal drainage angle and anterior chambers, (iii) normal optic discs and visual fields. All normal subjects (n=12) had full ophthalmological examinations and visual fields plotted by a Friedmann Mark I visual field analyser. All had a visual acuity of 6/9 or better, normal optic disc appearance and normal visual field tests. All subjects had a refractive error of within 5 dioptres from emmetropia.
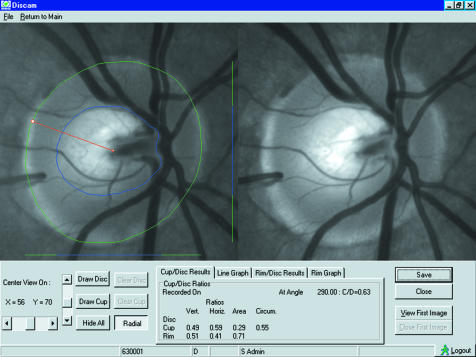
The Discam (Marcher Enterprises Ltd, Hereford, UK)11 is a digital stereoscopic optic disc camera. A built-in rapidly moving shutter inside the camera captures sequential images of the optic discs at a viewpoint of about 20 degrees at the optic disc. A pair of monochromatic disc images (512 × 512 pixels) of slight disparity is projected onto the monitor. The stereoscopic images are viewed with a stereoviewer (ScreenVu) by the clinicians and the cup and disc margins of the optic discs are then drawn with a computer mouse. Discam software version 3.0 was used to analyse the images. The vertical cup-disc ratio, horizontal cup-disc ratio, perimeter cup-disc ratio and area cup-disc ratio are automatically calculated. Radial cup-disc ratios can be obtained by moving the pointer with the computer mouse to the point of interest near the disc margin. A radial marker, based upon the disc centre, will produce the radial cup disc ratio at that angle. Figure 1 shows a screen capture picture of the Discam software of an eye of a normal subject in the study.
Figure 1.
A screen capture picture of the Discam software showing a pair of stereoscopic optic disc images of an eye of a normal subject in the study. Observer A estimated the optic disc and cup margins.
The Heidelberg retinal tomograph (HRT, Heidelberg Engineering, Heidelberg, Germany)12 is a confocal scanning laser ophthalmoscope utilising a diode laser source with a wavelength of 670 nm. Three dimensional retinal topography is generated from 32 consecutive and equidistant two dimensional optical image sections each consisting of 256 × 256 pixel elements. A field size of 15 × 15 degrees was used for image capture, and software version 2.01 was used to analyse the topography images. The standard reference plane is defined as 50 μm posterior to the mean retinal surface of a segment of 6 degrees starting from 4 degrees below the temporal-horizontal position of the disc margin, which is defined by the contour line drawn by the clinician. The area cup-disc ratio is computed from the stereometric analysis of segment 0–360 degrees by the HRT software. Radial cup-disc ratios with the centre of the contour circle at the disc margin as centre can be computed by entering the degree of the angle of interest as the segment limit of the stereometric analysis of the HRT software.
Both eyes of each subject were imaged by both systems, by one examiner (VCTS), on the same day. Pupils were dilated by one drop of 1% tropicamide. At least three HRT images and Discam images were taken from each eye. The mean HRT topography was computed from three topography images with the HRT software. A good quality Discam image was chosen for each optic disc. Two ophthalmology trainees were defined as observer A and B (VCTS and AB respectively), both with at least 5 years of clinical experience in ophthalmology. They have similar stereopsis, both measured to be 30 second of arc by TNO random dot test (Lameris Ootech BV, Netherlands). Each observer independently drew the optic disc margins on the HRT mean topography images and the cup and disc margin of the chosen Discam optic disc images while being masked from the diagnosis and each other's drawings. In addition, observer A redrew the HRT mean topography images and the Discam images of the same group of eyes 3 months later. The area cup-disc ratio (ACDR), the radial cup-disc ratio (RCDR) at superotemporal, inferotemporal, superior, temporal, inferior, and nasal positions of both HRT and Discam disc images were computed. Intraobserver agreement, interobserver agreement, and the agreement between the two systems in assessing these cup-disc ratio parameters were assessed by methods described by Bland and Altman.13 We also used intraclass correlation coefficient (ICC) to assess the level of agreement as described by Fleiss and Cohen.14 Table 1 shows the interpretation of the ICC as described by Landis and Koch.15 Shrout and Fleiss described six kinds of ICCs.16 The two way mixed effects model and single measure reliability of the reliability analysis of spss for Windows version 9 (SPSS Inc, Chicago, IL, USA) was used in the study. The HRT and Discam (judges) were considered fixed effect, while the cup-disc ratios measured by these two systems (targets) were considered random effects. The 95% tolerance limit of change (TC) is 1.96 times the standard deviation of the difference between two measurements divided by the range of the average of the two measurements. This expresses the tolerance for change as a percentage of the range of the average of the two measurements. Paired t tests and unpaired t tests were used to test for significant differences between measurements, with a p value <0.05 considered significant.
Table 1.
Interpretation of intraclass correlation coefficients (ICC)
| ICC | Agreement |
| 1.0 | Perfect agreement |
| 0.99 to 0.81 | Almost perfect agreement |
| 0.80 to 0.61 | Substantial agreement |
| 0.60 to 0.41 | Moderate agreement |
| 0.40 to 0.21 | Fair agreement |
| 0.20 to 0.01 | Slight agreement |
| 0.0 to −0.1 | Poor agreement |
RESULTS
Seventy eight eyes of 39 subjects were recruited to the study. Six eyes (7.7%) with poor Discam images were excluded from the study because of lenticular opacities or a poorly dilated pupil. Two eyes (2.6%) had poor mean HRT topography images because of excessive eye movement. A total of 70 eyes were successfully analysed, the patient demography and diagnoses are listed in Table 2.
Table 2.
Patient demographic data and diagnosis
| Normal | POAG | NTG | OHT | Total | |
| Number of patients | 12 | 17 | 8 | 2 | 39 |
| Mean age (mean (SD)) | 42.9 (8.1) | 73.4 (9.9) | 59.1 (14.9) | 61.5 | 60.6 (16.6) |
| Male | 1 | 9 | 1 | 2 | 13 |
| Female | 11 | 8 | 7 | 0 | 26 |
| Number of eyes analysed | 23 | 29 | 15 | 3 | 70 |
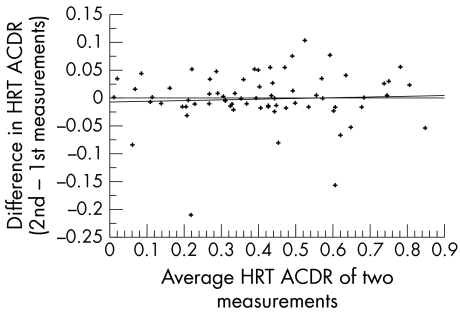
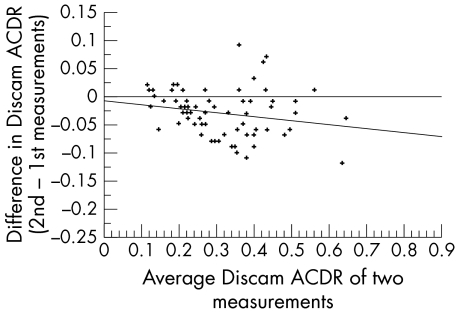
Table 3 shows the intraobserver agreement between the first and second measurements of both HRT and Discam ACDRs by observer A. There were 3 month intervals between the first and second measurements to reduce the possibility of prejudice caused by memory. There was almost perfect intraobserver agreement in both HRT and Discam in the measurement of ACDRs. The ICCs were 0.97 and 0.92 respectively. The Discam had slightly higher TCs, at 11% and 15% in HRT and Discam respectively. Plots of the differences of the two measurements against the average of the two measurements in HRT and Discam are shown in Figures 2 and 3 respectively. The regression plot of both graphs had insignificant slopes (R2 = 0.002 and 0.04 respectively).
Table 3.
Differences in measurements and their 95% confidence interval (CI), 95% limit of agreement, 95% tolerance for change, and the intraclass correlation coefficients (ICC) and their 95% CI of (i) second reading − first reading of area cup-disc ratio (ACDR) measured with HRT and Discam by observer A, (ii) observer A − observer B estimation of ACDR measured by HRT and Discam, and (iii) HRT − Discam when measuring ACDR by observer A and B
| Differences between measurements (mean (SD)) | 95% confidence interval (CI) | 95% limit of agreement (mean (2SD)) | 95% tolerance for change | ICC (95% CI) | |
| HRT ACDR 2nd reading − 1st reading (observer A) | −0.003 (0.047) | −0.015 to 0.009 | −0.1 to 0.009 | 11.04 | 0.97 (0.96 to 0.98) |
| Discam ACDR 2nd reading − 1st reading (observer A) | −0.029 (0.041) | −0.039 to –0.019 | −0.11 to 0.05 | 15.09 | 0.92 (0.76 to 0.97) |
| HRT ACDR (observer A − observer B) | −0.023 (0.043) | −0.033 to −0.013 | −0.11 to 0.063 | 10.46 | 0.97 (0.94 to 0.99) |
| Discam ACDR (observer A − observer B) | −0.029 (0.0770) | −0.047 to −0.011 | −0.18 to 0.125 | 24.54 | 0.79 (0.66 to 0.87) |
| HRT ACDR − Discam ACDR observer A | −0.082 (0.122) | −0.11 to −0.052 | −0.33 to 0.16 | 24.78 | 0.67 (0.33 to 0.82) |
| HRT ACDR − Discam ACDR observer B | −0.075 (0.16) | −0.037 to 0.11 | −0.25 to 0.40 | 46.67 | 0.53 (0.30 to 0.70) |
Figure 2.
Regression plot of difference in HRT ACDR against the average of HRT ACDR in two measurements for observer A (R2 = 0.002, p = 0.7).
Figure 3.
Regression plot of difference in Discam ACDR against the average of Discam ACDR in two measurements for observer A (R2 = 0.04, p = 0.08).
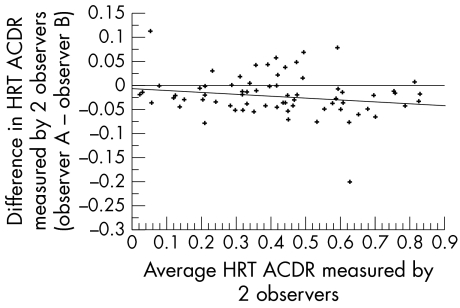
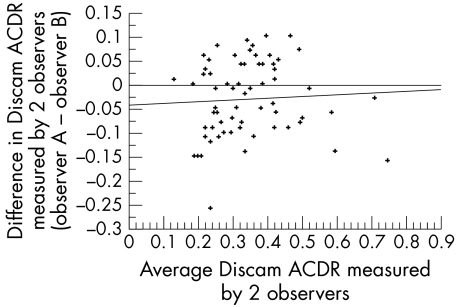
Table 3 also shows the agreement between observer A and observer B in the measurement of the ACDR with the HRT and Discam systems. The interobserver agreement in HRT was almost perfect (ICC = 0.97), whereas the Discam interobserver agreement was substantial (ICC = 0.79). The TCs were lower with the HRT than with the Discam, at 10.5% and 24.5% respectively. Figures 4 and 5 show the regression plots of the differences in ACDR measurements by observer A and observer B against the average of the two measurements. The regression lines of both graphs have insignificant slopes (R2 = 0.03 and 0.003 in HRT and Discam respectively). Table 4 shows the intraobserver agreement and interobserver agreement in measuring the vertical cup-disc ratio, horizontal cup-disc ratio, and perimeter cup-disc ratio with the Discam.
Figure 4.
Regression plot of difference in HRT ACDR against the average of HRT ACDR in two measurements from observer A and observer B (R2 = 0.03, p = 0.15).
Figure 5.
Regression plot of difference in Discam ACDR against the average of Discam ACDR in two measurements from observer A and observer B (R2 = 0.003, p = 0.64).
Table 4.
The intraclass correlation coefficients (ICC) and their 95% confidence interval (CI) of within observer (observer A) and between observers (observer A − observer B) in measuring vertical cup-disc ratio, horizontal cup-disc ratio and perimeter cup-disc ratio by Discam
| Vertical cup-disc ratio | Horizontal cup-disc ratio | Perimeter cup-disc ratio | |
| ICC (95% CI) | ICC (95% CI) | ICC (95% CI) | |
| Within observer (observer A) | 0.93 (0.86–0.96) | 0.90 (0.80–0.94) | 0.93 (0.77–0.97) |
| Between observers (observer A − observer B) | 0.70 (0.56–0.80) | 0.67 (0.50–0.78) | 0.69 (0.54–0.80) |
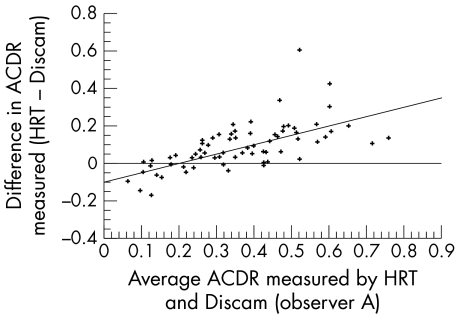
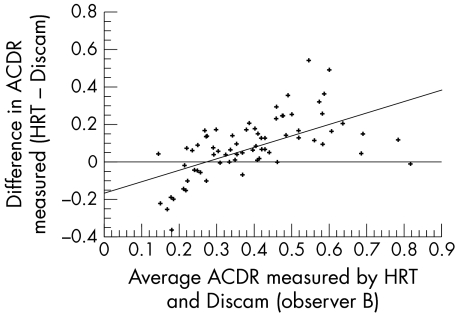
Comparison of the agreement between the HRT and Discam in measuring the ACDR taken by observer A and observer B is shown in Table 3. The agreement between the HRT and Discam measurements was better with observer A than observer B. The ICCs showed substantial agreement in observer A and moderate agreement in observer B (0.67 and 0.53 in HRT and Discam respectively). However, the 95% tolerance for change was rather large, being 24.8% and 46.7% in observer A and observer B respectively. Figures 6 and 7 show the regression plots of the difference in ACDR measured by the HRT and Discam against the average of the two measurements from both observer A and B. The slopes of the regression line in both graphs are significant (R2 = 0.42 and 0.36 in observer A and B respectively, p <0.0001 in both observers). This indicates that the HRT consistently measures a larger ACDR than the Discam in discs with larger cup size and vice versa. The HRT measured the ACDR significantly larger than Discam by an average of 0.08 estimated by both observers (p <0.001, paired t tests) (Table 5). Subgroup analysis of optic discs with glaucomatous appearance (POAG and NTG) and normal appearance (normal and OHT) showed that the glaucomatous group had significantly larger differences between the HRT and Discam when estimating ACDR by both observers (p <0.001, unpaired t tests) (Table 6).
Figure 6.
Regression plot of difference in ACDR measured by the HRT and Discam against the average ACDR in two measurements from observer A (R2 = 0.42, p <0.0001).
Figure 7.
Regression plot of difference in ACDR measured by the HRT and Discam against the average ACDR in two measurements from observer B (R2 = 0.36, p <0.0001).
Table 5.
The mean and standard deviations and the mean differences in ACDRs measured by the HRT and Discam in both observers
| HRT ACDR | Discam ACDR | |||
| Mean (SD) | Mean (SD) | Mean differences (HRT – Discam ACDR) | Paired t test | |
| Observer A | 0.50 (0.18) | 0.38 (0.12) | 0.08 (0.12) | <0.001 |
| Observer B | 0.52 (0.19) | 0.40 (0.13) | 0.08 (0.16) | <0.001 |
Table 6.
The means and standard deviations of ACDR differences (HRT − Discam) in eyes with glaucomatous and normal optic disc appearances by both observers
| ACDR differences (HRT − Discam) mean (SD) | |||
| Glaucomatous (n = 44) | Normal (n = 26) | Unpaired t tests p value | |
| Observer A | 0.12 (0.12) | −0.03 (0.14) | <0.001 |
| Observer B | 0.12 (0.15) | −0.01 (0.14) | <0.001 |
Table 7 compares the agreement in measuring the RCDRs at various radial positions with the HRT and Discam in both observers. The positions considered were superotemporal, inferotemporal, superior, temporal, inferior, and nasal positions of the optic discs. The ICCs ranged from the lowest at the temporal position (0.36 and 0.12 with observers A and B respectively) to the highest at the inferior position (0.74 and 0.45 with observers A and B respectively) in both observers.
Table 7.
The intraclass correlation coefficients (ICC) and their 95% confidence interval (CI) between the HRT and Discam measurement of radial cup-disc ratio (RCDR) at different positions by observer A and B
| Observer A | Observer B | |
| ICC (95% CI) | ICC (95% CI) | |
| Superotemporal | 0.47 (0.27 to 0.64) | 0.23 (0.01 to 0.44) |
| Inferotemporal | 0.51 (0.24 to 0.70) | 0.22 (−0.0001 to 0.42) |
| Superior | 0.57 (0.39 to 0.71) | 0.33 (0.11 to 0.52) |
| Temporal | 0.36 (−0.05 to 0.63) | 0.12 (−0.07 to 0.32) |
| Inferior | 0.74 (0.61 to 0.83) | 0.45 (0.24 to 0.62) |
| Nasal | 0.52 (0.32 to 0.67) | 0.37 (0.15 to 0.55) |
DISCUSSION
Assessment of optic disc cupping is of paramount importance in glaucoma management. Previous studies have shown that optic disc damage commonly preceded visual field loss.17,18 Therefore, a reproducible method of assessing the optic disc cupping is important in detecting early progression in glaucomatous optic nerve head damage. Lichter et al demonstrated intraobserver agreement and interobserver agreement in estimating cup-disc ratio was better with stereoscopic than monoscopic photographs.19 However the traditional way of obtaining stereoscopic optic disc photographs by using a stereoscopic fundus camera is cumbersome and time consuming. The modern digital camera technology permits a cheap and effective way of capturing, storing, and analysing digital stereoscopic optic disc images.
In this study, one observer achieved almost perfect intraobserver agreement in assessing the ACDRs with the Discam (ICC = 0.92). In addition, the interobserver agreement between the two observers was substantial (ICC = 0.79). Since the same Discam images were used in intraobserver and interobserver studies, variability in images taken from the same eyes has been eliminated. The results of this study confirmed a common observation that the variability in assessing various cup-disc ratio parameters is higher between observers than within observers themselves.3–5,20,21 On the other hand, the results of this study compare favourably with previous studies on traditional colour stereoscopic optic disc photographs. Varma et al studied the intraobserver and interobserver agreement among glaucoma experts in assessing optic discs in monoscopic and stereoscopic conditions. The median weighted kappa (Kw) for intraobserver agreement was 0.79 for both monoscopic and stereoscopic conditions. For interobserver agreement, the median weighted kappas were 0.57 and 0.67 in monoscopic and stereoscopic conditions respectively.4 Abrams et al studied the intraobserver and interobserver agreement among ophthalmologists, optometrists and residents in assessing the vertical cup disc ratio in stereoscopic conditions. They demonstrated good intraobserver agreement in all three groups (Kw = 0.69 – 0.79), and the interobserver agreement was significantly higher for ophthalmologists (Kw = 0.68) than for optometrists, and residents (Kw = 0.56).5 A recent study by Harper et al showed similar results to the others.21 They studied five observers (three optometrists and two ophthalmologists) grading vertical and horizontal cup-disc ratios on stereoscopic optic disc photographs. They found the Kw ranged from 0.70 to 0.84 within observers and from 0.23 to 0.64 between observers. However, our results are less favourable when compared with a recent study reported by Shuttleworth et al on the intraobserver and interobserver agreement in assessing various cup-disc ratio parameters with the same system.6 They demonstrated almost perfect intraobserver and interobserver agreement when two observers measured the ACDR (ICCs of 0.96 and 0.92 respectively). This study showed exceptionally good agreement between observers when compared with other studies using a stereoscopic photograph technique. The observers in this study may have better standardisation of optic cup delineation. The mouse cursor used in the Discam to draw the disc and cup margins was not set in depth at the plane of interest, and this may induce error during drawing from parallax effect. Nevertheless, optic cup margin estimation in stereoscopic methods is still the main source of variability in optic disc assessment.
Scanning laser tomography provides a reproducible, automatic three dimensional measurement of the topography of the optic discs.7,8,22 It allows an objective assessment of the optic cup margin by a predefined reference plane. Various studies have compared the HRT measurements with stereoscopic methods. Zangwill et al studied the agreement between clinician measurements and the scanning laser ophthalmoscope when measuring vertical and horizontal cup-disc ratios. They found agreement was moderate to substantial for vertical cup-disc ratios (Kw = 0.57 to 0.72) and fair to moderate for horizontal cup-disc ratios (Kw = 0.21 to 0.55) in three glaucoma experts.9 Hatch et al recently found that agreement between the planimetric method and HRT when measuring area cup-disc ratios was moderate to substantial in three observers (ICC = 0.57 to 0.65).10 These findings are comparable with the results of the present study, in which Discam and HRT ACDR agreement from two observers was moderate to substantial (ICC = 0.67 and 0.53 in observer A and B respectively). The previous two studies defined the reference plane to be at 320 μm below the retinal plane. In this study, we used the standard reference plane, which was set at 50 μm posterior to the mean retinal height of a temporal segment of 6 degrees starting from 4 degrees below the temporal-horizontal position of the contour line at the disc margin. When we performed the same analysis on the same set of data with the reference plane set at 320 μm below the retinal plane, the agreement results were very similar to the results we have presented here.
In this study, we found a linear relation between the difference in ACDR measurements (HRT − Discam) and the average ACDRs measured by the two methods (Figs 6 and 7). This indicates that the HRT tends to overestimate or the Discam underestimates the ACDR in eyes with larger optic disc cup size. On average, the HRT overestimated the Discam ACDR by 0.08 in this study. This is comparable with the results reported by Hatch et al.10 They found that the HRT overestimated the ACDR by 0.07 to 0.11 when compared with the planimetry obtained by three clinicians. Subgroup analysis showed the differences in measuring ACDR were significantly larger in eyes with glaucomatous optic disc appearance (Table 6). This is in agreement with previous studies by Dichtl et al and Jonas et al. Both studies compared the neuroretinal rim area measurement between a planimetric method and the HRT, using the same reference plane setting as in this study. They found that the HRT significantly overestimated the neuroretinal rim area compared with the planimetric method, and the differences were significantly larger in glaucomatous optic discs.23,24 They gave an explanation that the relative proportion of the size of the retinal vessels increases as the neuroretinal rim area decreases with the HRT method because of the algorithm of the HRT, whereas the loss of neuroretinal rim as assessed on the photograph outweighs the diminution of the retinal vessel calibre in eyes with glaucoma. One possible explanation of the discrepancies we found between the glaucomatous and normal optic disc when measuring ACDR in this study is that the HRT tends to measure the vertical optic disc diameter as smaller than the planimetric method by a constant amount (0.13 mm).25 This is probably due to a difference in pinpointing the Elshnig's ring between the two methods rather than a real “magnification” effect. The demarcation of the disc margins on the HRT images are dependent on the shape of the cup, the Elshnig's ring on the reflectivity image of the HRT is attenuated as the retinal surface is sloping towards the cup. This attenuation is especially more pronounced in discs with larger ACDR because of the steeper slope of the retinal surface. Logically, therefore, the HRT should produce a larger ACDR than the photographic method when measuring the same optic disc. This difference is proportionally larger in eyes with larger optic cup size, such as eyes with glaucomatous optic disc cupping.
Zangwill et al have studied the agreement between glaucoma expert evaluations of stereoscopic photographs and the HRT when measuring horizontal and vertical cup disc ratios.9 They found the difference was larger in normal subjects than in glaucoma patients. Apart from the effect of cup shape on the HRT reflectivity image as explained above, another reason for their findings is that the clinicians commonly measure the cup diameter at the centre of the cup, whereas the HRT measures the diameter of the cup as it passes through the vertical meridian of the disc. In glaucomatous eyes, a larger cup will have a wider area of the cup passing through the vertical meridian of the optic disc; therefore, the difference between the two methods of estimation will be less. This is why we did not compare the vertical and horizontal cup-disc ratios between the HRT and Discam because the HRT vertical and horizontal cup-disc ratios are obtained from the ratio of a straight line drawing through the centre of the discs as defined by the disc margin, whereas the Discam software calculates the vertical and horizontal cup-disc ratio from the widest part of the cup to the widest part of the disc on the vertical and horizontal axis respectively. Instead we compared the radial cup-disc ratios at various angles. Interestingly both observers showed better agreement between the HRT and Discam measurements at the inferior RCDR. This is likely to be due to the more abrupt edge of the optic cup and the lack of retinal blood vessels at the inferior position in most glaucomatous optic cups. The implication of this observation merits further study on their correlation with functional deficit—that is, visual field loss.
In this study, we demonstrated that both the HRT and Discam had almost perfect intraobserver agreement by one observer. The interobserver agreement was almost perfect with the HRT and substantial with the Discam. The agreement between the HRT and Discam when measuring ACDR was moderate to substantial by the two observers as measured by using the ICC, but the 95% tolerance of change are rather large at 24.8% and 46.7% by observers A and B respectively. This difference may not allow interchangeable use of the ACDR measured by the HRT with that measured by the Discam. This is also likely to be true when the ACDR measured by the HRT is compared with those measured by routine slit lamp biomicroscopic examination with 90 or 78 dioptre lenses. More training and standardisation in cup margin determination may improve the interobserver agreement in the Discam system. This study was limited by using only two observers. Further studies on the agreement between more observers with different experience in optic disc assessment will be useful to explore the value of more widespread use of this system. With the advent of telemedicine technology, the ease of acquiring and storing of digital optic disc images with this system may have some implication in the future communication between the optometrists and hospital ophthalmologists. This may facilitate shared care of some patients—for example, patients with ocular hypertension, between community optometrists and hospital ophthalmologists.
Acknowledgments
The paper was presented in part at: (1) the annual meeting of the Glaucoma Society (UK and Eire), London, UK in 2000, (2) the annual meeting of the Association for Research in Vision and Ophthalmology, Fort Lauderdale, Florida, USA in 2001, and (3) the annual meeting of the Royal College of Ophthalmologists, Birmingham, UK in 2001.
The authors have no proprietary interest in the instruments mentioned in this article.
REFERENCES
- 1.Kahn HA LH, Ganley JP, et al. Standardising diagnostic procedures. Am J Ophthalmol 1975;79:768–75. [PubMed] [Google Scholar]
- 2.Lichter PR. Variability of expert observers in evaluating the optic disc. Trans Am Ophthalmol Soc 1977;74:532–72. [PMC free article] [PubMed] [Google Scholar]
- 3.Tielsch JM, Katz J, Quigley HA, et al. Intraobserver and interobserver agreement in measurement of optic disc characteristics. Ophthalmology 1988;95:350–6. [DOI] [PubMed] [Google Scholar]
- 4.Varma R, Steinmann WC, Scott IU. Expert agreement in evaluating the optic disc for glaucoma. Ophthalmology 1992;99:215–21. [DOI] [PubMed] [Google Scholar]
- 5.Abrams LS, Scott IU, Spaeth GL, et al. Agreement among optometrists, ophthalmologists, and residents in evaluating the optic disc for glaucoma. Ophthalmology 1994;101:1662–7. [DOI] [PubMed] [Google Scholar]
- 6.Shuttleworth GN, Khong CH, Diamond JP. A new digital optic disc stereo camera: intraobserver and interobserver repeatability of optic disc measurements. Br J Ophthalmol 2000;84:403–7. [DOI] [PMC free article] [PubMed] [Google Scholar]
- 7.Kruse FE, Burk RO, Volcker HE, et al. Reproducibility of topographic measurements of the optic nerve head with laser tomographic scanning. Ophthalmology 1989;96:1320–4. [DOI] [PubMed] [Google Scholar]
- 8.Rohrschneider K, Burk RO, Kruse FE, et al. Reproducibility of the optic nerve head topography with a new laser tomographic scanning device. Ophthalmology 1994;101:1044–9. [DOI] [PubMed] [Google Scholar]
- 9.Zangwill L, Shakiba S, Caprioli J, et al. Agreement between clinicians and a confocal scanning laser ophthalmoscope in estimating cup/disk ratios. Am J Ophthalmol 1995;119:415–21. [DOI] [PubMed] [Google Scholar]
- 10.Hatch WV, Trope GE, Buys YM, et al. Agreement in assessing glaucomatous discs in a clinical teaching setting with stereoscopic disc photographs, planimetry, and laser scanning tomography. J Glaucoma 1999;8:99–104. [PubMed] [Google Scholar]
- 11.Marcher Enterprises Ltd. Discam user's manual software version 3.0. Hereford: Marcher Enterprises Ltd, 2000.
- 12.Heidelberg Engineering G. Heidelberg retina tomograph operation manual. Software Version 2.01. Heidelberg, Germany: Heidelberg Engineering, 1995.
- 13.Bland JM Altman DG. Statistical methods for assessing agreement between two methods of clinical measurement. Lancet 1986;1:307–10. [PubMed] [Google Scholar]
- 14.Fleiss JL, Cohen J. The equivalence of weighted kappa and the intraclass correlation coefficient as measures of reliability. Educ Psychol Meas 1973;33:613–19. [Google Scholar]
- 15.Landis JR, Koch GG. The measurement of observer agreement for categorical data. Biometrics 1977;33:159–74. [PubMed] [Google Scholar]
- 16.Shrout PE, Fleiss JL. Intraclass correlations: uses in assessing rater reliability. Psychological Bulletin 1979;86:420–8. [DOI] [PubMed] [Google Scholar]
- 17.Sommer A, Pollack I, Maumenee AE. Optic disc parameters and onset of glaucomatous field loss. I. Methods and progressive changes in disc morphology. Arch Ophthalmol 1979;97:1444–8. [DOI] [PubMed] [Google Scholar]
- 18.Pederson JE, Anderson DR. The mode of progressive disc cupping in ocular hypertension and glaucoma. Arch Ophthalmol 1980;98:490–5. [DOI] [PubMed] [Google Scholar]
- 19.Lichter PR. Variability of expert observers in evaluating the optic disc. Trans Am Ophthalmol Soc 1976;74:532–72. [PMC free article] [PubMed] [Google Scholar]
- 20.Klein BE, Moss SE, Magli YL, et al. Optic disc cupping as clinically estimated from photographs. Ophthalmology 1987;94:1481–3. [DOI] [PubMed] [Google Scholar]
- 21.Harper R, Reeves B, Smith G. Observer variability in optic disc assessment: implications for glaucoma shared care. Ophthalmic Physiol Opt 2000;20:265–73. [PubMed] [Google Scholar]
- 22.Chauhan BC, LeBlanc RP, McCormick TA, et al. Test-retest variability of topographic measurements with confocal scanning laser tomography in patients with glaucoma and control subjects. Am J Ophthalmol 1994;118:9–15. [DOI] [PubMed] [Google Scholar]
- 23.Dichtl A, Jonas JB, Mardin CY. Comparison between tomographic scanning evaluation and photographic measurement of the neuroretinal rim. Am J Ophthalmol 1996;121:494–501. [DOI] [PubMed] [Google Scholar]
- 24.Jonas JB, Mardin CY, Grundler AE. Comparison of measurements of neuroretinal rim area between confocal laser scanning tomography and planimetry of photographs. Br J Ophthalmol 1998;82:362–6. [DOI] [PMC free article] [PubMed] [Google Scholar]
- 25.Spencer AF, Sadiq SA, Pawson P, et al. Vertical optic disk diameter: discrepancy between planimetric and SLO measurements. Invest Ophthalmol Vis Sci 1995;36:796–803. [PubMed] [Google Scholar]


