Abstract
Background/aim: Intraocular pressure (IOP) is not a fixed constant value but rather has pulsatile components associated with cardiac action. The SmartLens dynamic observing tonometer (odc, Ophthalmic Development Company AG, Zurich, Switzerland) can measure and record simultaneously IOP and ocular pulse amplitude (OPA). It was the aim of this study to evaluate OPA in patients with primary open angle glaucoma (POAG) and high IOP, normal tension glaucoma (NTG), and ocular hypertension (OHT). Furthermore, the authors examined whether there were any correlations with blood pressure.
Methods: 80 subjects were divided into four groups (n=20): 20 patients each with POAG, NTG, and OHT and 20 volunteers without any ocular pathology except for cataract served as a control group.
Results: The OPA of the POAG group was not statistically significant different from the control group and from the OHT group. However, OPA was statistically significant lower (p<0.01) in the NTG group compared with all other groups. The OPA of the OHT group was slightly higher compared to the healthy volunteers (p=0.09) and to the POAG patients (p=0.09). No statistically significant correlations with blood pressure could be detected. A logistic regression model was established which identified OPA as an independent risk factor for NTG.
Conclusions: The study demonstrated a decrease in OPA of patients suffering from NTG. Thus, measuring of OPA by the SmartLens dynamic observing tonometer could be helpful in the detection of NTG patients.
Keywords: normal tension glaucoma, ocular pulse amplitude, tonometer, ocular hypertension
Other factors than intraocular pressure (IOP) such as cardiovascular diseases, systemic blood pressure, vasospasms, and migraine are involved in the pathogenesis of primary open angle glaucoma (POAG), especially of normal tension glaucoma (NTG).1–12 The importance of the perfusion pressure could be demonstrated4,13,14 and defects of blood flow in the optic disc, detected by fluorescein angiography, could be associated with glaucoma.15 The ocular pulse amplitude (OPA) could be a parameter of interest,16,17 since differences in OPA values were measured in ocular hypertension, normal tension, and chronic open angle glaucoma.17,18 The OPA depicts the pulsatile component of the intraocular blood flow and therefore could be a measure of ocular perfusion independent of baseline IOP.
The SmartLens dynamic observing tonometer (odc, Ophthalmic Development Company AG, Zurich, Switzerland) can measure and record simultaneously IOP and OPA.19,20 It was the aim of this study to evaluate OPA in patients suffering from POAG and high IOP, normal tension glaucoma (NTG), and ocular hypertension (OHT). Furthermore, the correlation of the OPA with systemic blood pressure, corneal thickness, and IOP was examined.
PATIENTS AND METHODS
Patients
The total of 80 eyes of 80 subjects without any corneal pathology were included; 38 subjects were female and 42 were male. The mean age was 65.2 years (range 20–94 years). Participants were divided into four groups (each group n = 20) according to the pre-existing history and the ophthalmological examination.
Group 1: Primary open angle glaucoma (POAG): IOP in patients’ history >21 mm Hg, glaucomatous optic disc damage, and corresponding visual field defect. 6 female, 14 male. Mean age 68.0 years (SD 14.8), median 72.0, range 27–89.
Group 2: Normal tension glaucoma (NTG): IOP in patients’ history =21 mm Hg, glaucomatous optic disc damage, and corresponding visual field defect. 11 female, nine male. Mean age 70.4 years (SD 11.1), median 69.0, range: 56–94.
Group 3: Ocular hypertension (OHT): IOP in patients’ history >21 mm Hg, no glaucomatous damage. 11 female, nine male. Mean age 59.3 years (SD 8.8), median 60.5, range 38–76.
Group 4: Volunteers without any ocular pathology (control): IOP in patients’ history and in the ophthalmological examination = 21 mm Hg, no glaucomatous damage. 10 female, 10 male. Mean age 63.3 years (SD 19.5), median 70, range 20–88.
Methods
The SmartLens dynamic observing tonometer is a hand held diagnostic contact lens with the dimensions of a 3 mirror contact lens according to Goldmann and a weight of 25 g. It incorporates an electronic pressure sensor capable of continuously measuring IOP and OPA by applanation of the central cornea. The digitised data are transmitted by telemetric means to a base unit and stored. A personal computer, connected to the base unit processes, stores and analyses the recorded data.19,20 A typical IOP curve exhibits characteristic cardiac and respiratory modulations.
The intraobserver and the interobserver variability and reliability of IOP and OPA measurements were evaluated recently. The SmartLens proved to be a reasonably precise and reliable device for both IOP and OPA measurements.21
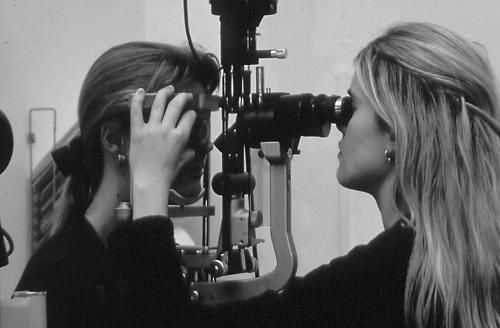
All patients were examined by the SmartLens dynamic observing tonometer: after topic anaesthesia (proparacaine) the thermostated probe was gently applied to the central cornea (Fig 1) and the tear film interface was observed by looking through the probe. Examination continued until a typical IOP curve was recorded for at least 5 seconds. Measurements were repeated three times in each patient and mean values were calculated.
Figure 1.
Examination by the SmartLens dynamic observing tonometer after topical anaesthesia.
The investigator was masked regarding the classification of the patient and the IOP values measured by Goldmann tonometry immediately before the examination.
Central corneal thickness (CCT) was determined by ultrasound using a pachymeter (Advent, Mentor O&O, Norwell, MA, USA).
Blood pressure measurements according to Riva-Rocci were performed as well.
Statistical analysis
Data description for group comparisons was based on medians and quartiles, graphical representation on non-parametric box plots, accordingly. A further exploratory analysis used two sample Wilcoxon tests. All p values to be presented in the following should be regarded as descriptive p values since they were not formally adjusted for multiplicity. A p value less than 0.05 therefore indicates local statistical significance.
Correlations between OPA and patient age and OPA and systolic (RRsys) as well as diastolic (RRdia) blood pressure were estimated using Spearman’s rank correlation coefficient.
Group comparison along binary end points was performed by Fisher’s exact test.
Statistical analysis was drawn out using spss (release 9.0.1 for windows).
To evaluate the probability of normal tension glaucoma depending on the individual OPA measurements a logistic regression model was applied. If x denotes an individual’s OPA, the individual’s positive predictive value PPV (probability of showing normal tension glaucoma) was modelled according to the prediction formula:
 |
Firstly, the regression coefficients α and β were estimated from the data on hand; for subsequent patients these numbers could be used to individually predict their PPV derived from the OPA using this formula. The statistical significance of this prediction formula was assessed with Wald’s test for logistic regression models.
RESULTS
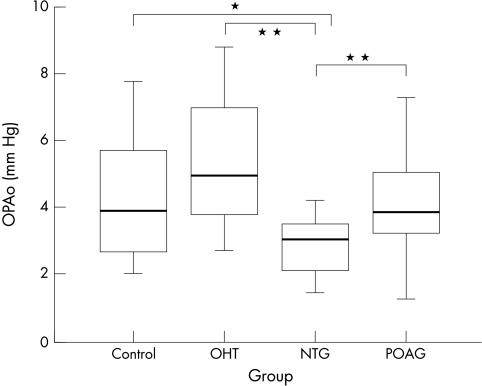
OPA values are presented in Table 1; graphical presentation is in Figure 2.
Table 1.
Ocular pulse amplitude (mm Hg)
| OPA | Median | Min | Max | First quartile (25%) | Third quartile (75%) | Mean value | SD |
| POAG (n=20) | 3.8 | 1.3 | 9.6 | 3.1 | 5.1 | 4.3 | 1.9 |
| NTG (n=20) | 3.0 | 1.5 | 4.2 | 2.1 | 3.5 | 2.8 | 0.9 |
| OHT (n=20) | 4.9 | 2.7 | 8.8 | 3.8 | 7.3 | 5.3 | 1.9 |
| Control (n=20) | 3.9 | 2.1 | 7.8 | 2.6 | 5.8 | 4.3 | 1.7 |
Figure 2.
OPA values of the four groups: POAG, NTG, OHT, and control. Group comparisons demonstrate a statistically significant lower OPA in the group of patients suffering from NTG compared to each of the other groups (p = 0.01). * indicates a p value <0.05, ** indicates a p value <0.01.
Group comparisons demonstrate a statistically significant lower OPA in the group of patients suffering from NTG compared to each of the other groups (p <0.01, Table 2).
Table 2.
Group comparisons by two sample Wilcoxon tests
| OPA | Pachymetry (CCT) | |
| POAG/NTG | p<0.01* | p=0.43 |
| POAG/OHT | p=0.09 | p=0.03* |
| POAG/control | p=0.99 | p=0.57 |
| NTG/OHT | p<0.01* | p=0.01* |
| NTG/control | p=0.01* | p=0.68 |
| OHT/control | p=0.09 | p<0.01* |
*Indicates local statistical significance.
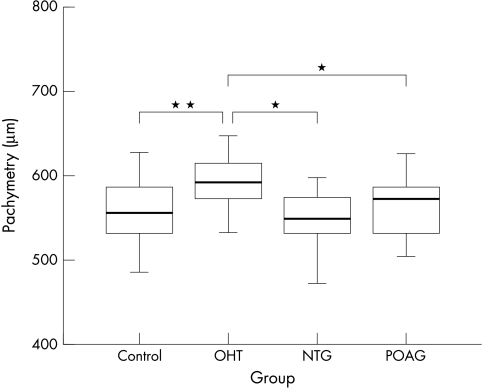
CCT was higher in the OHT group compared to all the other groups (Fig 3, Table 2).
Figure 3.
Central corneal thickness (CCT) of the four groups. Group comparisons demonstrate a statistically significant higher CCT in the OHT group compared to each of the other groups.
There were no statistically significant correlations between OPA and age (Spearman’s rank correlation coefficients r = −0.032; p = 0.78) as well as pulse rate (r = −0.13; p = 0.41), systolic (r = 0.08; p = 0.65) or diastolic (r = −0.25; p = 0.12) blood pressure (Table 3), although group comparison between NTG patients and control group demonstrated statistically significantly more patients with a history of hypotonous blood pressure in the NTG group (p = 0.047, Table 4). There were no statistically significant correlations between OPA and CCT (r = 0.15); p = 0.19) and Goldmann applanation tonometry results (r = 0.2; p = 0.07).
Table 3.
Correlations between OPA and blood presssure values (Spearman’s rank correlation coefficients)
| OPA | |
| RR systolic | r=0.08; p=0.65 |
| RR diastolic | r=−0.25; p=0.12 |
Table 4.
Group comparison (NTG patients versus probands without ocular pathology) using Fisher’s exact test: p=0.047
| NTG | Control | Total | |
| Systemic hypotony | 5 | 0 | 5 |
| No systemic hypotony | 15 | 20 | 35 |
| 20 | 20 | 40 |
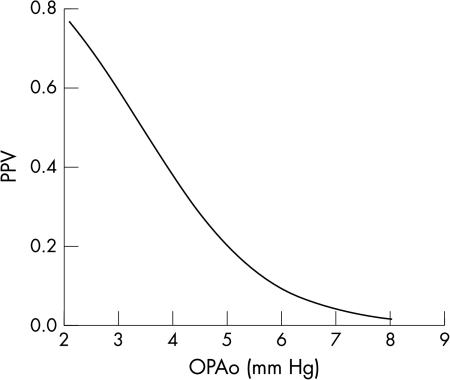
A formula to calculate individual’s positive predictive value to suffer from NTG based on the individual OPA was established by estimating the regression coefficients α (0.9) and β (3.09) from the data on hand (Fig 4). The statistical significance of the prediction formula was assessed with Wald’s test for logistic regression models and OPA was proved to be the only statistically significant predictive risk factor of the parameters examined in this study.
Figure 4.
Individual’s positive predictive value (PPV) as a measure of the probability of normal tension glaucoma: PPV = 1/(1 + exp (−α × x + β)), x = individual’s OPA, α = 0.9, β = 3.09 (p values of α and β are <0.01).
DISCUSSION
The SmartLens dynamic observing tonometer is a helpful tool for the assessment of pulsatile components of IOP. OPA measured by the SmartLens could be established as an independent risk factor of the presence of normal tension glaucoma. The statistical significance of the prediction formula was assessed with Wald’s test for logistic regression models and OPA was proved to be the only statistically significant predictive risk factor of all parameters examined in this study. Concerning the group without increased IOP (20 patients with NTG, 20 healthy probands) individual’s positive predictive values to have NTG based on their individual OPA was established. The calculated model is based on the data of this study population, which might differ from the general population in some aspects: prevalence of NTG in general is minor and depends on several factors such as age and cardiovascular diseases.5,11 Further independent studies are needed to validate the model in clinical practice based on a sufficiently large sample size and a consecutive representative patient population.
Compared with the other group with normal IOP (control group) as well compared with patients suffering from POAG and patients suffering from OHT OPA was statistically significant lower in the group of patients with NTG, which might reflect a reduced pulsatile blood flow in the eyes of those patients. Therefore OPA measurement with SmartLens might not only be an important parameter in the detection, but also in the monitoring of NTG. An increasing effect of topical carbonic anhydrase inhibition on OPA was already found in a randomised, prospective, masked clinical trial.22
In earlier studies OPA was measured by the Langham ocular blood flow (OBF) system.23 Trew and Smith18 and Schmidt et al17 found comparable results using the Langham OBF system: OPA according to Schmidt et al in patients with POAG 3.5 mm Hg (mean value) compared with 4.3 mm Hg (mean value) in our study, OPA in patients with NTG 2.0 versus 2.8 in our study and OPA in patients with OHT 4.6 versus 5.3 (control 3.1 versus 4.3).
Contrary to the study of Schmidt et al, OPA was not statistically increased in our patients with OHT. Concerning OHT the result of an increased OPA might be caused by the elevated CCT in these patients.24 Ehlers and Whitacre25–27 demonstrated this possible problem with IOP measurement performed by applanation. OPA measurements could be dependent on CCT and corneal rigidity in the same manner. The value artefactually raised in case of an increased CCT. Phillips et al found a positive correlation between IOP and the OPA measured by Alcon pneumotonometry.28 However, in our study OPA correlated with neither CCT (r = 0.15; p = 0.19) nor with IOP measured by applanation tonometry (r = 0.2; p = 0.07). The dependence of OPA measurements with the SmartLens on physical parameters such as corneal rigidity therefore remains unclear at the moment. Although comparatively lower OPA values were measured in the NTG group, a considerable overlap in the normal and the NTG group is the reason that OPA values can never establish the diagnosis of NTG for individual patients. Nevertheless, our data corroborate previous studies suggesting a vascular deficiency in NTG.
Rapid responses.
Letters on the following British Journal of Ophthalmology papers have been published recently as rapid responses on the BJO website. To read these letters visit www.bjophthalmol.com and click on “Read eLetters”
Astigmatism and the analysis of its surgical correction. N Morlet, D Minassian, J Dart. Br J Ophthalmol 2001;85:1127–38.
Autologous serum eyedrops for dry eyes and epithelial defects: clinical and in vitro toxicity studies. A C Poona, G Geerlinga, J K G Darta, G E Fraenkela, J T Daniels. Br J Ophthalmol 2001;85:1188–97.
If you would like to post an electronic response to these or any other articles published in the journal, please go to the website, access the article in which you are interested, and click on “eLetters: Submit a response to this article” in the box in the top right hand corner.
Abbreviations
IOP, intraocular pressure
NTG, normal tension glaucoma
OHT, ocular hypertension
OPA, ocular pulse amplitude
POAG, primary open angle glaucoma
REFERENCES
- 1.Demailly P, Cambien F, Plouin PF, et al. Do patients with low tension glaucoma have particular cardiovascular characteristics?Ophthalmologica 1984;188:65–75. [DOI] [PubMed] [Google Scholar]
- 2.Drance SM. Some factors in the production of low-tension glaucoma.Br J Ophthalmol 1972;56:229–42. [DOI] [PMC free article] [PubMed] [Google Scholar]
- 3.Drance SM, Douglas GR, Wijsman K, et al. Response of blood flow to warm and cold in normal and low-tension glaucoma patients.Am J Ophthalmol 1988;105:35–9. [DOI] [PubMed] [Google Scholar]
- 4.Flammer J, Guthauser U, Mahler F. Do ocular vascospasm help cause low tension glaucoma?Doc Ophthalmol Proc Ser 1987;49:397–9. [Google Scholar]
- 5.Flammer J, Gasser P, Prünte CH, et al. The probable involvement of factors other than intraocular pressure in the pathogenesis of glaucoma. In: Drance SM, van Buskirk EM, Neufeld AH, eds. Pharmacology of glaucoma. Baltimore: Williams & Wilkins, 1992:273–83.
- 6.Gasser P. Ocular vasospasm: a risk factor in the pathogenesis of low-tension glaucoma.Inter Ophthalmol 1989;13:281–90. [DOI] [PubMed] [Google Scholar]
- 7.Gasser P, Flammer J. Blood-cell velocity in the nailfold capillaries of patients with normal-tension or high-tension glaucoma and of healthy controls.Am J Ophthalmol 1991;111:585–8. [DOI] [PubMed] [Google Scholar]
- 8.Goldberg I, Hollows FC, Kass MA, et al. Systemic factors in patients with low-tension glaucoma.Br J Ophthalmol 1981;65:56–62. [DOI] [PMC free article] [PubMed] [Google Scholar]
- 9.Leighton DA, Phillips C. Systemic blood pressure in open-angle glaucoma, low-tension glaucoma, and the normal eye.Br J Ophthalmol 1972;56:447–53. [DOI] [PMC free article] [PubMed] [Google Scholar]
- 10.Phelps CD, Corbett JJ. Migraine and low-tension glaucoma. A case-control study.Invest Ophthalmol Vis Sci 1985;26:1105–8. [PubMed] [Google Scholar]
- 11.Spaeth GL. Low-tension glaucoma. Its diagnosis and management.Doc Ophthalmol Proc Ser 1980;22:263–87. [Google Scholar]
- 12.Winder AF. Circulation lipoprotein and blood glucose in association with low-tension and chronic simple glaucoma.Br J Ophthalmol 1977;61:641–5. [DOI] [PMC free article] [PubMed] [Google Scholar]
- 13.Kitazawa Y, Shirai H, Go FJ. The effect of a Ca++ antagonist on visual field in low tension glaucoma.Graefes Arch Clin Exp Ophthalmol 1989;227:408–12. [DOI] [PubMed] [Google Scholar]
- 14.Tielsch JM, Katz J, Sommer A, et al. Hypertension, perfusion pressure and primary open angle glaucoma: a population based study.Arch Ophthalmol 1995;113:216–21. [DOI] [PubMed] [Google Scholar]
- 15.Schwartz B. Changes in optic disc in ocular hypertension and glaucoma.Jpn J Ophthalmol 1986;30:143–5. [PubMed] [Google Scholar]
- 16.Mittag TW, Serle J, Schumer R, et al. Studies of the ocular pulse in primates.Surv Ophthalmol 1994;38:183–90. [DOI] [PubMed] [Google Scholar]
- 17.Schmidt K-G, v Rückmann A, Mittag TW. Ocular pulse amplitude in ocular hypertension and open-angle glaucoma.Ophthalmologica 1998;212:5–10. [DOI] [PubMed] [Google Scholar]
- 18.Trew DR, Smith SE. Postural studies in pulsatile ocular blood flow: 1. Ocular hypertension and normotension. 2. Chronic open angle glaucoma.Br J Ophthalmol 1991;75:66–75. [DOI] [PMC free article] [PubMed] [Google Scholar]
- 19.Dekker PW, Robert YCA, Kanngiesser H, et al. Principles of contact lens tonometry.Int Ophthalmol 1998;22:105–11. [DOI] [PubMed] [Google Scholar]
- 20.Entenmann B, Robert YCA, Pirani P, et al. Contact lens tonometry—application in humans.Invest Ophthalmol Vis Sci 1997;38:2447–51. [PubMed] [Google Scholar]
- 21.Vogel A, Beck S, Schwenn O, et al. Reproduzierbarkeit der Messung von okulärer Pulsamplitude und intraokularem Druck mittels SmartLens.Ophthalmologe 2001;98:944–9. [DOI] [PubMed] [Google Scholar]
- 22.Schmidt K-G, v Rückmann A, Pillunat LE. Topical carbonic anhydrase inhibition increases ocular pulse amplitude in high tension primary open angle glaucoma.Br J Ophthalmol 1998;82:758–62. [DOI] [PMC free article] [PubMed] [Google Scholar]
- 23.Langham ME, To’Mey KF. A clinical procedure for the measurement of ocular pulse-pressure relationship and ophthalmic arterial pressure.Exp Eye Res 1978;27:17–25. [DOI] [PubMed] [Google Scholar]
- 24.Shah S, Chatterjee A, Mathai M, et al. Relationship between corneal thickness and measured intraocular pressure in a general ophthalmology clinic.Ophthalmology 1999;106:2154–60. [DOI] [PubMed] [Google Scholar]
- 25.Ehlers N, Bramsen T, Spierling S. Applanation tonometry and central corneal thickness.Acta Ophthalmol(Copenh) 1975;53:34–43. [DOI] [PubMed] [Google Scholar]
- 26.Ehlers N, Kruse Hansen. Central corneal thickness in low tension glaucoma.Acta Ophthalmol (Copenh) 1974;52:740–6. [DOI] [PubMed] [Google Scholar]
- 27.Whitacre MM, Stein RA, Hassanein K. The effect of corneal thickness on applanation tonometry.Am J Ophthalmol 1993;115:592–6. [DOI] [PubMed] [Google Scholar]
- 28.Phillips CI, Tsukahara S, Hosaka O, et al. Ocular pulsation correlates with ocular tension: the choroid as piston for an aqueous pump?Ophthalmic Res 1992;24:338–43. [DOI] [PubMed] [Google Scholar]


