Abstract
Aims: To provide normative data for chromatic discrimination on the Farnsworth-Munsell 100 hue test particularly for observers under 23 years of age.
Methods: Normal observers were screened for congenital colour vision deficiencies using the Ishihara test leaving 382 observers.
Results: New total error score (TES) norms (means and 95th percentiles) are presented for each year of age from 5–22 and for 10 year age groups from the 30s to the 70s. These norms are presented as actual values (TES) and also as square root values (√TES). Other data include partial error scores for red-green and blue-yellow axes discrimination.
Conclusion: This study provides the most detailed set of normative data to date. The data are also in agreement with other reports of chromatic discrimination, showing that the performance in this task varies as a U-shape function with age, the best being achieved at 19 years of age.
Keywords: Farnsworth-Munsell 100 hue test
The Farnsworth-Munsell (F-M) 100 hue test1 is widely used for measuring chromatic discrimination by clinicians and vision scientists. As well as helping to identify various congenital colour vision deficiencies, it is a useful and sensitive test for measuring the changes due to neuronal disease2,3 or possible side effects in therapeutic management.4,5
The test was first devised by Farnsworth in 1943 and the present 85 coloured cap version dates from 1957. The caps are arranged in four boxes, each containing a fixed anchor cap at each end. There are 22 caps in the box 1 and 21 caps in each of remaining three boxes. The total error score (TES) is a measure of accuracy of an observer in arranging the caps so as to form a gradual transition in chroma between the two anchor caps; the higher the number of misplacements the larger the TES. TES norms for the test have been published at intervals including those by Verriest et al6–8 based on data for observers divided into various age cohorts (either 5 year or 10 year).
There is, however, ambiguity about scoring cap misplacements occurring near the ends of boxes in the published norms. The test instructions for scoring do not specify how to account for chromatic step changes across the boundaries between boxes. Before automatic scoring equipment was developed, most testers scored the test on the basis that the anchor caps at the ends of the boxes did not exist. Thus a sequence such as cap numbers 20, 19 in the first box followed by caps 26, 23 in the second box would have a partial error score for the last arranged cap in the first box (19) calculated by adding |19 − 20| to |19 − 26| and then subtracting 2 (that is, 1 + 7 −2 = 6). Likewise the partial error score for the first arranged cap in the second box (26) would be |26 − 19| + |26 − 23| − 2 = 8. For this method, the total error score from summing all the partial scores is a multiple of four. Since the introduction of automatic scoring, testers have scored the caps in each box independently of the caps in the previous or following boxes by making use of the numbers of the anchor caps. With this method, the total error score is not necessarily a multiple of four and can result in a lower TES than that obtained using the former method. The scoring artefacts associated with the division of the test into boxes have been addressed by Victor9 and by Craven,10 the latter drawing attention to the point that box-end caps have lower scores than mid-box caps when the TES is low but higher scores when the TES is high.
A further scoring anomaly arose with earlier versions of the test when the boxes were shorter than the current versions. Some testers removed cap 85 from the first box and installed it as the anchor cap instead of 84, leaving just 21 caps for observers to arrange. For example, Verriest et al’s6 observers used binocular vision and the scoring disregarded the numbers of the anchor caps whereas his later observers8 were tested both binocularly and monocularly, the scoring excluded cap 85, and the numbers of the anchor caps were used for calculating misplacements at the ends of boxes.
Finally, the distribution of TES at a given age group has a skewed distribution, hence it has been recommended that the transformation of TES to the square root of TES (√TES) provides a nearer normal distribution for statistical analysis of the data.11 Although this recommendation has been questioned,12 more recent normative data have been published as means of √TES for 5 year and 10 year age groups.8,13 More statistically efficient methods based on maximum-likelihood procedures have been offered by Craven14,15 but they are not convenient to use in a clinical situation.
Here, we report normative data for observers in each year of age from 5 to 22 and for 10 year age groups from the 30s to the 70s in both TES and √TES form. We also report partial error scores (TPES) for the red-green and blue-yellow axes of colour vision deficiencies because they represent a useful way of studying the relative contributions of ageing and retinal disease on colour discrimination. We have, therefore, outlined TPES scores as well as a comparison of the means from using the two methods of scoring misplacements at the ends of boxes.
OBSERVERS AND METHODS
Equal numbers of male and female observers aged from 5–79 were given a preliminary test with Ishihara plates to screen out any red-green colour anomalous or defective observers. Larger sample sizes were selected for the ages between 12 and 15 where greater variation in scores generally occurs. The 100 hue test was then administered to the remaining observers by several testers. Tests were carried out under either natural or artificial daylight illumination in a number of schools and laboratories; care was taken to use the same instructions in all testing sessions. In order to make the procedure easier for children, the caps for rearranging were taken out of the box and placed on a non-reflecting white surface behind the box and their positions were randomised. Observers were instructed to select the coloured caps and place them in the box between the anchor colours “so that they form a regular colour series between the two end caps” (Farnsworth1). For consistency, the same procedure was used for adults. The observers were tested binocularly and were told that the test should take about 2 minutes per box but that accuracy was more important than speed. The younger observers (primary schoolchildren) took significantly longer to complete the test than the older observers. Parental consent was obtained for testing schoolchildren. All the observers were either emmetropes or wore their optical corrections. Overall ethical approval was obtained from the departmental ethics committee.
RESULTS
Cap 85 was retained in the first box. For observers under 30 years of age, the scoring was done by noting the partial error scores for pairs of caps in the two ways described above (that is, by disregarding the numbers of the anchor caps and by taking them into account). For observers over 30 years of age, the scoring was done in the traditional method by disregarding the numbers of the anchor caps. Total error scores (TES) were computed by summing the partial error scores for every cap. Total partial error scores (TPES) were also computed for the red-green (R-G) axis using caps 13–33 and 55–75, and for the blue-yellow (B-Y) axis using caps 1–12, 34–54, and 76–85 as recommended by Smith et al.16 The square roots of TES and TPES were also computed.
A total of 395 people were tested. Thirteen children, mostly aged under 10, with a total error score greater than 500 were excluded from the computation of the norms on the basis that a score of that size indicates virtually no colour discrimination. Thus, 382 observers (189 males and 193 females) remained, of whom only nine (all under the age of 10) had a total error score of more than 400.
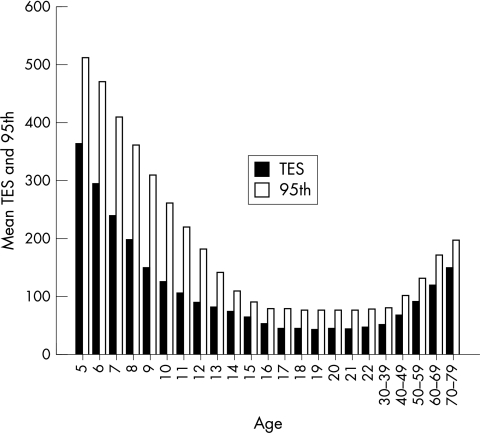
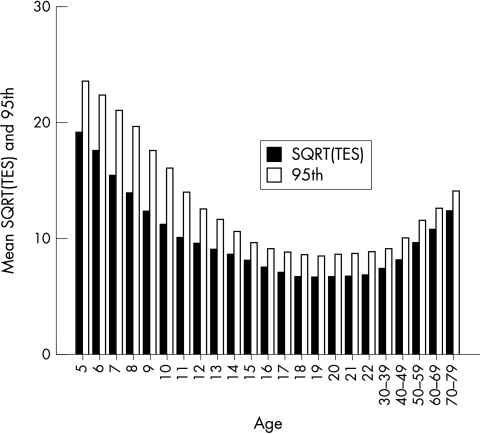
The means in Table 1 were obtained by comparing the best fitting curve for the scatter plot of all observers in conjunction with the means and medians for each year of age up to 22 and each 10 year age group from the 30s to the 70s. These TES means are plotted in Figure 1. Figure 2 shows the square root of TES (√TES) along with their respective 95th percentiles computed by adding 1.65 times the standard deviation to the mean.
Table 1.
Means and 95th percentiles of total error score (TES) and square root of TES (√TES)
| Total error score (TES) | √TES | ||||
| Age (years) | No of observers | Mean | 95th | Mean | 95th |
| 5 | 9 | 364 | 510 | 19.1 | 23.5 |
| 6 | 8 | 294 | 470 | 17.5 | 22.2 |
| 7 | 18 | 240 | 410 | 15.5 | 21.0 |
| 8 | 18 | 200 | 360 | 14.0 | 19.5 |
| 9 | 19 | 150 | 310 | 12.4 | 17.5 |
| 10 | 19 | 125 | 260 | 11.2 | 16.0 |
| 11 | 19 | 108 | 220 | 10.2 | 14.0 |
| 12 | 37 | 90 | 180 | 9.5 | 12.5 |
| 13 | 39 | 82 | 140 | 9.0 | 11.5 |
| 14 | 39 | 74 | 110 | 8.6 | 10.5 |
| 15 | 29 | 65 | 90 | 8.1 | 9.5 |
| 16 | 10 | 52 | 78 | 7.5 | 9.0 |
| 17 | 10 | 46 | 77 | 7.0 | 8.8 |
| 18 | 10 | 44 | 76 | 6.7 | 8.5 |
| 19 | 9 | 43 | 75 | 6.6 | 8.4 |
| 20 | 12 | 44 | 76 | 6.7 | 8.5 |
| 21 | 12 | 44 | 76 | 6.7 | 8.6 |
| 22 | 11 | 47 | 78 | 6.8 | 8.7 |
| 30–39 | 10 | 50 | 80 | 7.3 | 9.0 |
| 40–49 | 10 | 68 | 100 | 8.1 | 10.0 |
| 50–59 | 10 | 90 | 130 | 9.5 | 11.4 |
| 60–69 | 10 | 120 | 170 | 10.7 | 12.5 |
| 70–79 | 10 | 150 | 195 | 12.3 | 14.0 |
Figure 1.
Means and 95th percentiles of TES.
Figure 2.
Means and 95th percentiles of √TES.
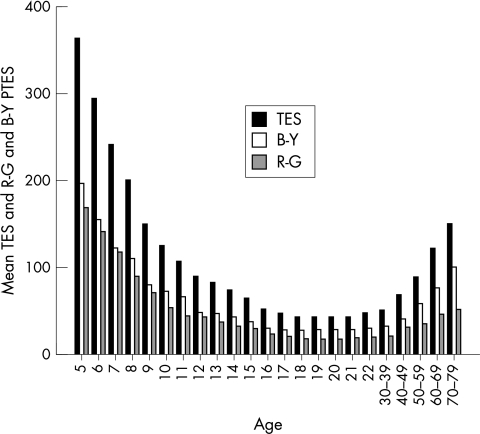
The curves for the mean TPES for the R-G and B-Y axes are shown in Figure 3. The TPES scores also show the expected increase in B-Y deterioration compared with R-G deterioration beyond the 30s age group.
Figure 3.
Mean TES and √TES for B-Y and R-G.
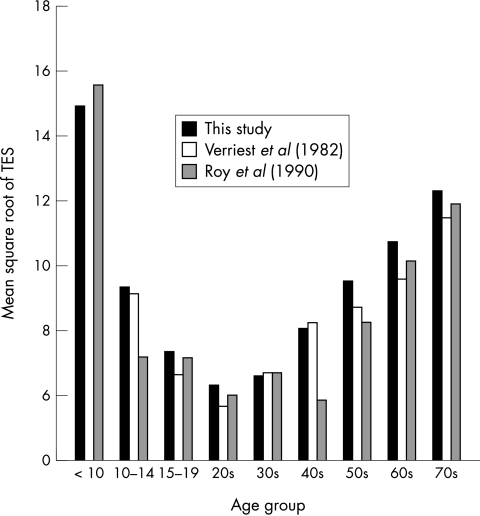
A comparison of the our mean square root of TES data in 5 year and 10 year cohorts to match those of Verriest et al8 and Roy et al13 show comparable mean values (Fig 4) for the aggregated age groups except that those of Roy et al are rather more irregular.
Figure 4.
Comparison of √TES with other norms.
Table 2 tabulates the mean differences between calculating the error scores across and within boxes for TES and √TES for the younger observers. The values indicate that there is not an appreciable difference in scores obtained using the two scoring methods.
Table 2.
Mean differences between calculating the error scores across and within boxes for TES and √TES
| Age group | No | TES difference | √TES difference |
| <10 | 72 | 12.8 | 0.39 |
| 10–14 | 153 | 4.1 | 0.20 |
| 15–19 | 68 | 2.0 | 0.11 |
| 20–25 | 30 | 0.9 | 0.08 |
DISCUSSION
The present study, in agreement with previous reports,6–8,13 shows that the performance on F-M 100 hue test varies as a U-shape function of age. Younger children make significantly more misplacement errors leading to higher TES than observers in their 20s. The performance of older adults also deteriorates with age. This trend is repeated for total partial error scores (TPES) indicating that the development and the subsequent deterioration of performance with age also varies as a U-shaped function for red-green and blue-yellow opponent systems. As expected the blue-yellow sensitivity deteriorates more than red-green sensitivity for observers over 40 (Fig 3). For both TES and TPES measures we did not find a difference as a function of sex and the performance of male and female observers were not significantly different. The best performance on this test is achieved by those in their late teens and early 20s. This finding is also in line with recent reported discrimination performance using preferential looking in infants and forced choice chromatic discrimination in younger and older adults.17 Hence, on the basis of these similar age trends, we propose that in the case of younger children, the 100 hue changes in performance is a measure of their chromatic discrimination ability rather than of a lower comprehension of the task or lower attentional span. In our experience, most schoolchildren were attentive and tried to do their best since they considered the test as a challenge and a variation in the everyday teaching routine at school.
We have also addressed the effect of different methods used for scoring the test. The results outlined in Table 2 show the effect of taking into account the transition between the boxes or treating each box independently. The corrections that should be applied in order to transform the results obtained using one method to another for various age groups are small. In light of these findings, we propose that for simplicity, scoring should be done for each box independently.
The present study provides detailed normative data at the lower age range not previously published and it addresses the sensitivity of F-M 100 hue test for measuring changes in chromatic sensitivity in younger children caused by pathological damage or therapeutic intervention. The comparison of performance in F-M 100-hue or computerised measures of chromatic sensitivity is the subject for our current programme of research.
REFERENCES
- 1.Farnsworth D. The Farnsworth-Munsell 100-Hue Test for the examination of color discrimination. Revised 1957. Maryland: Munsell Color Company, Inc, 1957.
- 2.Lakowski R, Bryett J, Drance SM. A study of color vision in ocular hypertensives. Canad J Ophthalmol 1972;7:86–95. [PubMed] [Google Scholar]
- 3.Pacheco-Cutillas M, Sahraie A, Edgar DF. Acquired colour vision defects in glaucoma—their detection and clinical significance. Br J Ophthalmol 1999;83:1396–402. [DOI] [PMC free article] [PubMed] [Google Scholar]
- 4.Nousiainen I, Kälviäinen R, Mäntyjärvi M. Color vision in epilepsy patients treated with vigabatrin or carbamazepine monotherapy. Ophthalmology 2000;107:884–8. [DOI] [PubMed] [Google Scholar]
- 5.Bayer AU, Thiel HJ, Zrenner E, et al. Color vision tests for early detection of antiepileptic drug toxicity. Neurology 1997;48:1394–7. [DOI] [PubMed] [Google Scholar]
- 6.Verriest G, Vandevyvere R, Vanderdonck R. Nouvelles recherches se rapportant à l’influence du sexe et de l’age sur la discrimination chromatique, ainsi qu’à la signification pratique des resultats du test 100 hue de Farnsworth-Munsell. Rev Opt Theor Instr 1962;41:499–509. [Google Scholar]
- 7.Verriest G. Further studies on acquired deficiency of color discrimination. J Opt Soc Am 1963; 53:185–95. [DOI] [PubMed] [Google Scholar]
- 8.Verriest G, Van Laetham J, Uvijls A. A new assessment of the normal ranges of the Farnsworth-Munsell 100-Hue test scores. Am J Ophthalmol 1982; 93:635–42. [DOI] [PubMed] [Google Scholar]
- 9.Victor JD. Evaluation of poor performance and asymmetry in the Farnsworth-Munsell 100-hue test. Invest Ophthalmol Vis Sci 1988;29:476–81. [PubMed] [Google Scholar]
- 10.Craven BJ. A second box-end scoring artifact in the Farnsworth-Munsell 100-hue test. Invest Ophthalmol Vis Sci 1993;34:503–6. [PubMed] [Google Scholar]
- 11.Kinnear PR. Proposals for scoring and assessing the 100-Hue test. Vis Res 1970;10:423–34. [DOI] [PubMed] [Google Scholar]
- 12.Dain S. Skewness and transformations of Farnsworth-Munsell 100-Hue Test scores. Vis Res 1998; 38:3473–6. [DOI] [PubMed] [Google Scholar]
- 13.Roy MS, Podgor MJ, Collier B, et al. Color vision and age in a normal North American population. Graefes Arch Clin Exp Ophthalmol 1991;229:139–44. [DOI] [PubMed] [Google Scholar]
- 14.Craven BJ. A model for the observer on the Farnsworth-Munsell 100-hue test. Invest Ophthalmol Vis Sci 1993; 34:507–11. [PubMed] [Google Scholar]
- 15.Craven BJ. A method for increasing the scoring efficiency of the Farnsworth-Munsell 100-hue test. Ophthal Physiol Opt. 1997;17:153–7. [PubMed] [Google Scholar]
- 16.Smith VC, Pokorny J, Pass AS. Color-axis determination on the Farnsworth-Munsell 100-Hue Test. Am J Ophthalmol 1985; 100:176–82. [DOI] [PubMed] [Google Scholar]
- 17.Knoblauch K, Vital-Durand F, Barbur JL. Variation of chromatic sensitivity across the life span. Vis Res 2001; 41:23–36. [DOI] [PubMed] [Google Scholar]


