Abstract
Aim: To compare the pattern of localised nerve fibre layer (NFL) defects in normal tension glaucoma (NTG) and primary open angle glaucoma (POAG).
Methods: 50 NTG eyes and 36 POAG eyes, all with localised NFL defects, were enrolled. On retinal NFL photography, the proximity of the defect to the centre of the fovea (angle α) and the sum of the angular width of the defects (angle β) were determined. Angle α was the angle made by a line from the centre of the fovea to the disc centre and a line from the disc centre to the disc margin, where the nearest border of the defect met. The patterns of localised NFL defects in NTG and POAG were compared with angles α and β. Independent t test was used for statistical analysis.
Results: Angle α in NTG (35.1 (SD 20.0)°) was significantly smaller than that of POAG (45.9 (21.9)°) (p=0.02), while angle β in NTG (49.0 (31.9)°) was significantly larger than that of POAG (33.1 (23.9)°) (p=0.01).
Conclusions: The pattern of NFL defects in NTG was different from that in POAG. Localised NFL defects in NTG were closer to the fovea and wider in width than those in POAG.
Keywords: nerve fibre layer defects, normal tension glaucoma, primary open angle glaucoma
Many researchers have suggested a difference in pathogenesis between normal tension glaucoma (NTG) and primary open angle glaucoma (POAG). Among the evidence supporting this theory were the different patterns of visual field defect1–5 and optic nerve head configuration.3,5–9 The frequent occurrence of optic disc haemorrhage and the high incidence of systemic diseases10–14 in patients with NTG also suggested that a damaging mechanism other than high intraocular pressure contributed to the glaucomatous damage.1 Although retinal nerve fibre layer (RNFL) evaluation has become important in detecting glaucomatous nerve damage, quantitative comparison of RNFL photographs between NTG and POAG has been rare.
In this study, we tried to evaluate the difference in nerve fibre layer (NFL) defects between NTG and POAG through analysis of RNFL photographs.
SUBJECTS AND METHODS
This was a retrospective clinical study. Patients who were diagnosed as NTG or POAG in the glaucoma clinic of Seoul National University Hospital from 1994 to 2000 were included in the study. All patients received evaluation including complete ophthalmic examinations with gonioscopy, applanation tonometry, disc stereophotography, RNFL photography, and visual field test with automated perimetry. Red-free fundus photographs of RNFL was taken by a previously described technique.15 A TRC-50IA (Topcon Inc, Tokyo, Japan) or CF-60UV (Canon Inc, Utsunomiya, Japan) fundus camera and TMX 135–24 film (Kodak Inc, Seoul, Korea) were used. The visual field tests were performed using the C30-2 program of Humphrey visual field analyser, Model 750 (Zeiss Inc, San Leandro, CA, USA) or Model 630 (Allergan Inc, San Leandro, CA, USA).
We defined NTG according to the following criteria: (1) intraocular pressure consistently less than 21 mm Hg in an eye without antiglaucoma medication, (2) characteristic glaucomatous optic nerve head damage, (3) glaucomatous visual field loss, (4) no neuroradiological evidence of optic nerve damage, (5) open iridocorneal angle, and no abnormal chamber angle structure on gonioscopic examination. POAG was defined to meet the same criteria of NTG except for intraocular pressure greater than 21 mm Hg in an eye without antiglaucoma medication.15
The exclusion criteria were as follows: (1) MD (mean deviation) of more than −14 dB on Humphrey C30-2 program. By limiting the MD value below −14 dB, we excluded the eyes with severe visual field defects from this study; (2) previous ocular pathology such as retinal diseases and cataract, or a history of ocular surgery; (3) patients older than 70 years to rule out senile NFL atrophy.
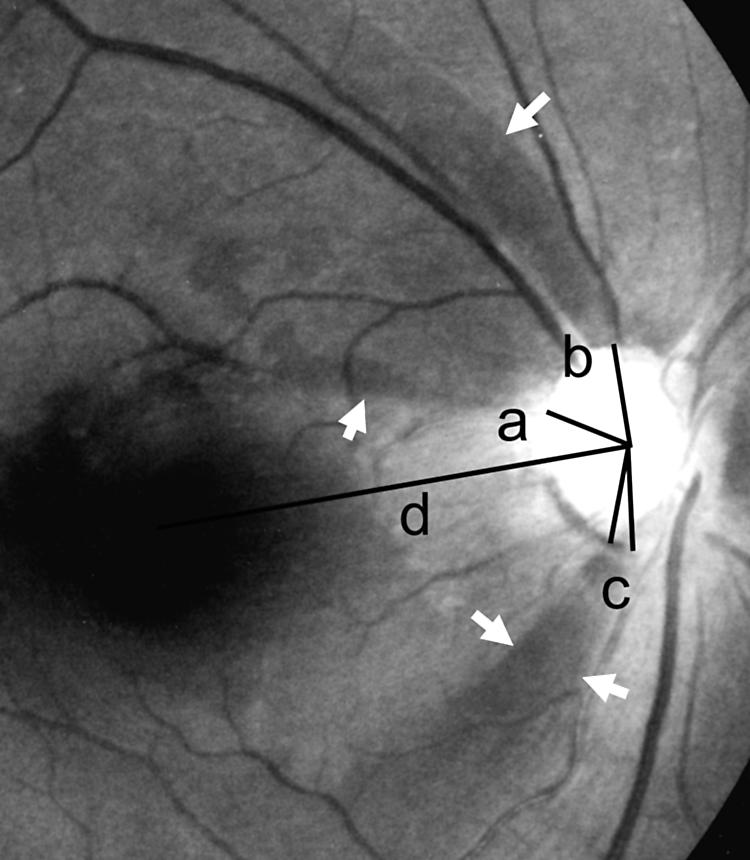
The parameters of RNFL photography were defined for the evaluation of localised NFL defects and these are illustrated in Figure 1.
Figure 1.

Parameters obtained from the retinal nerve fibre layer (RNFL) photograph. Reference line d was from the disc centre to the centre of the fovea. Angle α (a) was the angle made between the reference line and a line from the disc centre to the point of disc margin where the nearest border of the defect met. Angle β was the sum (b + c) of the angular widths of the defects.
Reference line d: a line from the centre of the disc to the centre of the macula.
Angle α (a): the minimum angle which was made by a reference line and a line from the centre of the disc to a disc margin where the NFL defects meet the disc.
Angle β (b + c): the summated width of the circumferential angle of NFL defects around the disc.
Localised NFL defects more than 120 degrees from the reference line were excluded because the defects in the nasal NFL were ambiguous and difficult to determine.
These parameters were obtained through thorough evaluations of the RNFL photographs by one ophthalmologist experienced in RNFL evaluation. To prevent examiner bias, RNFL photography evaluation was carried out without any information on the patients’ diagnoses.
Medical records were reviewed for 71 eyes of 47 patients with NTG and 58 eyes of 33 patients with POAG, who were taken RNFL photographs. Ten eyes of seven patients older than 70 years and 11 eyes of nine patients with severe visual field defects (MD values below −14 dB) were excluded from the RNFL analysis. During RNFL analysis, 22 eyes of 18 patients were excluded because of the indefinite localised NFL defects due to cataract (five eyes), abnormal retinal findings such as diabetic retinopathy, drusen, or epiretinal membranes (seven eyes), and diffuse NFL atrophy (15 eyes). Finally, 50 eyes of 33 NTG patients and 36 eyes of 26 POAG patients were included in the analysis of localised NFL defects.
The demographic data of the two groups, including age and sex ratio, were compared. The obtained parameters of NFL defects (angles α and β) were compared between NTG and POAG. Statistical analyses were performed with independent t test.
RESULTS
The mean ages of the patients were 51.3 (SD 9.2) (range 29–66) years in the NTG group and 48.4 (11.2) (27–66) years in the POAG group. The male to female ratios were 1.1:1 in the NTG group and 1.3:1 in the POAG group. Neither difference was significant between the two groups (both p >0.05). MD of Humphrey C30-2 perimetry was not different between the NTG group (−4.88 (3.02) dB) and the POAG group (−6.16 (4.05) dB) (p = 0.10)
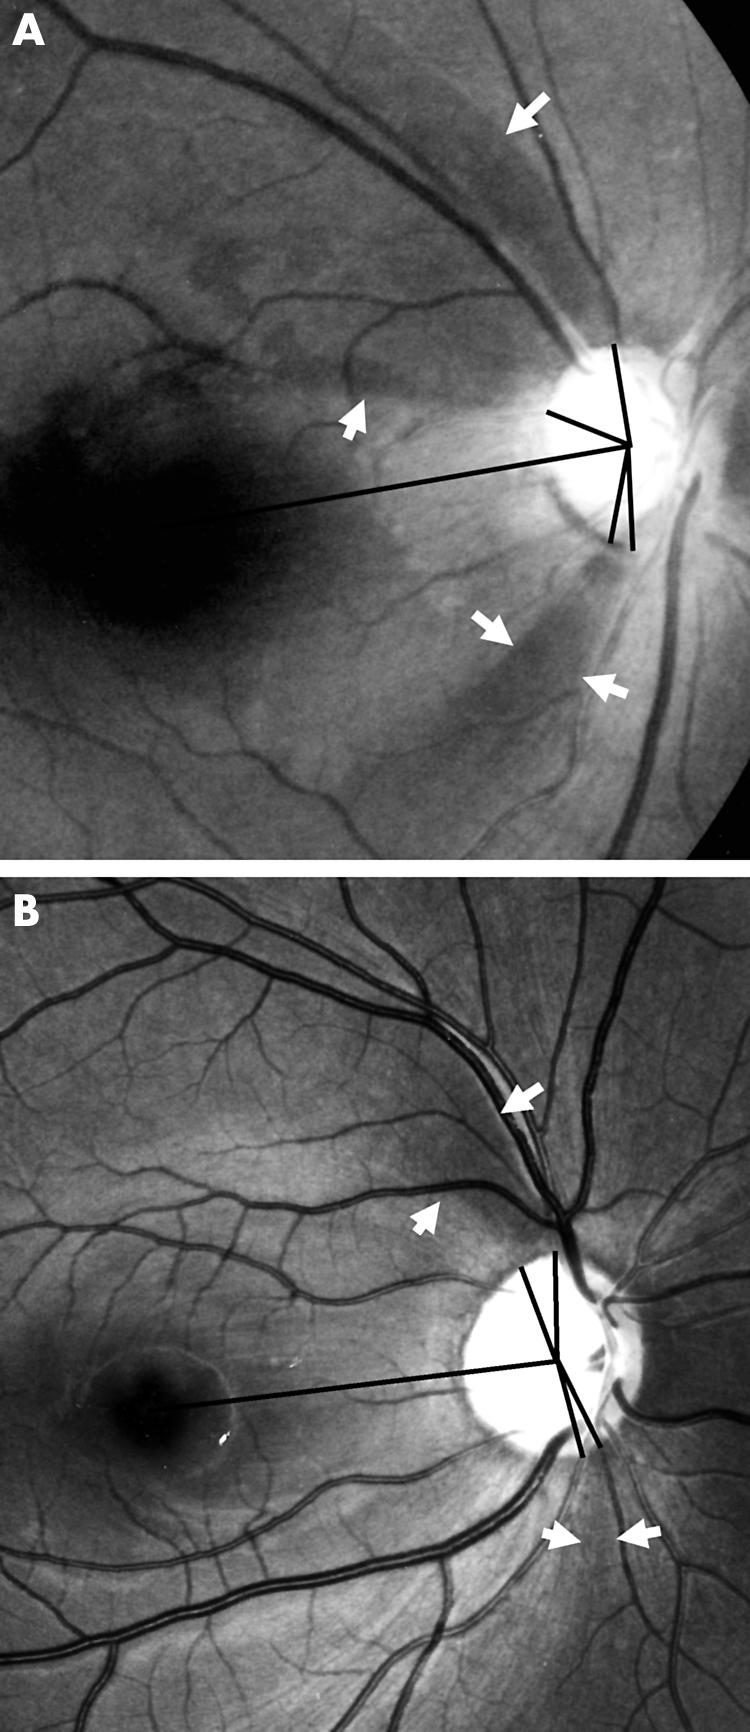
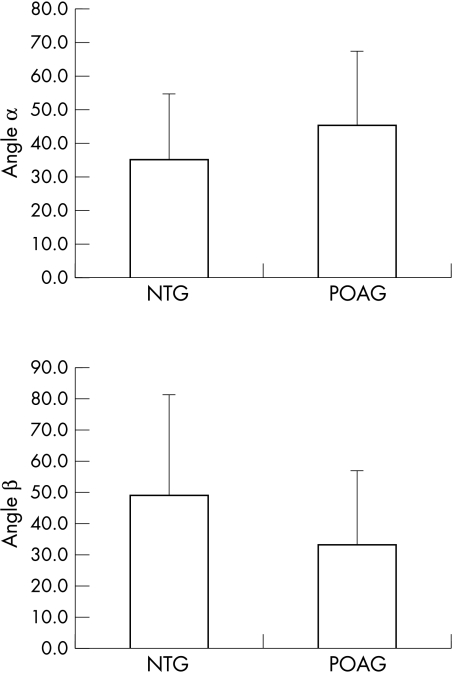
Typical RNFL photographs of NTG and POAG are shown in Figure 2. Angle α in the NTG group (35.1 (20.0)°) was significantly smaller than that of the POAG group (45.9 (21.9)°) (p = 0.02), while angle β in the NTG group (49.0 (31.9)°) was significantly larger than that of the POAG group (33.1 (23.9)°) (p = 0.01) (Fig 3).
Figure 2.

Typical retinal nerve fibre layer (RNFL) photographs of normal tension glaucoma (NTG) (A) and primary open angle glaucoma (POAG) (B). (A) Localised NFL defects of NTG located in both superior and inferior retina are wider and closer to the fovea than those of POAG (B). (B) Localised NFL defects of POAG are far from the fovea and have very narrow widths.
Figure 3.
Angles α and β in normal tension glaucoma (NTG) and primary open angle glaucoma (POAG).
DISCUSSION
Many researchers have studied the structural and functional differences between NTG and POAG. The targets were optic nerve head, visual field, and RNFL. The significant evidence of differences in NTG and POAG would imply pathogenic differences of optic nerve damage between NTG and POAG.
Visual field defects of NTG and POAG have been analysed by many authors since the first report in 1857 by von Graefe.16 While some authors reported no differences between NTG and POAG, others concluded that the visual field defect in NTG was characteristically different from that of POAG. Caprioli et al1 reported that the visual field defects in low tension glaucoma occurred closer to fixation and that the slope and depth of the scotoma was steeper and greater in low tension glaucoma than those in high tension glaucoma.
There have also been many controversies about the difference of optic nerve head configuration between NTG and POAG. Disproportionately greater cupping compared with comparable visual field loss was reported in patients with NTG.5,6 Caprioli et al6 suggested that significant correlation existed between the thickness of the neural rim and the distance of the deepest scotoma from fixation only in high tension glaucoma, but not in low tension glaucoma. They suggested that in high tension glaucoma, the progression of visual field loss started from a more peripheral toward a more central field, while in low tension glaucoma, the visual field loss was very close to fixation and the pattern of progression was not related to the thickness of the neural rim.
RNFL photography has been confirmed to detect glaucomatous abnormalities earlier than visual field analysis.17–19 However, the difficulties in quantitative analysis made it difficult to determine the severity of glaucomatous damage with RNFL photographs. It was also hard to demonstrate the differences of RNFL defects between NTG and POAG.
In the present study, the evaluation of localised NFL defects was done by one experienced examiner who measured the angles around the disc. Through this method, which has not been used in previous studies, quantitative information about the NFL defects could be obtained.
Yamazaki et al20,21 used microdensitometric analysis of RNFL photographs to demonstrate the difference in pattern of RNFL changes between eyes with NTG and high tension glaucoma. He concluded that in eyes with NTG, RNFL loss tended to be localised, whereas it tended to be diffuse in eyes with high tension glaucoma. In analysis of RNFL using scanning laser polarimetry, the thickness of the RNFL was reduced symmetrically in the superior and inferior quadrants in high tension glaucoma, whereas a more localised defect on the inferior RNFL occurred in NTG.22 In another report using scanning laser polarimetry, the RNFL thickness of POAG was relatively thinner especially in the superior retina compared to that of NTG.23 These studies also confirmed the different pattern of RNFL defect in NTG and POAG, but the results are somewhat inconsistent and hence it is difficult to determine the exact differences.
Analysis using microdensitometry and scanning laser polarimetry has the advantage of evaluating the severity of NFL defects in three dimensional mode by computer system. In the present study, the pattern of localised defects was analysed quantitatively in two dimensional mode by an examiner, so the depth or severity of NFL loss could not be evaluated and the data obtained are subjective. Nevertheless, with this manual evaluation of RNFL photographs by an experienced ophthalmologist it was possible to obtain reliable data and there were no limitations as quadrantic measurement in scanning laser polarimetry and no interphotographic variations in microdensitometry.
The result of the present study was that angle α was smaller in the NTG group than in the POAG group and that angle β was larger in the NTG group than in the POAG group. After careful interpretation of these results, we reached the following two conclusions.
The localised NFL defects in NTG are closer to the centre of the fovea and are wider than those in POAG. Considering that the MDs of visual fields were not different between the two groups, it can be stated that these different patterns of NFL defects occurred in similar stages of glaucomatous damage in both groups. The involvement of more central NFL in NTG than in POAG might be due to the fact that the localised NFL defects in NTG occurred from the central retina while those in POAG occurred from the peripheral retina. This conclusion is also in accord with the previous reports1,6 suggesting that the NFL defects in NTG start to appear at the more centrally located retina, whereas the NFL defects in POAG progress from peripheral to central retina.
Although the NTG patients had the same or slightly smaller MD in Humphrey perimetry, they showed wider localised NFL defects than the POAG patients. This indicates that POAG may have more diffuse loss of NFL with narrower localised defects than NTG. Therefore, it can be concluded that in NTG, the NFL damage might present in the form of a mainly localised type, while in POAG a relatively more diffuse type. It can be inferred that the scotoma in NTG might be denser and more definite than those in POAG. The previous report on the differences of optic nerve head between the two kinds of glaucoma, with inferotemporal notch of optic disc in NTG and generalised cupping of disc in POAG, also supports this conclusion.6 The results obtained using scanning laser polarimetry also substantiate this hypothesis.22,23
In conclusion, the NFL defects of NTG are characteristically different from those of POAG. The localised NFL defects of NTG occur closer to the centre of the fovea and wider than those of POAG. In NTG, the NFL defects occur in a more localised fashion than those in POAG. In addition, the occurrence and progression of NFL defects may be different between the two types of glaucoma. These different patterns of NFL change between the two types of glaucoma suggest that a different pathogenesis of glaucomatous damage is associated with each type of glaucoma.
Video reports.
To view the video reports in full visit our website www.bjophthalmol.com and click on the link to video reports.
Marin-Amat syndrome. A Jogiya, C Sandy
Excision of subcutaneous Dirofilariasis of the eyelid. D Mallick, T P Ittyerah
Thixotropy: a novel explanation for the cause of lagophthalmos after peripheral facial nerve palsy. M Aramideh, J H T M Koelman, P P Devriese, F VanderWerf, J D Speelman
Surgical revision of leaking filtering blebs with an autologous conjunctival graft. K Taherian, A Azuara-Blanco
Dipetalonema reconditum in the human eye. T Huynh, J Thean, R Maini
Evaluation of leucocyte dynamics in mouse retinal circulation with scanning laser ophthalmoscopy. H Xu, A Manivannan, G Daniels, J Liversidge, P F Sharp, J V Forrester, I J Crane
An intraocular steroid delivery system for cataract surgery. D F Chang
Pearls for implanting the Staar toric IOL. D F Chang
Capsule staining and mature cataracts: a comparison of indocyanine green and trypan blue dyes. D F Chang
Footnotes
No financial support or interest was received in the preparation of this manuscript.
REFERENCES
- 1.Caprioli J, Spaeth GL. Comparison of visual field defects in the low-tension glaucomas with those in the high-tension glaucomas. Am J Ophthalmol 1984;97:730–7. [DOI] [PubMed] [Google Scholar]
- 2.Drance SM. The visual field of low-tension glaucoma and shock-induced optic neuropathy. Arch Ophthalmol 1977;95:1359–61. [DOI] [PubMed] [Google Scholar]
- 3.Lewis RA, Heyreh SS, Phelps CD. Optic disk and visual field correlations in primary open angle and low-tension glaucoma. Am J Ophthalmol 1983;96:148–52. [DOI] [PubMed] [Google Scholar]
- 4.Spaeth GL. Fluorescein angiography. Its contribution towards understanding the mechanisms of visual loss in glaucoma. Trans Am Ophthalmol Soc 1975;73:491–553. [PMC free article] [PubMed] [Google Scholar]
- 5.Levene RZ. Low-tension glaucoma. A critical review and new material. Surv Ophthalmol 1980;24:621–64. [DOI] [PubMed] [Google Scholar]
- 6.Caprioli J, Spaeth GL. Comparison of the optic nerve head in high- and low-tension glaucoma. Arch Ophthalmol 1985;130:1145–9. [DOI] [PubMed] [Google Scholar]
- 7.Miller KM, Quigley HA. Comparison of optic disc features in low-tension glaucoma and typical open-angle glaucoma. Ophthalmic Surg 1987;18:882–9. [PubMed] [Google Scholar]
- 8.Fazio P, Krupin T, Feitl ME, et al. Optic disc topography in patients with low tension and primary open angle glaucoma. Arch Ophthalmol 1990;108:705–8. [DOI] [PubMed] [Google Scholar]
- 9.Yamagami J, Araie M, Shirato S. A comparative study of optic nerve head in low- and high-tension glaucomas. Graefes Arch Clin Exp Ophthalmol 1992;230:446–50. [DOI] [PubMed] [Google Scholar]
- 10.Drance SM. Some factors in the production of low-tension glaucoma. Br J Ophthalmol 1972;56:229–42. [DOI] [PMC free article] [PubMed] [Google Scholar]
- 11.Leighton DA, Phillips CI. Systemic blood pressure in open-angle glaucoma, low-tension glaucoma, and the normal eye. Br J Ophthalmol 1972;56:447–53. [DOI] [PMC free article] [PubMed] [Google Scholar]
- 12.Winder AF. Circulating lipoprotein and blood glucose levels in association with low-tension and chronic simple glaucoma. Br J Ophthalmol 1977;61:641–5. [DOI] [PMC free article] [PubMed] [Google Scholar]
- 13.Goldberg I, Hollows FC, Kass MA, et al. Systemic factors in patients with low tension glaucoma. Br J Ophthalmol 1981;65:56–62. [DOI] [PMC free article] [PubMed] [Google Scholar]
- 14.Airaksinen PJ, Drance SM, Douglas GR, et al. Diffuse and localized nerve fiber loss in glaucoma. Am J Ophthalomol 1984;98:566–71. [DOI] [PubMed] [Google Scholar]
- 15.Yang JG, Park KH. A comparison of optic nerve head topography in primary open-angle glaucoma and normal-tension glaucoma in Koreans. Korean J Ophthalmol 1997;11:79–83. [DOI] [PubMed] [Google Scholar]
- 16.Graefe A von. Über die Iridectomie bei Glaucom und über den Glaucomatösen Prezess. Albrecht von Graefes Archiv Klin Exp Ophthalmol 1857;13:456–650. [Google Scholar]
- 17.Airaksinen PJ, Drance SM. Neuroretinal rim area and retinal nerve fiber layer in glaucoma. Arch Ophthalmol 1985;103:203–4. [DOI] [PubMed] [Google Scholar]
- 18.Quigley HA, Addicks EM, Green WR. Optic nerve damage in human glaucoma: Quantitative correlation of nerve fiber loss and visual field defect in glaucoma, ischemic neuropathy, papilledema, and toxic neuropathy. Arch Ophthalmol 1982;100:135–46. [DOI] [PubMed] [Google Scholar]
- 19.Sommer A, Miller NR, Pollack I, et al. The nerve fiber layer in the diagnosis of glaucoma. Arch Ophthalmol 1984;95:2149–56. [DOI] [PubMed] [Google Scholar]
- 20.Yamazaki Y, Miyazawa T, Yamada H. Retinal nerve fiber layer analysis by a computerized digital image analysis system. Jpn J Ophthalmol 1990;34:174–80. [PubMed] [Google Scholar]
- 21.Yamazaki Y, Koide C, Miyazawa T, et al. Comparison of retinal nerve-fiber layer in high-and normal-tension glaucoma. Graefes Arch Clin Exp Ophthalmol 1991;229:517–20. [DOI] [PubMed] [Google Scholar]
- 22.Kubota T, Khalil AK, Honda M, et al. Comparative study of retinal nerve fiber layer damage in Japanese patients with normal-and high-tension glaucoma. J Glaucoma 1999;8:363–6. [PubMed] [Google Scholar]
- 23.Funaki S, Shirakashi M, Yaoeda K, et al. Specificity and sensitivity of glaucoma detection in the Japaneses population using scanning laser polarimetry. Br J Ophthalmol 2002;86:70–4. [DOI] [PMC free article] [PubMed] [Google Scholar]


