Abstract
Class I ribonucleotide reductases (RNRs) are composed of two subunits, R1 and R2. The R2 subunit contains the essential diferric cluster–tyrosyl radical (Y⋅) cofactor and R1 is the site of the conversion of nucleoside diphosphates to 2′-deoxynucleoside diphosphates. A mutant in the R1 subunit of Escherichia coli RNR, E441Q, was generated in an effort to define the function of E441 in the nucleotide-reduction process. Cytidine 5′-diphosphate was incubated with E441Q RNR, and the reaction was monitored by using stopped-flow UV-vis spectroscopy and high-frequency (140 GHz) time-domain EPR spectroscopy. These studies revealed loss of the Y⋅ and formation of a disulfide radical anion and present experimental mechanistic insight into the reductive half-reaction catalyzed by RNR. These results support the proposal that the protonated E441 is required for reduction of a 3′-ketodeoxynucleotide by a disulfide radical anion. On the minute time scale, a second radical species was also detected by high-frequency EPR. Its g values suggest that this species may be a 4′-ketyl radical and is not on the normal reduction pathway. These experiments demonstrate that high-field time-domain EPR spectroscopy is a powerful new tool for deconvolution of a mixture of radical species.
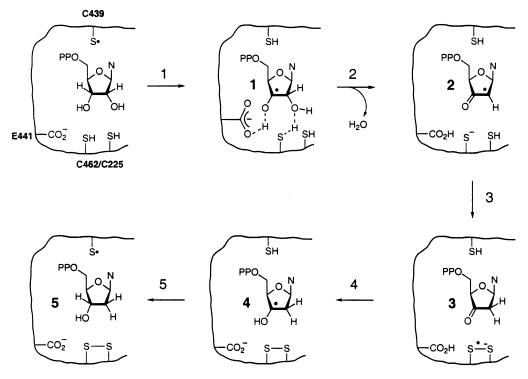
Ribonucleotide reductases (RNRs) catalyze the conversion of nucleotides to deoxynucleotides in all organisms (1–3). These enzymes have been divided into four classes based on the metallo-cofactor required to initiate the radical-dependent nucleotide-reduction process. Recent structural studies on class I and class III RNRs (4–6) support the original proposal of Stubbe and coworkers that, despite the differences in the metallo-cofactors in the various classes of RNRs, the function of each cofactor is to generate a thiyl radical that, via a common mechanism, initiates nucleotide reduction by 3′-hydrogen atom abstraction (Scheme S1) (7–9). A further commonality between class I and II RNRs is the presence of a conserved glutamate residue adjacent to the two cysteine residues that deliver the reducing equivalents essential for the reduction process (5). This paper provides evidence that the role of this glutamate (in the protonated form) is to facilitate the reduction of the 3′-ketodeoxynucleotide 3 (Scheme S1) by a disulfide radical anion intermediate.
Scheme 1.
Much is known about the initial stages of the reduction process (1, 10). There is direct evidence that in the class II, adenosylcobalamin-dependent RNRs, the metallo-cofactor generates a thiyl radical in a kinetically-competent fashion (11, 12). Recent studies with a class I RNR containing a diferric tyrosyl radical (Y⋅) cofactor and a class II RNR using cytidine nucleotide analogs provided direct evidence that the thiyl radical generates a 3′-nucleotide analog radical (13–16). Once 1 is generated, there is also excellent model precedent that a ketyl radical 2 is generated subsequent to loss of water from the 2′ position of the nucleotide (17, 18).
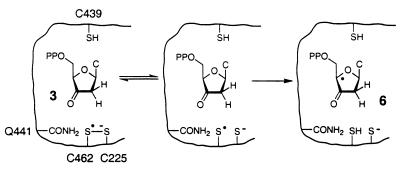
The mechanism for the reduction of 2 has received less experimental attention. Biochemical and crystallographic experiments indicate that C225 and C462 in the Escherichia coli class I RNR are oxidized concomitant with nucleotide reduction (4, 5, 19, 20). We have proposed that this reaction proceeds by an electron-coupled proton transfer to 2 from the thiolate of C225 and the sulfhydryl of C462 to form a 3′-ketodeoxynucleotide 3 and a three-centered bond, the disulfide radical anion (8, 21). Compound 3 is also proposed to be reduced by electron-coupled proton transfer. The resulting 3′-deoxynucleotide radical 4 would then be rapidly reduced to generate product 5 and to regenerate the thiyl radical on C439. The importance of coupling the proton transfer to the electron transfer thermodynamically in step 4 (Scheme S1) of the reduction process has recently been pointed out (10, 17), and the structure of class I RNR suggested that the protonated glutamate plays an important role in this process (5, 17).
The potential role of the glutamate (acid) in both the chemistry of water loss and ketone reduction provided the impetus to make and investigate a glutamate → glutamine mutation of residue 441 (22). The same mutant was also recently prepared by Sjöberg and coworkers (23). We have predicted that the slow chemical step in the conversion of NDPs to dNDPs is the reduction of 3 by the disulfide radical anion (10). Mutation of the glutamate to glutamine would thus be expected to allow buildup of this intermediate in sufficient quantities that it might be detectable. In this paper, we report direct spectroscopic evidence for the disulfide radical anion in the class I RNRs.
MATERIALS AND METHODS
EPR tubes for 9-GHz spectroscopy (quartz, o.d. 4 mm, i.d. 2.4 mm) and for 140-GHz spectroscopy (silica, o.d. 0.55 mm, i.d. 0.40 mm) were purchased from Wilmad (Buena, NY). The mutant E441Q R1 (inactive with respect to nucleotide reduction) and R2 (specific activity 5,800–8,000 nmol⋅min−1⋅mg−1) were grown and purified as described (22, 24). Their concentrations were measured spectrophotometrically by using ɛ280 = 189,000 M−1⋅cm−1 and 130,500 M−1⋅cm−1 for R1 and R2, respectively. The Y⋅ content of R2 was assessed by the drop-line correction method (25). E441Q R1 was prereduced as described (20).
Stopped-flow (SF) studies were carried out at 25°C by using an Applied Photophysics (Surrey, U.K.) DX.18MV SF spectrophotometer. Data was collected in either diode-array mode or in single-wavelength mode. In the latter case, a minimum of three traces were used to obtain an average for each condition tested. Linear and nonlinear least-squares fits to SF data were carried out by using either the Applied Photophysics system software or kaleidagraph. Diode-array SF spectra were analyzed with specfit (Spectrum Software Associates, Chapel HIll, NC) or pro-k (Applied Photophysics) software.
EPR spectra at 9 GHz were acquired on a Bruker ESP-300 spectrometer at 100 K. EPR spectra at 140 GHz were acquired with a custom-designed high-sensitivity pulsed spectrometer (26). Typical π/2 pulses of 70 ns were achieved by using a high-quality (Q ≈ 3,000) cylindrical cavity with an incident microwave power of 5 mW. The absolute spin sensitivity at low temperatures has been previously determined to be 3 × 10⁹ spins⋅G−1 (26) and allows for detection of μM spin concentrations in less than a microliter volume. Pulsed EPR spectra were acquired by using a standard three-pulse stimulated echo sequence (tπ/2 = 72 ns, pulse spacing τ1 = τ2 = 230 ns) and integrating the echo intensity over the magnetic field sweep. Experimental conditions, such as the number of transients per point, number of scans, and recycle delays were adjusted for different signal intensities and temperature and are reported in the figure legends.
SF UV-Vis Spectroscopy.
Syringe A contained 75 μM prereduced E441Q R1, 3.34 mM cytidine 5′-diphosphate (CDP), 0.2 mM dTTP, 10 mM DTT, and 15 mM Mg(OAc)2 in 50 mM Tris (pH 7.6). Syringe B contained 75 μM R2 (based on Y⋅), 0.2 mM dTTP and 15 mM Mg(OAc)2 in 50 mM Tris (pH 7.6). The reaction was commenced by rapidly mixing 25 μl from each syringe and was monitored at 412 nm for 20 s or 100 s by using a split time base (500 points from 0 to 0.5 s, 500 points from 0.5–20 s or 100 s). The experiment was also performed in diode-array mode by using the same syringe contents as above and recording 800 spectra from 350 to 700 nm for 30 s. Three alternative mixing modes were also investigated. In case one, prereduced E441Q R1, CDP, and dTTP in one syringe was mixed with R2 and dTTP in a second syringe. In case two, E441Q R1, dTTP, and DTT was mixed with R2, CDP, and dTTP. In case three, E441Q R1, R2, dTTP, and DTT was mixed with CDP, dTTP, and DTT. In each case, the final concentration of each component was the same as indicated above, and each syringe contained 15 mM Mg(OAc)2 and 50 mM Tris (pH 7.6).
EPR Spectroscopy.
For preparation of samples to be analyzed at 9 GHz, a 150-μl solution of 150 μM prereduced E441Q R1, 100 μM R2 (in Y⋅), 0.2 mM dTTP, 5 mM DTT, and 15 mM Mg(OAc)2 in 50 mM Tris (pH 7.6) was placed in an EPR tube. An equal volume of 3.34 mM CDP, 0.2 mM dTTP, 5 mM DTT, and 15 mM Mg(OAc)2 in 50 mM Tris (pH 7.6) was then added. After mixing, the solution was frozen at t = 10 s or t = 3 min by immersion into a bath of liquid isopentane cooled to −140°C by a surrounding jacket of liquid nitrogen. Several control experiments were carried out. In one control, a solution of 200 μM prereduced E441Q R1, 3.34 mM CDP, 0.2 mM dTTP, and 15 mM Mg(OAc)2 was prepared in 50 mM Tris (pH 7.6), and the reaction commenced by addition of an equal volume of 200 μM R2 (in Y⋅), 0.2 mM dTTP, and 15 mM Mg(OAc)2 in 50 mM Tris (pH 7.6). A second control revealed that the trapped intermediates were stable for at least 3 weeks when stored in liquid nitrogen. Samples to be analyzed by EPR spectroscopy at 140 GHz were prepared in a fashion similar to that described above except that the final volume was 10 μl and the final concentrations of R1, R2 (in Y⋅), and dTTP were 282 μM, 282 μM, and 0.8 mM, respectively. Samples were drawn into a sample tube by capillary action to a height of ≥2 mm, frozen in isopentane, and stored in liquid nitrogen. The small sample volume required special precautions to prevent warming while loading the sample into the cavity. The EPR probe was cooled by immersion in liquid nitrogen, and the sample tube was loaded into the TE011 cylindrical resonator of the EPR probe under liquid nitrogen before being placed inside the Dewar flask, cooled to 80 K.
Spin quantitation at 9 GHz was achieved by double integration and comparison to a 100 μM sample of R2 whose Y⋅ content had been established by using UV-vis spectroscopy. Spectra of quenched samples and of the Y⋅ standard were recorded under identical conditions as given in the text. Data manipulations were performed by using kaleidagraph software.
RESULTS
Radical Species Generated During the Incubation of E441Q R1 RNR with CDP and dTTP.
Recent studies by Persson et al. (27) reported that incubation of E441Q R1 RNR with CDP and the allosteric effector dTTP resulted in loss of the Y⋅ accompanied by formation of at least two new radical species. These species were examined by 9-GHz EPR spectroscopy. The initial radical they observed, at 10 s, was a composite of Y⋅ and at least one new radical. On subtraction of the predominant Y⋅, the spectrum of the new radical was reported to have a gav of 2.01. These workers concluded that this new radical species was the C439 thiyl radical generated concomitant with loss of the Y⋅ (27). The reported g values, however, are inconsistent with their thiyl radical assignment (28–31). In an effort to further support their thiyl radical assignment, Persson et al. repeated this experiment with β-2H-labeled cysteine E441Q R1 (27). The perturbation of the EPR spectrum confirmed that this radical is in fact cysteine-based and provided the impetus for us to repeat their experiments.
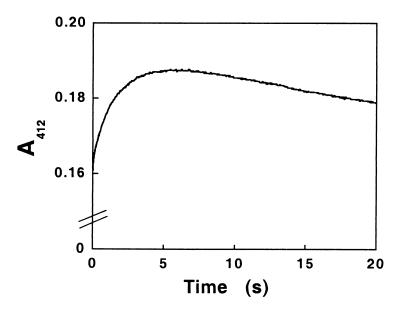
To determine the most appropriate time to quench the reaction for examination by EPR methods, we performed a SF experiment monitoring the reaction at 412 nm, the λmax of the Y⋅. The results of a typical experiment are shown in Fig. 1. The kinetic changes are complex. In contrast to expectations, A412 increases and then decreases in a much slower phase. The maximum absorbance is reached at ≈5 s, and a fit of the data between 0 and 5 s to a single exponential gives a rate constant of 0.8 s−1. The decrease in A412 from 10 to 100 s can also be fitted to a single exponential with a rate constant of 0.035 s−1. A 9-GHz EPR analysis of a sample quenched at 10 s reveals loss of 20 ± 5% of the initial Y⋅ in addition to formation of the radical species described by Persson et al. (27). The observation of an increased A412 despite loss of the Y· (ɛ = 1,800 M−1⋅cm−1) suggests that the new radical species must have an A412 with a larger extinction coefficient than the Y⋅. The kinetics and amounts of the intermediate were unaffected by changing the order of mixing of the reagents or by using prereduced E441Q R1 in the absence of an external reductant (DTT).
Figure 1.
SF UV-vis spectroscopy at 412 nm. E441Q R1 (75 μM), CDP (3.34 mM), dTTP (0.2 mM), and DTT (10 mM) in Tris buffer were mixed with an equal volume of R2 (75 μM) in the same buffer. Data (1,000 points) were acquired to 20 s.
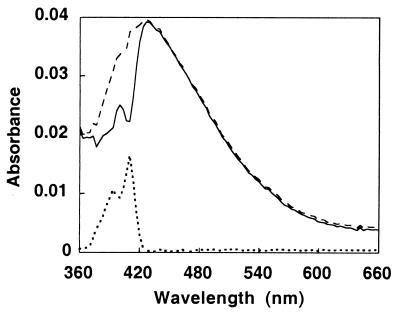
To examine these changes more carefully and to determine the visible spectroscopic characteristics of this (these) new species, we carried out a similar SF experiment with detection by using a diode-array spectrometer (data not shown). A new species clearly formed and decayed in the region between 350 and 500 nm. Examination of the proposed mechanism of nucleotide reduction (Scheme S1) reveals two species, in addition to the Y⋅ on R2, that have absorption features in the visible region: a thiyl radical (λmax = 325–330 nm (ɛ = 300–600 M−1⋅cm−1) and a disulfide radical anion (λmax = 400–450 nm (ɛ = 8,000–15,000 M−1⋅cm−1) (32). To obtain the visible spectrum of this new species, one needs to subtract contributions to the spectrum from the diferric cluster and the Y⋅ of R2. Both of these species have been well characterized (25). Subtraction of the contribution from the diferric cluster is straightforward, because this species does not change during the course of the experiment. Subtraction of the Y⋅ is more complex because the amount lost during the 10-s incubation is not easy to quantify because the Y⋅ and the new radical have spectral overlap in both the visible spectrum and in the EPR spectrum (see below). The results of a spectroscopic subtraction in which the initial visible spectrum (obtained at 2.5 ms) is subtracted from that obtained at 10 s (Fig. 2) reveals a spectrum similar to those previously reported for disulfide radical anions (32, 33).
Figure 2.
Diode-array SF UV-vis spectroscopy: Difference spectrum of the 10-s intermediate. Detection was made by diode array, and data (800 scans) were acquired to 32 s (2.56-ms integration time) on a linear time scale. The first spectrum was recorded 2.5 ms after mixing (instrument dead time). The difference spectrum (solid line) was obtained by subtraction of the starting spectrum from the spectrum recorded at 10 s. To obtain the complete spectrum of the intermediate, a proportion of the Y⋅ (dotted line) must be added to the difference spectrum, because EPR analysis reveals loss of Y⋅ during the first 10 s. The dashed line shows the spectrum obtained by adding 0.23 equivalent of Y⋅ to the difference spectrum. The exact amount of Y⋅ lost during the first 10 s is difficult to quantitate because of spectral overlap in both the EPR and UV-vis spectra.
EPR Spectrum at 9 and 140 GHz of the 10-S Radical.
As described above, with 9 GHz EPR spectroscopy, Persson et al. (27) detected a new radical with a gav of 2.01 at 10 s. However, the superposition of three powder spectra—the new signal observed at 10 s, the predominant Y⋅, and an additional signal to be discussed below—made assembly of the unique spectrum of the 10-s radical challenging given the spectral overlap. Using the same conditions and using similar subtraction methods, we reproduced their results. A control experiment with prereduced E441Q R1 in place of E441Q R1 and DTT ensured that this new feature was not associated with the DTT in the reaction mixture. Analysis of the amount of total radical present in the sample quenched at 10 s reveals that 20 ± 5% of the starting Y⋅ has been lost but that it is not quantitatively converted into the new radical species. Once again, this quantitation is complicated by the presence of spectral overlap of multiple species.
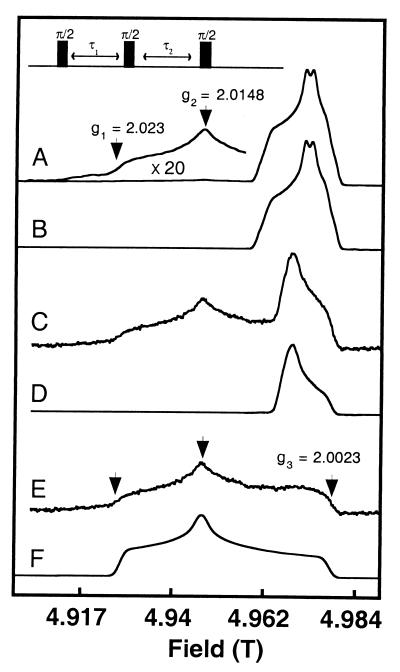
To establish accurate g values for this new species, we recorded the spectrum at 140 GHz, where the 15-fold higher g factor resolution (relative to 9 GHz) permits us to distinguish between the radical of interest and the remaining Y⋅ (Fig. 3A). On the low-field side, two g values of 2.023 and 2.015 of the new radical are readily apparent. At high field, the Y⋅ (Fig. 3B) obscures the third g value, and its high intensity relative to the new radical once again makes difference spectroscopy problematic.
Figure 3.
Stimulated echo-detected EPR spectra at 140 GHz of the E441Q R1 reaction quenched 10 s after mixing. (A) Single-scan spectrum at 20 K collecting 300 transients per point. The pulse spacings are τ1 = τ2 = 230 nsec, and the repetition rate is 10 ms. The Inset shows an average of 20 scans, magnified 20-fold. (B), The spectrum of the R2 Y⋅ recorded under the same conditions as in A. (C) Electron-spin echo-detected spectrum of the same mixture as A at 60 K collecting 300 transients per point; the low-field (49,050–49,570 G) and high-field (49,570–49,900G) parts of the spectrum were recorded with steps of 2 G and 1 G, respectively. (D) Reference spectrum of the radical present after 3 min of incubation (see Fig. 4B). (E) Spectrum of the putative disulfide radical anion obtained by subtraction of spectrum D from spectrum C. (F) Calculated powder pattern for g1 = 2.023, g2 = 2.015, and g3 = 2.002 and two isotropic hyperfine couplings a1 = a2 = 10 G. The stimulated echo pulse sequence used is shown at the top of the Figure.
Separation of EPR Signals by Time-Domain EPR Spectroscopy.
To obtain the EPR signals of the new radical(s) generated during incubation of E441Q R1 with R2 and CDP, it is necessary to filter the intense signal of the remaining Y⋅. This is possible with time-domain techniques that exploit the enhanced spin–lattice relaxation time (T1) of the Y⋅ located on R2. Analysis of the relaxation behavior of the Y⋅ has previously indicated that the short T1 is due to magnetic dipolar and exchange interactions with the adjacent diferric cluster (34). Furthermore, in 140-GHz CW experiments, we have previously noticed that the Y⋅ does not saturate, whereas radicals resident in the active site of R1 are difficult to observe because of saturation effects (35). In a preliminary saturation–recovery experiment, we observed that the T1 of the Y⋅ is strongly temperature-dependent, ranging from ≈3 ms at 12 K to <1 μs at 55 K. The latter time approaches the length of the stimulated echo pulse sequence. Above 60 K, the pulse EPR spectrum of the Y⋅ is no longer detectable because of its fast magnetization decay after the first microwave pulse. The EPR signals of other radicals with longer relaxation times, however, remain visible. Thus, this T1 filter permits suppression of the spectrum of the predominant Y⋅ (90%) and observation of the EPR spectra of the radicals of interest.
Fig. 3C shows the echo-detected 140-GHz EPR spectrum at 60 K of the reaction quenched 10 s after mixing. The low-field side of the spectrum remains unchanged relative to that obtained at 20 K (Fig. 3A). However, on the high-field side, the characteristic features of the Y⋅ have disappeared, and a new axially asymmetric powder pattern is visible. A comparison with spectra of samples of the reaction mixture quenched at 3 min after mixing reveals that, in addition to the sulfur-centered radical, the 10-s sample also contains significant amounts of a second radical observed at later times (Fig. 3D). Subtraction of this second species from the spectrum in Fig. 3C reveals the complete spectrum of the sulfur-centered radical (Fig. 3E). The powder pattern is dominated by an axially asymmetric g anisotropy with principal values of g1 = 2.023, g2 = 2.015, and g3 = 2.002. These g values eliminate a thiyl radical (28–30) and a persulfide radical (28, 36, 37) as the source of this signal and are consistent with a disulfide radical anion (Table 1) (28, 38–40). Finally, we also note in the low-field edge of the spectrum a long, weak tail (Fig. 3E). The origin of this intensity is unknown but could possibly arise from the disulfide radical anion in equilibrium with a thiyl radical (Scheme S2) (41–43). A simulated rigid-limit powder pattern of the putative disulfide radical anion intermediate, including two isotropic hyperfine constants of 10 G, is shown in Fig. 3F. We believe that the deviations in the relative intensities at g1 and g3 may arise from anisotropic spin–spin relaxation, which typically affects the line shape at higher temperatures.
Table 1.
EPR parameters of thiyl radicals, persulfide radicals, disulfide radical anions, and the 10-s sulfur-based R1 radical observed during reaction of E441Q R1 with R2 and CDP
| Radical | g1 | g2 | g3 | a(G) | Ref. |
|---|---|---|---|---|---|
| RCH2S⋅ | 2.134–2.321 | 1.99–2.03 | 1.92–1.99 | 12–16 (H1)†, 28–39 (H1)† | 28–31 |
| RCH2SS⋅ | 2.052–2.062 | 2.023–2.027 | 1.998–2.006 | 5–11 | 28, 36, 37 |
| RCS2S·-— SCH2R′ | 2.017–2.024 | 2.014–2.020 | 2.002 | 8–11 (H1, H2)† | 28, 38–40 |
| This work | 2.023 | 2.015 | 2.002 | 10 (H1, H2)*† |
Parameters used in the simulation of the experimental spectrum shown in Fig. 3 F.
H1 is one proton, and H2 is the second proton.
Scheme 2.
A Second EPR Active Species Observed at 3 Minutes.
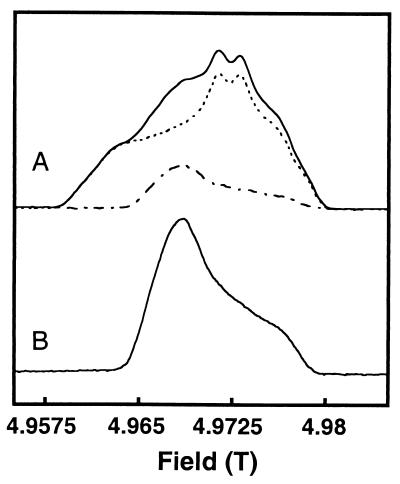
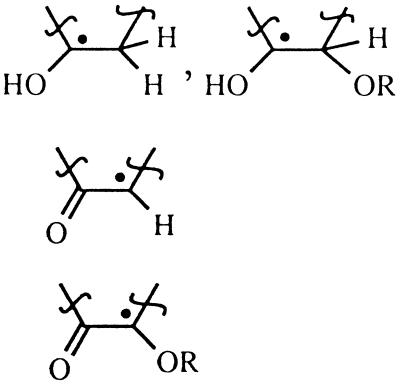
The report of Persson et al. (27) described a second EPR active species kinetically linked to their putative thiyl radical. The fact that the species was nucleotide-based was confirmed in an experiment by using [U-13C]CDP. They proposed that this new species was the 3′-nucleotide radical 1. Given that the first radical is not the C439 thiyl radical, it is unlikely that the second radical could be 1. We therefore recorded a high-field (140 GHz) pulsed-EPR spectrum of this second radical as shown in Fig. 4B. Once again, the three-pulse echo filter permits the spectrum of the nucleotide-based radical of interest to be obtained devoid of the remaining Y⋅. The spectrum is identical to the one obtained by more conventional difference spectroscopy (Fig. 4A). The g values of the nucleotide-based radical are estimated from the main turning points of the derivative spectrum and are 2.0072, 2.0061, and 2.0021, giving a gav of 2.0051. From published data (18, 44–46) discussed below, it is clear that this new radical cannot be a 3′ nucleotide radical as originally proposed (27). The g values suggest that it is a ketyl radical with an oxygen attached to the carbon on which the unpaired electron is localized (Table 2) (44). Whereas we are examining this radical structure in more detail by using high-field electron (ENDOR) methods (26), it is clear that this radical is not on the normal nucleotide-reduction pathway. It represents yet another example of the difficulty of deriving mechanistic insight from radicals generated on a second-to-minute time scale (1).
Figure 4.
Stimulated echo-detected EPR spectra at 140 GHz of the E441Q R1 reaction quenched 3 min after mixing. The stimulated echo pulse sequence used was the same as in Fig. 3. The parameters (pulse spacing and repetition rates) are the same as those described in Fig. 3 for 20 K (A) and 60 K (C). (A) Spectrum at 20 K, 8 scans, collecting 300 transients per scan. The solid line displays the total signal resulting from contributions of the tyrosyl radical and the new radical. The dotted line is the spectrum of the R2 Y⋅ recorded under the same conditions. The dashed line is the spectrum of the new radical obtained by subtraction of the Y⋅ from the total signal. (B) Electron-spin echo-detected spectrum of the same mixture as A at 60 K collecting 300 transients per point, 120 scans. The g values were determined from maxima, minima, and zero-crossing points of the derivative spectrum.
Table 2.
EPR parameters of α-hydroxy radicals, ketyl radicals, and the 3-min nucleotide radical formed in reaction of E441Q R1 with R2 and CDP
*The determined principal g values were g1 = 2.0072, g2 = 2.0061, and g3 = 2.0021.
DISCUSSION
Mutant R1s, kinetics, and EPR spectroscopy have proven to be effective tools to investigate the mechanism of class I RNRs (1). Both our laboratory and that of Sjöberg have mutated the conserved glutamate residue of class I E. coli RNR (E441) in an effort to elucidate its function (22, 23). Our mechanistic rationale for this mutation is based on our proposal that the rate-determining step in the chemistry of the nucleotide reduction is reduction of 3 by a disulfide radical anion to generate a 3′-deoxynucleotide radical 4 and a disulfide (Scheme S1, step 4) (10). In this mechanism, protonation of the ketone by the protonated E441 is required for the electron transfer to be thermodynamically favorable (10, 17). Our model thus predicts that both a disulfide radical anion and 3 might build up in E441Q R1. Both of these species can potentially be detected experimentally.
We initially carried out SF UV-vis experiments with E441Q R1 monitoring A412 to obtain insight into the rapidity and extent of Y⋅ loss. We observed an increase in A412 (0.8 s−1), maximizing around 5 s, followed by a slow decrease (0.035 s−1). To see an increase in A412, a second species must be forming and have a larger extinction coefficient than the Y⋅ (1,800 M−1⋅cm−1), which is lost. Examination of the proposed reaction pathway for nucleotide reduction (Scheme S1) reveals that the only species with absorption features at ≈400 nm are the Y⋅ and a disulfide radical anion. Our initial studies have therefore focused on identification of the species present at 5–10 s by using visible and EPR spectroscopies. The appearance of this new feature in the 400-nm region on a time scale similar to that reported by Persson et al. for formation of a cysteine-based radical (27) allowed us to favor the disulfide radical anion formulation.
The use of high-field (140-GHz) pulsed EPR spectroscopy has greatly facilitated our ability to identify one of the 10-s intermediates as a disulfide radical anion. The stimulated echo filter, taking advantage of the fast relaxation properties of the Y⋅ arising from its proximity to the dinuclear iron center, allowed removal of the predominant Y⋅ feature from the 10-s spectrum at T ≥60 K.
The value of the pulsed method, as well as its validity, is best illustrated with the radical species observed at longer times (3 min) and also present in the 10-s sample. The method of difference spectroscopy is shown in Fig. 4A. The Y⋅ spectrum is recorded at time t = 0, and the spectrum of the sample at 3 min is again recorded. At T = 20 K, the relaxation times of the Y⋅ are still long enough that the spin echo-detected spectrum results in a superposition of Y⋅ and the new radical. The resulting difference spectrum is also shown in Fig. 4A. By using the three-pulse echo filter at higher temperature, one can obtain the spectrum of the unknown radical directly (Fig. 4B). A comparison of the two spectra (Fig. 4 A and B) reveals that they are identical. Thus, for class I RNRs, the time-domain methodology provides a new tool to facilitate identification of new radicals generated in R1 that are masked by the intensity of the Y⋅ on R2.
Having established the utility of the pulsed method, we applied it to the 10-s radical. The results are shown in Fig. 3C. Removal of the Y⋅ by time-domain spectroscopy greatly simplifies the observed signal and reveals two low-field g values. Furthermore, it demonstrates that even at 10 s, a substantial amount of the 3-min radical is already present. The kinetic relationship between decay of the 10-s radical and formation of the 3-min radical remains to be determined.
Given that the 3-min radical appears to be a single species and its spectrum is well characterized (Figs. 3D and 4B), one can now obtain the spectrum of the 10-s radical by subtraction of the 3-min radical. The resulting spectrum (Fig. 3E) and its simulation (Fig. 3F) are consistent with a disulfide radical anion (28, 38–40). As noted in Table 1, the three principal-axis g values obtained are not compatible with previously reported thiyl radicals or persulfide radicals (28–30, 36, 37).
To further characterize this species, efforts were undertaken to obtain its visible spectrum by diode-array SF UV-vis spectroscopy. The difference spectrum obtained at 10 s relative to that at t = 2.5 ms (where 100% of the starting Y⋅ is assumed to be present) is shown in Fig. 2. Further analysis suggests that 20 ± 5% of the starting Y⋅ is actually lost during the first 10 s, in agreement with the EPR data. Addition of Y⋅ (0.23 equivalent) back to the difference spectrum is therefore required to realize the actual spectrum of the new intermediate, revealing a spectrum similar to those reported for disulfide radical anions (32, 33). Thus, the increase in A412 in the first 5 s (Fig. 1) appears to be predominantly associated with formation of a disulfide radical anion (ɛ = 8,000–15,000 M−1⋅cm−1) which masks the loss of the Y⋅ (ɛ = 1,800 M−1⋅cm−1). The fact that an EPR spin quantitation analysis at 9 GHz reveals there is not a 1:1 correspondence between loss of the Y⋅ and formation of the new species suggests that the Y⋅, disulfide radical anion, and/or other radical intermediates are being quenched.
The detection of a disulfide radical anion is potentially mechanistically significant, because our model (Scheme S1) predicts its accumulation with E441Q R1 (10). Thus, these experiments provide insight into the mechanism of the reduction of 3 during dNDP formation. The kinetic complexity of the interaction of this mutant with CDP, however, requires further analysis.
Finally, the paper of Persson et al. assigns the second radical formed on the minute time scale and already present in the 10-s sample as 1 (Scheme S1, step 1) (27). An examination of the literature reveals that the gav value reported by Persson et al. is inconsistent with radicals having a structural similarity to 1 or 4 (Table 2) (18, 44–46). Although we have not studied the 3-min radical in-depth, we have established its principal-axis g values (Fig. 4), which give a gav similar to that reported by Persson et al. A search of the literature reveals that this radical is most reasonably associated with a hydroxylated ketyl radical (Table 2; ref. 44). We propose that this radical is the 4′-ketyl radical 6 (Scheme S2) generated by a thiyl radical (C462) in equilibrium with the disulfide radical anion. If this assignment turns out to be correct, then this radical is not on the normal reduction pathway.
Studies with E441Q R1 have provided insight into the mechanism of nucleotide reduction. A disulfide radical anion has been detected by both EPR and UV-vis spectroscopies. More detailed analysis is required to understand the kinetic complexity of this system. However, the postulated role of E441 in the reduction of 3 by a disulfide radical anion and the latter’s detection when E441Q R1 is studied provides support for our postulated reduction mechanism of the catalytic cycle of RNR.
Acknowledgments
This work was supported by National Institutes of Health Grant GM-29595 (J.S.) and by National Institutes of Health Grants GM-38352 and RR-00995 (R.G.G.).
ABBREVIATIONS
- RNR
ribonucleotide reductase
- SF
stopped-flow
- Y⋅
the tyrosyl radical on the R2 subunit of E. coli RNR
- CDP
cytidine 5′-diphosphate
References
- 1.Stubbe J, van der Donk W A. Chem Rev. 1998;98:705–762. doi: 10.1021/cr9400875. [DOI] [PubMed] [Google Scholar]
- 2.Reichard P. Science. 1993;260:1773–1777. doi: 10.1126/science.8511586. [DOI] [PubMed] [Google Scholar]
- 3.Sjoberg B-M. Struct Bond. 1997;88:139–173. [Google Scholar]
- 4.Uhlin U, Eklund H. Nature (London) 1994;370:533–539. doi: 10.1038/370533a0. [DOI] [PubMed] [Google Scholar]
- 5.Uhlin U, Eklund H. J Mol Biol. 1996;262:358–369. doi: 10.1006/jmbi.1996.0519. [DOI] [PubMed] [Google Scholar]
- 6.Logan D T, Andersson J, Sjoberg B-M, Nordlund P. Science. 1999;283:1499–1504. doi: 10.1126/science.283.5407.1499. [DOI] [PubMed] [Google Scholar]
- 7.Stubbe J. Adv Enzymol Relat Areas Mol Biol. 1990;63:349–417. doi: 10.1002/9780470123096.ch6. [DOI] [PubMed] [Google Scholar]
- 8.Stubbe J. J Biol Chem. 1990;265:5329–5332. [PubMed] [Google Scholar]
- 9.Stubbe J, Ackles D. J Biol Chem. 1980;255:8027–8030. [PubMed] [Google Scholar]
- 10.Licht S S, Stubbe J. In: Comprehensive Natural Product Chemistry (Enzymes and Enzyme Mechanisms) Poulter C D, editor. Vol. 5. Amsterdam: Elsevier; 1999. pp. 163–203. [Google Scholar]
- 11.Licht S S, Gerfen G J, Stubbe J. Science. 1996;271:477–481. doi: 10.1126/science.271.5248.477. [DOI] [PubMed] [Google Scholar]
- 12.Gerfen G J, Licht S S, Willems J-P, Hoffman B M, Stubbe J. J Am Chem Soc. 1996;118:8192–8197. [Google Scholar]
- 13.van der Donk W A, Yu G, Perez L, Sanchez R J, Stubbe J. Biochemistry. 1998;37:6419–6426. doi: 10.1021/bi9729357. [DOI] [PubMed] [Google Scholar]
- 14.van der Donk W A, Gerfen G J, Stubbe J. J Am Chem Soc. 1998;120:4252–4253. [Google Scholar]
- 15.Gerfen G J, van der Donk W A, Yu G, McCarthy J R, Jarvi E T, Matthews D P, Farrar C, Griffin R G, Stubbe J. J Am Chem Soc. 1998;120:3823–3835. [Google Scholar]
- 16.Silva D J, Stubbe J, Samano V, Robins M J. Biochemistry. 1998;37:5528–5535. doi: 10.1021/bi972934e. [DOI] [PubMed] [Google Scholar]
- 17.Lenz R, Giese B. J Am Chem Soc. 1997;119:2784–2794. [Google Scholar]
- 18.Buley A L, Norman R O C, Pritchett R J. J. Chem. Soc. B. 1966. , 849–852. [Google Scholar]
- 19.Mao S S, Holler T P, Yu G X, Bollinger Jr J M, Booker S, Johnston M I, Stubbe J. Biochemistry. 1992;31:9733–9743. doi: 10.1021/bi00155a029. [DOI] [PubMed] [Google Scholar]
- 20.Lin A I, Ashley G W, Stubbe J. Biochemistry. 1987;26:6905–6909. doi: 10.1021/bi00396a006. [DOI] [PubMed] [Google Scholar]
- 21.Ashley G W, Stubbe J. In: Inhibitors of Ribonucleoside Diphosphate Reductase Activity. Cory J G, Cory A H, editors. Oxford: Pergamon; 1989. pp. 55–87. [Google Scholar]
- 22.van der Donk W A, Yu G, Silva D J, Stubbe J, McCarthy J R, Jarvi E T, Matthews D P, Resvick R J, Wagner E. Biochemistry. 1996;35:8381–8391. doi: 10.1021/bi960190j. [DOI] [PubMed] [Google Scholar]
- 23.Persson A L, Eriksson M, Katterle B, Potsch S, Sahlin M, Sjoberg B-M. J Biol Chem. 1997;272:31533–31541. doi: 10.1074/jbc.272.50.31533. [DOI] [PubMed] [Google Scholar]
- 24.Salowe S P, Stubbe J. J Bacteriol. 1986;165:363–366. doi: 10.1128/jb.165.2.363-366.1986. [DOI] [PMC free article] [PubMed] [Google Scholar]
- 25.Bollinger Jr J M, Edmondson D E, Huynh B H, Filley J, Norton J R, Stubbe J. Science. 1991;253:292–298. doi: 10.1126/science.1650033. [DOI] [PubMed] [Google Scholar]
- 26.Bennati M, Farrar C T, Bryant J A, Inati S J, Weis V, Gerfen G J, Riggs-Gelasgo P, Stubbe J, Griffin R G. J Magn Res. 1999;138:232–243. doi: 10.1006/jmre.1999.1727. [DOI] [PubMed] [Google Scholar]
- 27.Persson A L, Sahlin M, Sjoberg B-M. J Biol Chem. 1998;273:31016–31020. doi: 10.1074/jbc.273.47.31016. [DOI] [PubMed] [Google Scholar]
- 28.Nelson D J, Petersen R L, Symons M C R. J. Chem. Soc. Perkin Trans. 2. 1977. , 2005–2015. [Google Scholar]
- 29.Akasaka K. J Chem Phys. 1965;43:1182–1184. doi: 10.1063/1.1696900. [DOI] [PubMed] [Google Scholar]
- 30.Budzinski E E, Box H C. J Phys Chem. 1971;75:2564–2570. doi: 10.1021/j100686a007. [DOI] [PubMed] [Google Scholar]
- 31.Kou W W H, Box H C. J Chem Phys. 1976;64:3060–3062. [Google Scholar]
- 32.Hoffman M Z, Hayon E. J Am Chem Soc. 1972;94:7950–7957. [Google Scholar]
- 33.Chan P C, Bielski B H J. J Am Chem Soc. 1973;95:5504–5508. [Google Scholar]
- 34.Sahlin M, Petterson L, Gräslund A, Ehrenberg A, Sjöberg B-M, Thelander L. Biochemistry. 1987;26:5541–5548. doi: 10.1021/bi00391a049. [DOI] [PubMed] [Google Scholar]
- 35.van der Donk W A, Stubbe J, Gerfen G J, Bellew B F, Griffin R G. J Am Chem Soc. 1995;117:8908–8916. [Google Scholar]
- 36.Covès J, Le Hir de Fallois L, Le Pape L, Décout J-L, Fontecave M. Biochemistry. 1996;35:8595–8602. doi: 10.1021/bi960355o. [DOI] [PubMed] [Google Scholar]
- 37.Parast C V, Wong K K, Kozarich J W, Peisach J, Magliozzo R S. Biochemistry. 1995;34:5712–5717. doi: 10.1021/bi00017a002. [DOI] [PubMed] [Google Scholar]
- 38.Rao D N R, Symons M C R, Stephenson J M. J. Chem. Soc. Perkin Trans. 2. 1983. , 727–730. [Google Scholar]
- 39.Hadley J H, Jr, Gordy W. Proc Natl Acad Sci USA. 1974;71:4409–4413. doi: 10.1073/pnas.71.11.4409. [DOI] [PMC free article] [PubMed] [Google Scholar]
- 40.Rao D N R, Fisher V, Mason R. J Biol Chem. 1990;265:844–847. [PubMed] [Google Scholar]
- 41.Favaudon V, Tourbez H, Houee-Levin C, Lhoste J-M. Biochemistry. 1990;29:10978–10989. doi: 10.1021/bi00501a016. [DOI] [PubMed] [Google Scholar]
- 42.Armstrong D A. In: Sulfur-Centered Reactive Intermediates in Chemistry and Biology. Chatgilialoglu C, Asmus K-D, editors. New York: Plenum; 1990. pp. 121–134. [Google Scholar]
- 43.Asmus K-D. In: Sulfur-Centered Reactive Intermediates in Chemistry and Biology. Chatgilialoglu C, Asmus K-D, editors. New York: Plenum; 1990. pp. 155–172. [Google Scholar]
- 44.Gilbert B C, King D M, Thomas C B. J. Chem. Soc. Perkin Trans. 2. 1983. , 675–683. [Google Scholar]
- 45.Steenken S, Davies M J, Gilbert B C. J. Chem. Soc. Perkin Trans. 2. 1986. , 1003–1010. [Google Scholar]
- 46.Gilbert B C, Norman R O C, Williams P S. J. Chem. Soc. Perkin Trans. 2. 1981. , 1401–1405. [Google Scholar]


