Abstract
Aims: To study the effects of two commonly used pre-amplifier filtering bandwidths on normal multifocal electroretinogram (mfERG) responses and their comparative abilities to detect retinal disease.
Methods: 103 standard mfERGs were recorded simultaneously in two channels with different pre-amplifier settings (10–100 Hz and 10–300 Hz) from one eye of each of 20 normal subjects, 17 diabetics with non-proliferative diabetic retinopathy (NPDR), and 12 diabetics without retinopathy. Signal to noise ratios (SNR) of the normal subjects’ first order mfERGs were compared between channels. All subjects’ amplitudes and implicit times were derived using a “template stretching” method. For comparison, implicit time was also measured using a “template sliding” method. mfERG amplitudes and implicit times were compared between the channels and among subject groups.
Results: Normal mean amplitudes and implicit times were similar for the two channels. However, normal 10–100 Hz recordings had significantly higher SNR and lower intersubject variability than 10–300 Hz recordings. In NPDR, the 10–100 Hz channel identified significantly more implicit time and amplitude abnormalities. In the diabetics without retinopathy, 10–100 Hz filtering identified significantly more implicit time abnormalities than 10–300 Hz filtering. For both filter settings, diabetic implicit times were more often abnormal than amplitudes. The 10–100 Hz channel was superior for both implicit time measurements.
Conclusion: Standard mfERGs recorded from normal eyes and filtered 10–100 Hz contain less noise, higher SNR, and less intersubject variability than those filtered at 10–300 Hz. This underlies the finding that the 10–100 Hz filter setting identifies more retinal dysfunction than the 10–300 Hz setting.
Keywords: band pass filtering, diabetes, diabetic retinopathy, multifocal electroretinogram
The multifocal electroretinogram (mfERG) technique developed by Sutter and colleagues provides a powerful objective tool to study local visual function of the central retinal area.1 This technique allows the recording and mapping of photopic activity from hundreds of retinal locations within a few minutes. The mfERG is increasingly used to study both normal retinal function and local functional abnormalities in patients with retinal diseases.2–6
As with any human electrophysiological technique, signal filtering is crucial for eliminating biological and environmental noise that can contaminate the response of interest. This is especially important when one studies the mfERGs recorded from small retinal areas. However, in order to obtain high quality mfERGs without losing any useful information it is important to choose appropriate band pass frequencies. To record the “standard” mfERG, which utilises 75 Hz pseudorandom flicker and is the main multifocal paradigm, two different pre-amplifier frequency bands are often used. Most research studies have used a half amplitude band pass of 10–300 Hz, while 10–100 Hz filtering often has been used in clinical settings.
It appears to be generally believed that using a high frequency filter roll-off of 300 Hz permits recording of high frequency mfERG components. In fact, the ISCEV guidelines for recording mfERGs suggest a 300 Hz roll-off.7 However, frequency analysis of the standard first order mfERG kernel indicated the signal is concentrated primarily between 19–47 Hz.8 Therefore, using a high frequency roll-off of 300 Hz rather than 100 Hz may introduce more noise than signal which could, in turn, produce greater random variation of the mfERG waveforms and limit the clinical utility of the technique. To date there has not been a direct comparison of the two filter settings.
In this study, we examine the practical difference between the two amplifier settings by using a two channel recording technique. Although mfERGs can be refiltered through different band pass settings after the recording, it is not equivalent to real time filtering. Signal to noise ratio (SNR) analysis can objectively indicate whether the quality of a mfERG recording is dependent on the high frequency cutoff. To examine how filtering affects standard mfERGs, we first characterise and compare the SNR of the first order mfERG kernel recorded with the two filter settings in normal subjects. Then, using diabetes as an example, we examine whether the filter effects have consequences for the detection of retinal dysfunction in patients. To measure the mfERGs, we employed two techniques, a widely used “template sliding” method available in commercial multifocal software and a “template stretching” method shown previously to be sensitive to diabetes and other retinal diseases.9–16
METHODS
Subjects
Twenty eyes of 20 normal subjects were tested (14 right and six left eyes based on the subject’s preference). Nine men and 11 women, aged 28–60 years (mean 47.2 (SD 9.5) years), comprised the normal group. All normals were free of ocular and systemic disease and had 20/20 or better corrected visual acuity. All subjects had refractive errors between −6.00 D and +4.00 D. The left eyes of 17 diabetics with non-proliferative diabetic retinopathy (NPDR; eight men and nine women) and 12 diabetics without retinopathy (five men and seven women) were also tested. The diagnosis of diabetic retinopathy was made by dilated eye examination and fundus photograph grading, and the severity of diabetic retinopathy was classified according to ETDRS criteria.17 This diagnosis was made masked to the mfERG results. In the NPDR group, one patient had clinically significant macular oedema (CSMO), one had moderate NPDR, and the other 15 had only mild retinopathy. All eyes in the diabetic groups had 20/25 or better corrected visual acuity. Patients with visible media opacity or history of ocular disease or surgery were excluded from the study. NPDR subjects were aged 32–60 (51.7 (7)) years and the diabetics without retinopathy were 28–62 years old (49.2 (9.1)).
The purposes and potential risks of the study were explained, and informed consent was obtained from all subjects before testing. Procedures followed the tenets of the Declaration of Helsinki, and the protocol was approved by the University of California committee for the protection of human subjects.
mfERG recording
Multifocal ERGs were recorded using a VERIS 4.3 system (EDI, San Mateo, CA, USA). Pupils were dilated to 7–8 mm with 1.0% tropicamide and 2.5% phenylephrine. After the cornea was anaesthetised with 0.5% oxybuprocaine (proparacaine), a bipolar contact lens electrode (Hansen Ophthalmic, Solon City, IO, USA) was placed on the eye and a ground electrode clipped to the right earlobe. The fellow eye was occluded. An array of 103 hexagonal elements was delivered by an eye camera/display/refractor unit (EDI, San Mateo, CA, USA) driven at a 75 Hz frame rate. The hexagons were modulated between white (200 cd/m2) and black (<2 cd/m2) according to an m-sequence during the 7.5 minute recordings. Observers adjusted the stimulus unit for best focus of the central fixation target before the recording. Recordings were made in sixteen 30 second long segments. Recording quality and eye movements were monitored by real time display and the eye camera, respectively. Contaminated segments were discarded and repeated. Retinal signals were recorded simultaneously in two channels. One channel was filtered 10–300 Hz and the other was filtered 10–100 Hz (half amplitude roll-offs). mfERGs were processed in the usual way with one iteration of artefact removal and spatial averaging with 1/6 of the surrounding responses.
Data analysis
The local mfERGs were processed and are presented here in “retinal view.” The responses and their measurements are plotted at corresponding retinal locations rather than in visual field orientation.
Signal to noise ratio (SNR) analysis
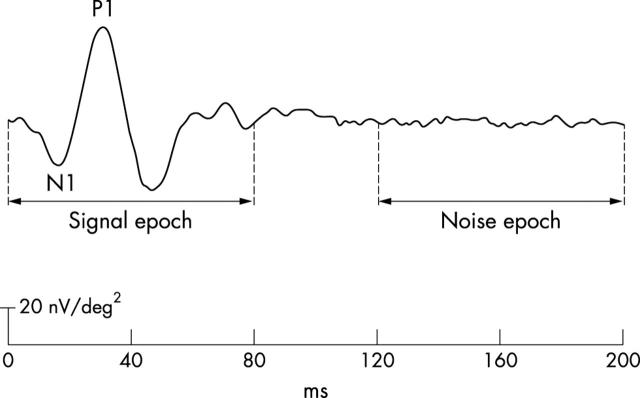
Each subject’s 103 first order mfERG kernels (200 ms post-flash epoch) were exported from VERIS for analysis in Matlab (The Mathworks, Natick, MA, USA). The first 80 ms of this epoch, which contains the mfERG waveform, were used to calculate the root mean square (RMS) amplitude of the “signal” (RMSsignal) (fig 1). The last 80 ms of the epoch were used to derive the “noise” RMS (RMSnoise). SNR was calculated at each of the 103 retinal locations, where SNR = RMSsignal/RMSnoise.18
Figure 1.
Signal to noise ratio (SNR) measurement. The first 80 ms (0–80 ms) of the first order mfERG is defined as the signal epoch and used to calculate RMSsignal. The last 80 ms (120–200 ms) is defined as the noise epoch and used to derive RMSnoise.
Implicit time and amplitude measurement
We used two methods to measure the implicit times of the mfERG. In the first (the “sliding method”), P1 implicit time (fig 1), was measured at each location using the cross correlation method in the VERIS software. In the second (a “stretching method” described in detail by Hood and Li8), the 103 mfERGs of each subject were compared to waveform templates representing the mean local waveforms of the normals (right eye responses were converted to left eye orientation). Each template was independently scaled in amplitude and time dimensions to obtain the best least square fit to each local response, providing P1 implicit time and N1-P1 amplitude.
Effects of filtering on normal response
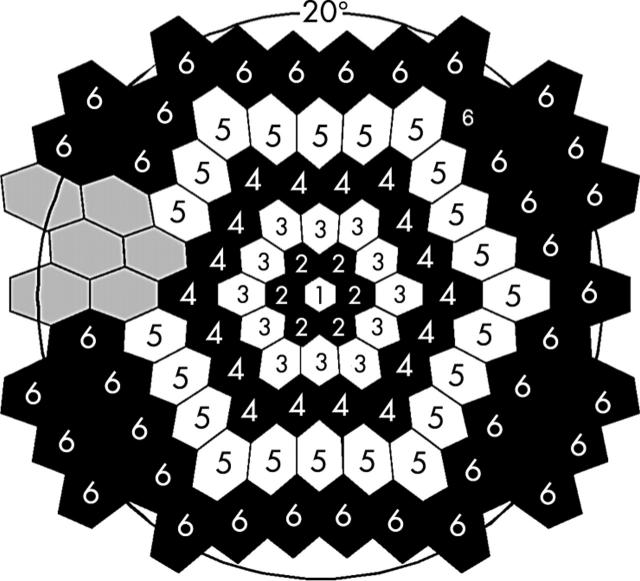
Means and standard deviations of the amplitude and implicit time measurements at each retinal location were calculated across the 20 normal subjects. The response measurements were then averaged within concentric rings around fixation, with the exception that six points in the vicinity of the optic disc were excluded (fig 2).
Figure 2.
Locations of ring response groups on the retina. The number in each hexagon indicates the number of the group. The grey hexagons show the excluded responses caused by the location of the optic disc.
mfERG abnormality analysis
Based on the mean and standard deviation of each local response measure obtained from the normals, Z-scores were calculated for all subjects. Abnormal implicit time was defined as a Z-score ⩾2.0 (p ⩽ 0.023) and abnormal amplitude as a Z-score ⩽−2.0 (p ⩽0.023). Frequency of mfERG abnormality was plotted for each subject group by calculating the percentage of eyes with abnormalities at each stimulated retinal location.
RESULTS
Signal to noise ratio (SNR) analysis of normal mfERGs
Figure 3A shows examples of mfERG trace arrays recorded with the two amplifier settings from the left eye of a 43 year old normal subject. The waveforms obtained with the two filters are different: the 10−100 Hz traces appear smoother than the apparently noisier 10−300 Hz waveforms. SNR analysis confirmed that the difference in waveform appearance was due to different noise levels associated with the two filter settings. As shown in figure 3B, the control group’s mean SNR was significantly higher in the 10−100 Hz channel (solid line) than in the 10−300 Hz channel (broken line) at each eccentricity (repeated measurement test, p = 0.01). Further analysis revealed that, whereas the two channels did not significantly differ in signal amplitude (RMSsignal), the amplitude of the noise (RMSnoise) in the 10−300 Hz channel was significantly greater than that in the 10−100 Hz channel (unequal variance t test, p = 0.02).
Figure 3.
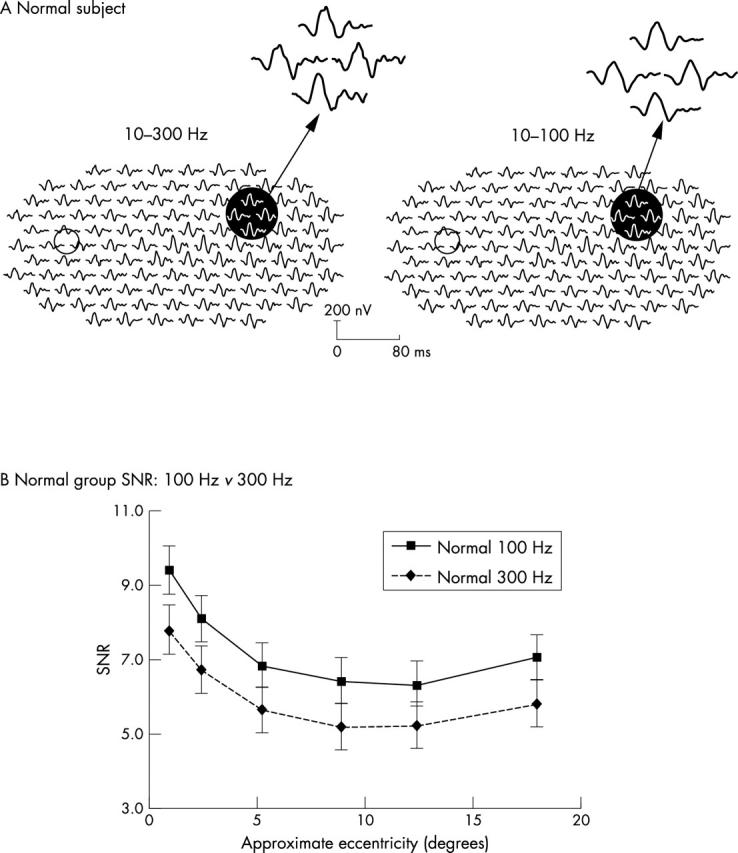
(A) mfERG array examples for the 10–100 Hz and the 10–300 Hz filtering from a control subject (left eye, retinal view). Small circles indicate the location of the optic disc. The responses within the dark circles are magnified to show the details. (B) Signal to noise ratio (SNR) in normal group: 10–100 Hz v 10–300 Hz. SNRs gradually decrease with eccentricity. The 10–100 Hz channel (solid line) had significantly higher SNR than the 10–300 Hz channel (broken line).
Effect of filtering on normal implicit times and amplitudes
The lower noise and higher SNR in the 10−100 Hz channel suggest that this filter setting might provide a practical advantage in clinical application. Compared to 10−300 Hz, 10−100 Hz filtering can be expected to provide more consistent mfERG waveforms and, thereby, decrease the random intersubject variability of mfERG measures. This could ultimately improve the ability of the mfERG to detect retinal dysfunction. As an initial test of this hypothesis, we compared the normal subjects’ implicit times and amplitudes in the two channels.
Implicit time
Both implicit time measurements (stretching and sliding) showed that similar retinal topographies were produced by the two filter settings, although the 10–100 Hz setting produced ~0.5 ms longer P1 implicit times in most locations (fig 4A). However, the standard deviation topographies for this measure differed between the channels. As shown on the left side of figure 4B for stretching, the 10–100 Hz channel had smaller (by more than 5%) intersubject standard deviations than the 10–300 Hz channel in 39 locations (solid hexagons). In contrast, the 10–300 Hz channel had smaller standard deviations in only 28 locations (grey hexagons). Thus, although the channels were similar in 36 locations (open hexagons), the 10–100 Hz channel had significantly lower implicit time variability in approximately 30% more locations (χ2 test, p = 0.03). The superiority of 10–100 Hz filtering over 10–300 Hz was even greater with the sliding method: The standard deviation of P1 implicit time was smaller in 68 locations (black hexagons) but greater in only six (grey hexagons) (fig 4B, right; χ2 test, p = 0.002). The difference between the measurement methods is probably the result of the low pass filtering incorporated into the stretching method, which makes it more immune to the effects of high frequency noise than the sliding method.
Figure 4.
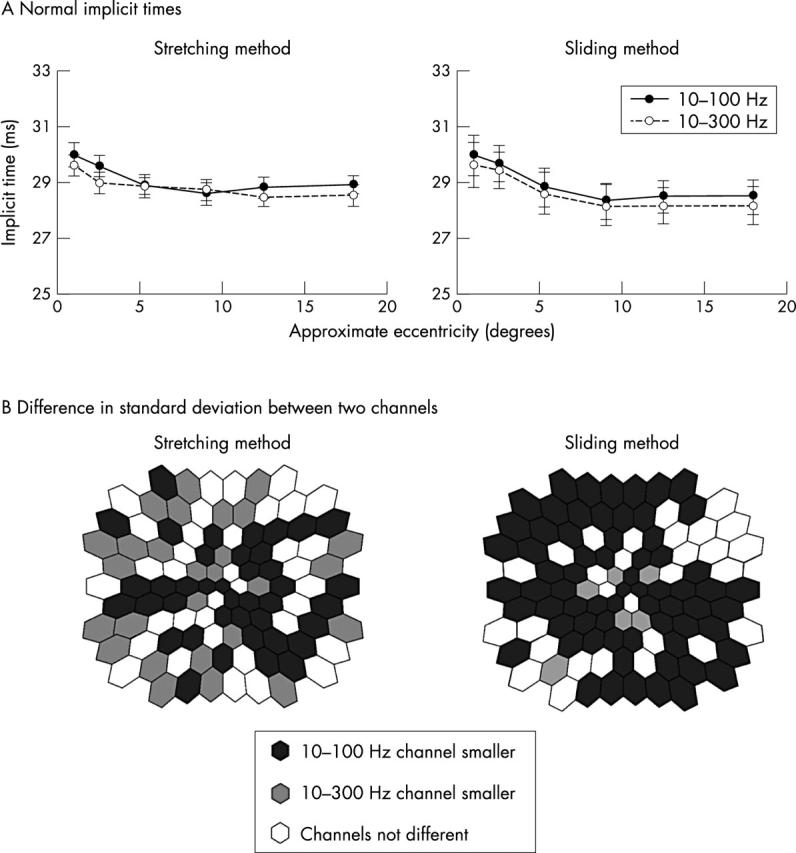
(A) Normal mean implicit times. For both stretching and sliding methods the 10–100 Hz (solid line) and 10–300 Hz (broken line) channels produce similar mean implicit times at each eccentricity, although the 10–100 Hz values are slightly longer. (B) Comparison of normal implicit time standard deviations. For both techniques, the standard deviation of the 10–300 Hz channel is larger than that in the 10–100 Hz channel. The solid hexagons indicate retinal locations where standard deviations of the 10–100 Hz responses are smaller than the 10–300 Hz channel by more than 5%, whereas grey hexagons show where those of the 10–300 Hz channel are smaller than the 10–100 Hz by more than 5%. Open hexagons indicate the difference between the two channels is less than 5%.
Amplitude
The retinal topographies of N1-P1 amplitude were also similar in the two channels (fig 5A). The relations of amplitude and eccentricity one fitted well by power functions (R2 >0.99: y = 70.60 x−0.55 for 10–100 Hz and y = 72.40 x−0.55 for 10–300 Hz). However, as was the case for implicit time, filtering affected the topography of amplitude standard deviation: the 10–100 Hz channel had smaller standard deviations in 50 locations, compared to two locations for the 10–300 Hz channel (fig 5B).
Figure 5.
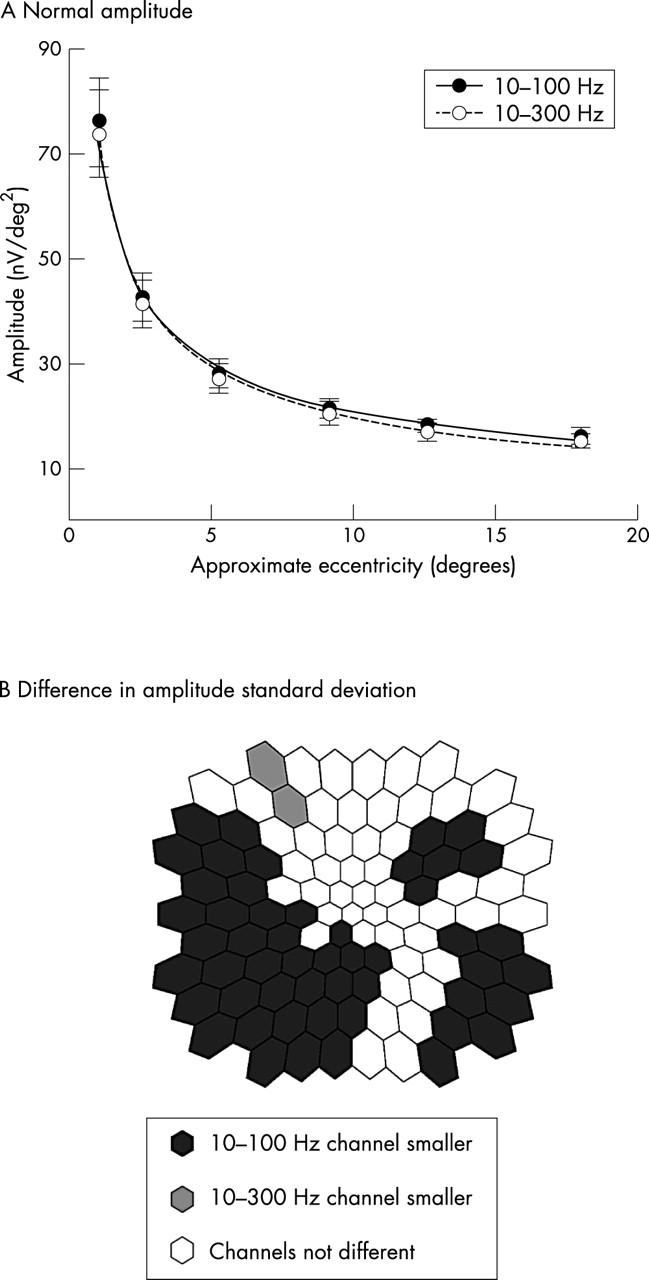
(A) Normal mfERG amplitude topographies in each channel. The two channels had nearly identical mean amplitudes at each eccentricity. The curves fit well (R2 >0.99) by power functions with the same exponent. (B) Comparison of the amplitude standard deviations (retinal views): open hexagons indicate where standard deviation of the 10–100 Hz is smaller than the 10–100 Hz channel by more than 5%. Shaded hexagons show where the standard deviations of the 10–300 Hz channel are smaller than the 10–100 Hz by more than 5%. Open hexagons indicate the difference between the two channels is less than 5%.
Consistent with our initial SNR observations, the implicit times and amplitudes of the normal mfERGs had less intersubject variability in the 10–100 Hz channel than the 10–300 Hz channel. Since the means and standard deviations of normative values define the boundaries between normal and abnormal, we can expect that the 10–100 Hz filter setting will classify a greater number of patient mfERGs as abnormal than the 10–300 Hz setting. To test this idea, we examined diabetics with and without diabetic retinopathy.
Detection of abnormalities in diabetics with NPDR
Implicit time
The 10–100 Hz filter setting detected a significantly greater number of abnormal implicit times than the 10–300 Hz setting in individual NPDR subjects (paired t test, p <0.004). Twelve of the 17 NPDR patients (70%) had a greater number of implicit time abnormalities detected with the 10–100 Hz filter setting, only one patient had more detected with the 10–300 Hz setting, and four patients had equal numbers of abnormalities detected with the two settings (table 1). The total number of abnormal implicit times detected with the 10–100 Hz filter setting was approximately 18% greater than with the 10–300 Hz channel (513 v 435). Moreover, the difference between the channels was more apparent in the diabetics with less dysfunction. For example, after excluding the four eyes with the most abnormalities, the 10–100 Hz setting detected 51.8% more abnormalities than the 10–300 Hz setting. Although the total number of implicit time abnormalities detected by the sliding method (396 for 10–100 Hz; 330 for 10–300 Hz) was less than the number detected by the stretching method, the difference between the channels remained: 12 NPDR subjects (70%) had more abnormalities in the 10–100 Hz channel (paired t test, p <0.003; table 1).
Table 1.
Number of diabetic subjects with a greater number of response abnormalities detected by each pre-amplifier filter setting and mfERG measurement
| Number of subjects | |||
| 100>300 Hz* | 100<300 Hz | ||
| NPDR (n = 17) | |||
| Implicit time | Stretching method | 12 (70.6%) | 1 (5.9%) |
| Sliding method | 12 (70.6%) | 1 (5.9%) | |
| Amplitude | Stretching method | 8 (47.1%) | 2 (11.8%) |
| No diabetic retinopathy (n = 12) | |||
| Implicit time | Stretching method | 6 (50.0%) | 0 (0.0%) |
| Sliding method | 5 (41.7%) | 0 (0.0%) | |
| Amplitude | Stretching method | 5 (41.7%) | 1 (8.3%) |
*In this column, the number of abnormal mfERGs in each eye was greater in the 10–100 Hz channel than in the 10–300 Hz channel.
We next analysed the frequency of implicit time abnormalities at each retinal location. This analysis was performed on the implicit times measured with the stretching method because this method is sensitive to localised retinal dysfunction associated with diabetes and NPDR.9–12,19 The results are plotted in figure 6 as retinal maps where, in the left and centre columns, the shading of each hexagonal patch represents the percentage of subjects with abnormal implicit times at that retinal location. As expected, for normal subjects the two channels were very similar and the maximum frequency of abnormality for each channel was <5% (fig 6A). In contrast, there were 23 retinal locations where ~50% of the NPDR subjects had abnormal implicit times with the 10–100 Hz filter setting but only 11 locations with the 10–300 Hz setting (fig 6B). The 10–100 Hz setting detected abnormalities in a greater number of retinal locations than the 10–300 Hz setting (χ2 test, p <0.005). In addition, the distribution of abnormalities differed between the two filter settings: In the 10–100 Hz channel, implicit time abnormalities were especially frequent in the inferior temporal quadrant, whereas the abnormalities were more diffusely distributed in the 10–300 Hz channel. As can be seen in the right column of figure 6B, at most retinal locations the 10–100 Hz filter setting detected implicit time abnormalities more frequently (solid hexagons) than did the 10–300 Hz setting (shaded hexagons). In the inferior temporal retinal quadrant, the 10–100 Hz channel produced both smaller implicit time standard deviations in the normal subject group (fig 4A) and more abnormalities in the NPDR subjects (fig 6B) than the 10–300 Hz setting.
Figure 6.
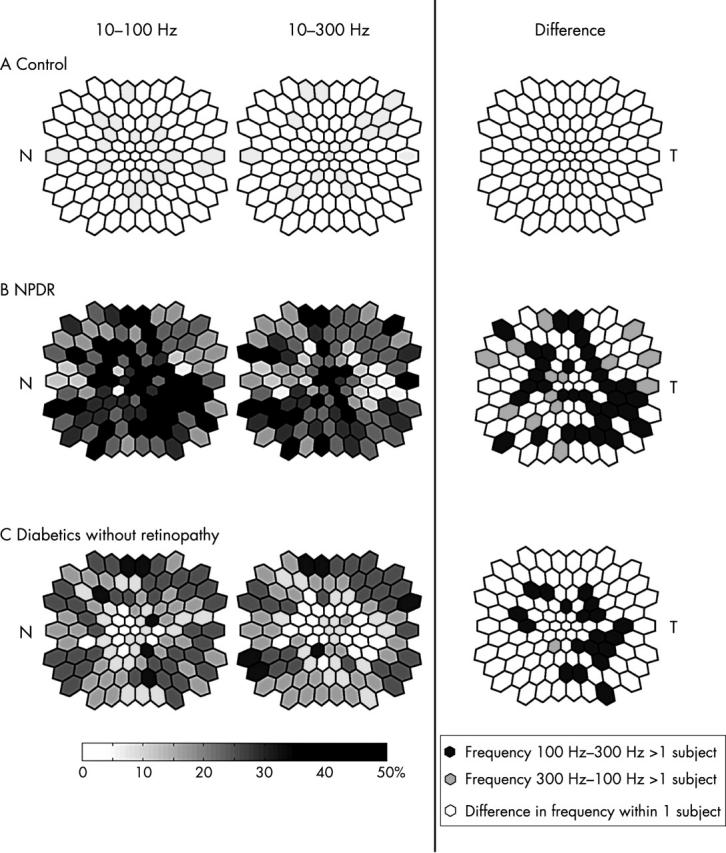
Frequency plots of abnormal implicit times (retinal views, left eye orientations): For the left and middle columns, the shading in each stimulus location represents the percentage of subjects with abnormal implicit times. The darker the shading, the greater the percentage of subjects with abnormalities. The right column indicates the difference in frequency of abnormalities between the two channels. Solid hexagons indicate retinal locations where more patients had abnormalities in the 10–100 Hz channel than the 10–300 Hz channel. Shaded hexagons show more patients with abnormalities in the 10–300 Hz channel than the 10–100 Hz channel. (A) For the normal subjects, the maximum frequency is 5% for both channels. (B) For the NPDR patients, the maximum frequency is 52.9% in the 10–100 Hz channel and 47% in the 10–300 Hz channel. Broader retinal areas in the 10–100 Hz map have high frequencies of abnormalities than in the 10–300 Hz channel, especially in the inferior temporal quadrant. (C) For the diabetics without retinopathy, in both channels the maximal frequency is 33.3%. The 10–100 Hz channel also has broader retinal areas associated with high frequency of abnormalities. N = nasal retina; T = temporal retina.
Amplitude
The two filter settings also differed in the detection of abnormal mfERG amplitudes, although the effect of filtering on amplitude was not as consistent across observers as the effect on implicit time. The 10–100 Hz setting identified a total of 339 abnormal amplitudes among the 17 NPDR subjects, while the 10–300 Hz setting identified 285 (19% fewer) abnormalities. Eight (47%) of the NPDR subjects had more amplitude abnormalities in the 10–100 Hz channel than in the 10–300 Hz channel, whereas only two had more amplitude abnormalities in the 10–300 Hz channel (table 1). The paired t test indicated that the 10–100 Hz channel identified significantly more mfERG abnormalities than the 10–300 Hz setting (p = 0.035).
Detection of abnormalities in diabetics without retinopathy
Implicit time
Despite no evidence of retinopathy, six subjects (50%) had abnormal implicit times with the 10–100 Hz filter setting, and this setting identified a greater number of abnormalities in each of them than the 10–300 Hz setting (table 1). The 10–100 Hz setting detected 214 implicit time abnormalities, significantly more than the 175 detected with 10–300 Hz (paired t test, p = 0.043). A similar pattern of results was found for the implicit times measured by the sliding method (table 1).
Figure 6C shows the percentage of the diabetic eyes without retinopathy that were identified as having abnormal implicit times at each retinal location. The highest percentage for both filter settings was 33%. The 10–100 Hz filter setting produced a higher overall frequency of implicit time abnormalities than 10–300 Hz (fig 6C, right column and table 1). For example, there were 42 retinal locations with frequencies of abnormality ⩾25% in the 10–100 Hz channel but only 31 locations in the 10–300 Hz channel (χ2 test, p <0.01). On the other hand, the distributions of abnormal implicit times in the two channels were similar, with abnormalities usually occurring at the edge of the stimulus field.
Amplitude
Abnormal mfERG amplitudes were found in 50% of the diabetics without retinopathy. Five of these subjects had more abnormalities in the 10–100 Hz channel while only one had more in the 10–300 Hz channel (table 1). Although there was a greater total number of abnormal amplitudes in the 10–100 Hz channel (131 v 96 in the 10–300 Hz channel), the difference within subjects was not significant (paired t test, p = 0.11). In both channels, amplitudes were most frequently abnormal in the inferior nasal retina approximately 18 degrees away from the fovea. This quadrant was also affected most frequently in the amplitude measures for NPDR subjects, albeit more centrally.
DISCUSSION
The purpose of our study was to examine how two commonly used amplifier filter settings, 10–100 Hz and 10–300 Hz, affect standard mfERGs recorded from normal subjects and patients. In the normal subjects, we compared SNR and intersubject variability of responses recorded with the two settings and found that the 10–100 Hz setting provided lower noise, higher SNR and lower intersubject variability. Using diabetes and diabetic retinopathy as examples, we then studied the effect of the two filter settings on detection of retinal dysfunction and found that the 10–100 Hz setting was superior for both sliding and stretching implicit time measurement techniques, regardless of whether implicit time or amplitude was used to define local functional abnormality.
The small amplitudes of standard mfERGs (in the nV range) make it essential to minimise noise contamination of recordings, especially when local responses are analysed to map retinal function. Noise can be generated by environmental sources such as the 60 Hz mains frequency, switching transients and electric motors, and also by biological sources associated with muscle tension and movement. While subject comfort (muscle relaxation) and low electrode impedance can reduce noise contamination, our results show that the choice of pre-amplifier band pass setting is also important. The results indicate that frequencies above approximately 100 Hz do not contribute significantly to the “true” standard first order mfERG signal but, rather, they are primarily noise that contributes to random variability of the response. Indeed, frequency analysis has shown that first order mfERG kernel frequencies are concentrated primarily between 19–47 Hz.7 A study by Keating, et al20 argued that addition of 15% noise significantly changed mfERG implicit time and addition of 25% noise significantly changed amplitude. This suggests that implicit time, a sensitive measure of retinal dysfunction in many eye diseases, may be more susceptible to noise contamination than response amplitude.
Our results suggest that the low noise and high SNR obtained with the 10–100 Hz setting reduce intersubject variability in normal subjects and thereby improve the ability to detect functional retinal abnormalities in patients compared to the 10–300 Hz setting. These findings are especially interesting when one considers the conservative nature of our study. The sliding and stretching methods used to measure the local mfERG implicit times and amplitudes utilise waveform templates. Because of this, these methods are much less influenced by noise contamination than measurements of peak implicit time and peak to peak amplitude that depend only on one or two points on the response waveform. Another consideration is the fact that diabetes is a relatively conservative disease example because previous conventional ERG studies reported preferential losses of high frequency response components in diabetes21–25 and the standard mfERG technique does not elicit those frequencies effectively, even in normal eyes.
In the diabetics with early NPDR, implicit time was most frequently abnormal in the inferior temporal quadrant. This finding might be related to ocular blood flow dynamics because the inferior temporal retina, which is relatively insensitive to vascular dilation, may be more susceptible to hypoxia than other areas. Confocal scanning laser Doppler flowmetry in young healthy people has shown that the inferior temporal quadrant of the peripapillary retina is less responsive to vasodilation and more responsive to vasoconstriction.26 Diabetic retinopathy is a disease of small retinal vessels, and early characteristic changes in the retinal vasculature of diabetics are pericyte apoptosis and basement membrane thickening, resulting in acellular capillaries.27–31 In diabetics before the development of retinopathy, and in those with early diabetic retinopathy, retinal capillaries have the ability to increase ocular blood flow in order to compensate for the reduced oxygen tension by autoregulation mechanisms.32,33 Our results confirm earlier studies showing that measurement of implicit time is more sensitive to diabetic retinal dysfunction than measurement of amplitude.9–11 This finding is independent of the pre-amplifier filter setting. Our results also indicate that the stretching method of implicit time measurement is more sensitive to diabetic retinal dysfunction than the sliding method, confirming our earlier report.19
In summary, the two band pass filter settings most frequently used to record the standard mfERG differ significantly in their noise content, intersubject variability, and the ability to detect retinal function. These differences have important implications for clinical application of the mfERG. Our results suggest that, although high frequency response components may be valuable when non-standard mfERG paradigms are used or higher order kernels are studied,7,16,34–38 the standard first order mfERG should be recorded using 10–100 Hz rather than 10–300 Hz band pass filtering.
Acknowledgments
This study was supported by NEI Grant No EY-02271 to AJA.
REFERENCES
- 1.Sutter EE, Tran D. The field topography of ERG components in man—I. The photopic luminance response. Vis Res 1992;32:433–46. [DOI] [PubMed] [Google Scholar]
- 2.Kondo M, Miyake Y, Horiguchi M, et al. Clinical evaluation of multifocal electroretinogram. Invest Ophthalmol Vis Sci 1995;36:2146–50. [PubMed] [Google Scholar]
- 3.Bearse MA, Sutter EE. Imaging localized retinal dysfunction with the multifocal electroretinogram. J Opt Soc Am A 1996;13:634–40. [DOI] [PubMed] [Google Scholar]
- 4.Hood DC. Assessing retinal function with the multifocal technique. Prog Retin Eye Res 2000;19:607–46. [DOI] [PubMed] [Google Scholar]
- 5.Kretschmann U, Bock M, Gockeln R, et al. Clinical applications of multifocal electroretinography. Doc Ophthalmol 2000;100:99–113. [DOI] [PubMed] [Google Scholar]
- 6.Marmor MF, Hood DC, Keating D, et al. Guidelines for basic multifocal electroretinography (mfERG). Doc Ophthalmol 2003;106:105–15. [DOI] [PubMed] [Google Scholar]
- 7.Bock M, Gerth C, Lorenz B. Impact of notch filter use on waveforms of first- and second-order-kernel responses from multifocal ERGs. Doc Ophthalmol 2000;101:195–210. [DOI] [PubMed] [Google Scholar]
- 8.Hood DC, Li J. A technique for measureing individual multifocal ERG records. In: Trends in optics and photonics. Washington, DC: Optical Society of America, 1997:280–3.
- 9.Fortune B, Schneck ME, Adams AJ. Multifocal electroretinogram delays reveal local retinal dysfunction in early diabetic retinopathy. Invest Ophthalmol Vis Sci 1999;40:2638–51. [PubMed] [Google Scholar]
- 10.Greenstein VC, Holopigian K, Hood DC, et al. The nature and extent of retinal dysfunction associated with diabetic macular edema. Invest Ophthalmol Vis Sci 2000;41:3643–54. [PubMed] [Google Scholar]
- 11.Greenstein VC, Chen H, Hood DC, et al. Retinal function in diabetic macular edema after focal laser photocoagulation. Invest Ophthalmol Vis Sci 2000;41:3655–64. [PubMed] [Google Scholar]
- 12.Hood DC, Holopigian K, Greenstein V, et al. Assessment of local retinal function in patients with retinitis pigmentosa using the multi-focal ERG technique. Vis Res 1998;38:163–79. [DOI] [PubMed] [Google Scholar]
- 13.Holopigian K, Seiple W, Greenstein VC, et al. Local cone and rod system function in patients with retinitis pigmentosa. Invest Ophthalmol Vis Sci 2001;42:779–88. [PubMed] [Google Scholar]
- 14.Vajaranant TS, Szlyk JP, Fishman GA, et al. Detection using the multifocal electroretinogram of mosaic retinal dysfunction in carriers of X-linked retinitis pigmentosa. Ophthalmology 2002;109:560–8. [DOI] [PubMed] [Google Scholar]
- 15.Holopigian K, Seiple W, Greenstein VC, et al. Local cone and rod system function in progressive cone dystrophy. Invest Ophthalmol Vis Sci 2002;43:2364–73. [PubMed] [Google Scholar]
- 16.Palmowski AM, Sutter EE, Bearse MA, et al. Mapping of retinal function in diabetic retinopathy using the multifocal electroretinogram. Invest Ophthalmol Vis Sci 1997;38:2586–96. [PubMed] [Google Scholar]
- 17.ETDRSR Group, Fundus photographic risk factors for progression of diabetic retinopathy. ETDRS report number 12. Ophthalmology 1991;98:823–33. [PubMed] [Google Scholar]
- 18.Zhang X, Hood DC, Chen CS, et al. A signal-to-noise analysis of multifocal VEP responses: an objective definition for poor records. Doc Ophthalmol 2002;104:287–302. [DOI] [PubMed] [Google Scholar]
- 19.Han Y, Bearse MA, Schneck ME, et al. Comparison of multifocal electroretinogram(mfERG) measurement techniques to detect diabetic retinopathy [abstract]. J Vision 2002;2:115a. [Google Scholar]
- 20.Keating D, Parks S, Evans A. Technical aspects of multifocal ERG recording. Doc Ophthalmol 2000;100:77–98. [DOI] [PubMed] [Google Scholar]
- 21.Bresnick GH, Palta M. Oscillatory potential amplitudes. Relation to severity of diabetic retinopathy. Arch Ophthalmol 1987;105:929–33. [DOI] [PubMed] [Google Scholar]
- 22.Juen S, Kieselbach GF. Electrophysiological changes in juvenile diabetics without retinopathy. Arch Ophthalmol 1990;108:372–5. [DOI] [PubMed] [Google Scholar]
- 23.Yoshida A, Kojima M, Ogasawara H, et al. Oscillatory potentials and permeability of the blood-retinal barrier in noninsulin-dependent diabetic patients without retinopathy. Ophthalmology 1991;8:1266–71. [DOI] [PubMed] [Google Scholar]
- 24.Lovasik JV, Kergoat H. Electroretinographic results and ocular vascular perfusion in type 1 diabetes. Invest Ophthalmol Vis Sci 1993;34:1731–43. [PubMed] [Google Scholar]
- 25.Tzekov R, Arden GB. The electroretinogram in diabetic retinopathy. Surv Ophthalmol 1999;44:53–60. [DOI] [PubMed] [Google Scholar]
- 26.Chung HS, Harris A, Halter PJ, et al. Regional differences in retinal vascular reactivity. Invest Ophthalmol Vis Sci 1999;40:2448–53. [PubMed] [Google Scholar]
- 27.Chakrabarti S, Cukiernik M, Hileeto D, et al. Role of vasoactive factors in the pathogenesis of early changes in diabetic retinopathy. Diabetes Metab Res Rev 2000;16:393–407. [DOI] [PubMed] [Google Scholar]
- 28.Cao J, McLeod S, Merges CA, et al. Choriocapillaris degeneration and related pathologic changes in human diabetic eyes. Arch Ophthalmol 1998;116:589–97. [DOI] [PubMed] [Google Scholar]
- 29.Linsenmeier RA, Braun RD, McRipley MA, et al. Retinal hypoxia in long-term diabetic cats. Invest Ophthalmol Vis Sci 1998;39:1647–57. [PubMed] [Google Scholar]
- 30.Spranger J, Pfeiffer AF. New concepts in pathogenesis and treatment of diabetic retinopathy. Exp Clin Endocrinol Diabetes 2001;109:S438–S450. [DOI] [PubMed] [Google Scholar]
- 31.Cai J, Boulton M. The pathogenesis of diabetic retinopathy: old concepts and new questions. Eye 2002;16:242–60. [DOI] [PubMed] [Google Scholar]
- 32.Schmetterer L, Wolzt M. Ocular blood flow and associated functional deviations in diabetic retinopathy. Diabetologia 1999;42:387–405. [DOI] [PubMed] [Google Scholar]
- 33.Ciulla TA, Harris A, Latkany P, et al. Ocular perfusion abnormalities in diabetes. Acta Ophthalmol Scand 2002;80:468–77. [DOI] [PubMed] [Google Scholar]
- 34.Wu S, Sutter EE. A topographic study of oscillatory potentials in man. Vis Neurosci 1995;12:1013–25. [DOI] [PubMed] [Google Scholar]
- 35.Bearse MA, Shimada Y, Sutter EE. Distribution of oscillatory components in the central retina. Doc Ophthalmol 2000;100:185–205. [DOI] [PubMed] [Google Scholar]
- 36.Kurtenbach A, Langrova H, Zrenner E. Multifocal oscillatory potentials in type 1 diabetes without retinopathy. Invest Ophthalmol Vis Sci 2000;41:3234–41. [PubMed] [Google Scholar]
- 37.Bearse MA, Han Y, Schneck ME, et al. Retinal function in normal and diabetic eyes mapped with slow flash multifocal electroretinogram. Invest Ophthalmol Vis Sci 2004;45:296–304. [DOI] [PubMed] [Google Scholar]
- 38.Shimada Y, Li Y, Bearse MA, et al. Assessment of early retinal changes in diabetes using a new multifocal ERG protocol. Br J Ophthalmol 2001;85:414–19. [DOI] [PMC free article] [PubMed] [Google Scholar]


