

Selection of corneal grafts in eye banks is mainly based on end-of-storage endothelial assessment, which consists of endothelial cell density (ECD) measurement and, to some extent, cell morphometry. Below a certain ECD threshold, generally 2000 cells/mm2, the cornea is deemed unfit for penetrating keratoplasty. Precise ECD measurement at the end of storage is thus a key issue for eye banks, and also for patients, because it influences the long term survival of the graft.1–3
For long term storage in organ culture, the most common method in Europe,4 endothelial observation is possible only by transmitted light microscopy. The endothelial cells are exposed to 0.9% sodium chloride or sometimes to 1.8% sucrose, which induce a small degree of osmotic cell shrinkage and dilatation of the intercellular spaces thus making individual cells visible. The cells can then be counted manually, through a calibrated reticule or from a photograph; or using an advanced image analysis system.5–7 Whichever method of count is used, precision depends primarily on good visualisation of the cell borders. It has long since been shown that, even under experimental conditions of perfect cell membrane visualisation using alizarin red, maximum precision ranges from +5% to −5%.8
Two commercial media are authorised by the Agence Française de Sécurité Sanitaire des Produits de Santé. They are very similar in composition, both being based on HEPES-buffered Iscove’s Modified Dulbecco’s medium containing sodium bicarbonate and 2% fetal bovine serum, with the same pH of 7.25 but the osmolality of Inosol (Bausch & Lomb, Chauvin-Opsia, Labège, France) is only 305 mosmol/kg (range 295–315) compared with 320 mosmol/kg (range 300–340) for CorneaPrep/Max (Eurobio, Les Ulis, France). One has nevertheless acquired the reputation of allowing better visualisation of endothelial cells and thus facilitating ECD measurement. We therefore compared the quality of endothelial cells visualisation in these two commercial media, using an original image analyser specially designed for the assessment of corneal endothelium by light microscopy.
Methods
We conducted a randomised prospective study with masked analysis of the results. Donors with history of anterior segment surgery were excluded. After procurement of a pair of corneoscleral discs, one of the corneas (group A) was immersed in Inosol and the other (group B) in Corneaprep/Max for organ culture at +31°C. The media were allocated to the right or left cornea according to a randomisation list. Two consecutive endothelial examinations were performed in a similar fashion. The initial examination was done between the first and fifth days after procurement, and the final one two days before cornea delivery.
After the endothelial side was incubated for four minutes in 0.9% sodium chloride (Aguettant, Lyon, France), it was observed under a direct light microscope (Laborlux, Leica, Wetzlard, Germany) with ×10 original magnification. Ten wide-field (1250×950 µm), non-overlapping images of the mosaic, contained within the central 8 mm, were captured by a black and white mono CCD camera. The evaluation was performed by an experienced technician masked to storage medium, using a Sambacornée analyser (Samba Technologies, Meylan, France), the commercial version of the “tri-image” analyser prototype developed by our team and described previously.9,10 A fully automatic and a touch up analysis (with user intervention to identify cell boundaries missed or delineated incorrectly in automatic mode) of exactly the same zones of the same three images, were performed on receipt (initial examination) and on delivery (final examination) (Fig 1).
Figure 1.
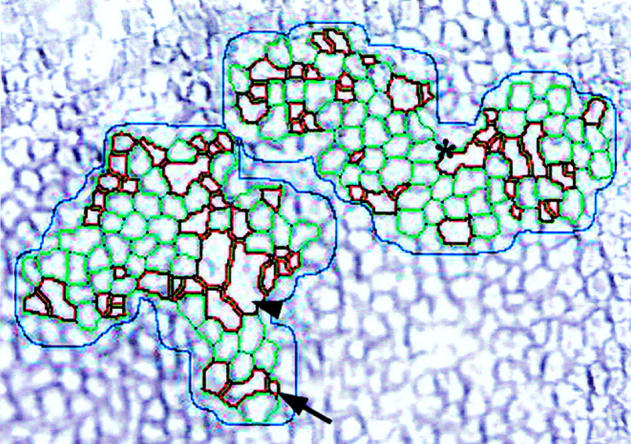
Illustration of the image analysis tools specifically developed for easier touching up of cell borders. Areas outlined in red were either <150 µm2 (black arrow), often artefacts like nucleus, debris, or >1500 µm2 (arrowhead) or with width greater than twice the length (asterisk), the later two indicating poorly separated cells. These cells, assumed to be poorly recognised, would suggest to the technician the need for contour correction or, where appropriate, validation. To calculate the endothelial cell density in automatic mode, only the green reliably recognised cells were taken into account.
The three images selected by the analyser were qualitatively assessed on a scale of three (Table 1) by three independent observers masked to storage medium. Discordant cases were reviewed.
Table 1.
Qualitative grading of the endothelial images
| Image quality | Score | Criteria |
| Good | 2 | Excellent view of cell borders; low background noise; cells visible on over 2/3 of image area |
| Average | 1 | Good view of cell borders; moderate background noise; cells visible on 1/3 to 2/3 of image area |
| Poor | 0 | Poor view of cell borders; high background noise; cells visible on less than 1/3 of image area |
For the analyses in tri-image mode, overall quality was graded “good” if the three images obtained scores of 2/2/2 or 2/2/1, “average” if the scores were 2/1/1, 2/1/0, or 1/1/1, and “poor” if the scores were 1/1/0, 1/0/0, or 0/0/0.
The normality of the data distribution was tested using both the Lilliefors variant of the Kolmogorov-Smirnov test and Shapiro-Wilk normality test, with the cut off for non-normality set at p<0.05. The quantitative variables (number of cells “reliably recognised”, ECD, touch up duration) were compared using a paired t test in the case of normal distribution, and otherwise by a non-parametric test (Wilcoxon). The image quality scores were compared by the χ2 test in a 3×2 grid. p<0.01 was deemed significant.
Results
As the study design required inclusion of paired corneas having had two successive analyses, of a series of 77 pairs of corneas procured consecutively, 30 pairs of 13 women (43%) and 17 men (57%) with a mean age of 69 years (range 30–92) were included in this study. Mean time between death and cornea procurement was 10 hours (range 0, for heart beating donors-24).
At the initial examination (Table 2), performed on an average three days (range 1–5) after procurement, image quality was comparable between the two groups. Whichever analysis mode (automatic or touch up) was used, all parameters were comparable between the two media except for the touch up duration which was slightly shorter, on an average by 1 minute (59 seconds, 95% confidence interval, CI (19–102)), for the corneas in group A. Compared to the automatic analysis, the touch up analysis only slightly decreased the initial ECD value in group A, by 154 cells/mm2 (95% CI 36 to 79), or −4.7% (p<0.001) and insignificantly in group B, by 101 cells/mm2 (95% CI −39 to 240), or −3.1% (p = 0.150).
Table 2.
Initial examination of paired corneas stored in medium A and B
| Group A (n = 30) | Group B (n = 30) | p Value | |
| Image quality (good/average/poor,(%)) | 56/27/17 | 43/30/27 | 0.526 |
| Cells well recognised per se, “automatic” mode (n) | 298 (68) 147–417/304 | 275 (89) 113–417/284 | 0.058 |
| ECD, “automatic” mode (cells/mm2) | 3267 (197) 2779–3672/3250 | 3248 (305) 2445–3753/3249 | 0.770 |
| Cells counted, “touch up” mode (n) | 515 (126) 278–973/521 | 540 (259) 314–1777/519 | 0.579 |
| ECD, “touch up” mode (cells/mm2) | 3113 (341) 2343–4008/3107 | 3147 (391) 2461–3893/3190 | 0.533 |
| Coefficient of variation of cell area, “touch up” mode (%) | 29.1 (6.1) 21.2–47.2/28.1 | 29.1 (4.3) 21.7–39.6/29.1 | 0.986 |
| Hexagonality, “touch up” mode (%) | 53.8 (9.6) 32.0–75.0/53.2 | 51.6 (9.0) 34.8–69.6/51.9 | 0.212 |
| Touch up duration (seconds) | 345 (131) 129–560/334 | 406 (166) 171–721/382 | 0.006 |
Results were expressed as mean (standard deviation), minimum–maximum/median. The automatic analysis mode provides reliable results compared to the more time consuming touch up one. This allowed, in our eye bank, to decide in a few moments whether to continue with organ culture.
Between the initial and final examination (Table 3), performed on an average 13 days (range 8–22) after procurement, image quality deteriorated markedly in group A (p<0.001) but remained stable in group B (p = 0.357). At the final examination, group A displayed no “good” images against nearly one in two for group B. Automatic recognition of the cells was thus made much easier in group B, with on an average 238 (46) against only 159 (47) cells in group A (p<0.001). For group B, the need for touch up was reduced, with a mean time gain of about 3 minutes (163 seconds, 95% CI 116 to 211), p<0.001) and allowing a higher number of cells to be taken into account (456 (82%) against 357 (72%) for group A, p<0.001). In both groups, the touch up analysis reduced considerably the final ECD value compared to the automatic analysis, by 435 cells/mm2 (95% CI 317 to 552), or −13.8% (p<0.001) for group A and by 313 cells/mm2 (95% CI 239 to 386), or −10.3%, (p<0.001) for group B.
Table 3.
Final examination of paired corneas stored in medium A and B
| Group A (n = 30) | Group B (n = 30) | p Value | |
| Image quality (good/average/poor, (%)) | 0/23/77 | 43/43/14 | <0.001 |
| Cells well recognised per se, “automatic” mode (n) | 159 (47) 75–248/159 | 238 (46) 151–324/238 | <0.001 |
| ECD, “automatic” mode (cells/mm2) | 3143 (159) 2829–3543/3105 | 3029 (188) 2650–3451/3039 | 0.011 |
| Cells counted, “touch up” mode (n) | 357 (72) 209–559/339 | 456 (82) 292–608/446 | <0.001 |
| ECD, “touch up” mode (cells/mm2) | 2708 (320) 2277–3430/2704 | 2716 (284) 2259–3579/2686 | 0.934 |
| Overall cell loss, “touch up” mode (%) | 12.6 (9.3) 7.2–34.1/12.2 | 13.1 (8.0) 1.3–27.8/15.6 | 0.79 |
| Coefficient of variation of cell area, “touch up” mode (%) | 28.4 (3.5) 23.7–40.4/27.8 | 27.2 (3.4) 21.7–34.8/27.3 | 0.098 |
| Hexagonality, “touch up” mode (%) | 50.7 (9.2) 32.5–72.8/49.7 | 53.0 (6.6) 36.2–66.6/52.6 | 0.201 |
| Touch up duration (seconds) | 551 (134) 361–853/521 | 388 (120) 226–653/362 | <0.001 |
Results were expressed as mean (standard deviation), minimum–maximum/median. The automatic analysis was less relevant at delivery than at receipt (see Table 1), consequently, a touch up analysis should be recommended.
The two media did not differ in terms of preserving endothelial viability: ECD, percentage cell loss, and morphometry (all determined in touch up mode) were comparable between the two media.
Comment
Our randomised, prospective parallel group study, performed masked with an objective image analysis tool, demonstrates that visualisation of the endothelial mosaic is better after organ culture in CorneaPrep/Max medium than in Inosol. The former facilitates ECD measurement at delivery, the main parameter of corneal quality control. Our study shows that: (1) prolonged storage in CorneaPrep/Max caused no deterioration in image quality, unlike that with Inosol. Better visualisation of cell borders at delivery shortened touch up durations considerably, on average by three minutes per computerised analysis. This point should be particularly relevant for the eye banks which perform endothelial assessment only once, generally after 10–15 days of organ culture,4,11 (2) At the end of organ culture, the corneas stored in CorneaPrep/Max responded better to osmotic dilation of the intracellular spaces than those stored in Inosol. There was no such discrepancy at the start of storage. We may assume that this difference in behaviour is due to the increased osmolality of CorneaPrep/Max, which is 15 mOsm/l greater than that of Inosol. During organ culture, the very gradual change of ionic content between the cells and/or of the intercellular junctions may increase water egress from the cells and thus promote dilation of the intercellular spaces in the presence of 0.9% sodium chloride. However, it is likely that over three days these changes did not have time to occur, which would explain the lack of initial differences in image quality. Further histological study could confirm the nature of these changes in the cells and/or their junctions but whatever their nature, they do not affect viability.
In 2001, the twenty one French eye banks stored on average 292 corneas (range 32–846).11 Because of their small size, the eye banks naturally prefer commercial organ culture media to their own preparations. The two media authorised for use in France are very similar in composition; neither is superior in terms of preserving endothelial viability, as our study confirms. Until now, medium selection was dictated essentially by economic arguments. Our study provides an additional criterion, namely higher quality of mosaic visualisation to justify the choice of medium. It should be possible to extrapolate the beneficial impact of good mosaic visualisation to manual counting, the method still used by most French and European eye banks.
Improving endothelial quality control has become a priority in our eye bank and research laboratory.7,10 Work is under way to determine the ideal composition of organ culture medium that allows the best endothelial visualisation without inducing additional cell loss.
Presented in part at the 15th annual meeting of the European Eye Bank Association held in Brussels on 17–19 January 2003.
References
- 1.Nishimura JK, Hodge DO, Bourne WM. Initial endothelial cell density and chronic endothelial cell loss rate in corneal transplants with late endothelial failure. Ophthalmology 1999;106:1962–5. [DOI] [PubMed] [Google Scholar]
- 2.Bourne WM. Cellular changes in transplanted human corneas. Cornea 2001;20:560–9. [DOI] [PubMed] [Google Scholar]
- 3.Thuret G, Chiquet C, Bernal F, et al. Prospective randomized clinical and endothelial evaluation of two storage times for corneal donor tissue in organ culture at 31 degrees centigrade. Arch Ophthalmol 2003;121:442–50. [DOI] [PubMed] [Google Scholar]
- 4.EEBA. European Eye Bank Association Directory. Eleventh ed., Amsterdam, 2003.
- 5.Barisani-Asenbauer T, Baumgartner I, Grabner G, et al. Automated digital image analysis of organ culture preserved donor corneas. Ophthalmic Res 1993;25:94–9. [DOI] [PubMed] [Google Scholar]
- 6.Reinhard T, Spelsberg H, Holzwarth D, et al. Wissensbasierte Bildanalyse des Endothels von Hornhauttransplantaten. Klin Monatsbl Augenheilkd 1999;214:407–11. [DOI] [PubMed] [Google Scholar]
- 7.Thuret G, Manissolle C, Acquart S, et al. Is manual counting of corneal endothelial cell density in eyebanks still acceptable? The French experience. Br J Opthalmol 2004. (in press). [DOI] [PMC free article] [PubMed]
- 8.Sperling S, Gundersen HJ. The precision of unbiased estimates of numerical density of endothelial cells in donor cornea. Acta Ophthalmol (Copenh) 1978;56:793–802. [DOI] [PubMed] [Google Scholar]
- 9.Gain P, Thuret G, Chiquet C, et al. Automated analyser of organ cultured corneal endothelial mosaic. J Fr Ophtalmol 2002;25:462–72. [PubMed] [Google Scholar]
- 10.Gain P, Thuret G, Kodjikian L, et al. Automated tri-image analysis of stored corneal endothelium. Br J Ophthalmol 2002;86:801–8. [DOI] [PMC free article] [PubMed] [Google Scholar]
- 11.Delbosc B. French directory of corneal storage centres. Ninth ed. Besançon, 2001.