Abstract
Aims: To quantify retinal vascular change during and after hyperbaric oxygenation (HO) for 6×5 weekly 90 minute treatments.
Methods: Fundus photographs were taken before, during, and after HO at 2.5 atmospheres absolute pressure (ATA) on days 1, 2, 3, 10, 20, 29, and 30 of treatment on three patients using a specially developed hand held ophthalmoscope with a digital colour camera. Blood vessel diameter was estimated on red free retinal images. The mean of three measurements of arterioles and venoles close to the optic disc was calculated. Consistency and repeatability of the method was verified by estimating the diameter of the vessels by three measurements in each of seven images taken within 70 seconds on the same person. Analysis of variance with Bonferroni correction for multiple comparisons was conducted to ascertain whether significant intergroup differences existed.
Results: Breathing 100% oxygen at 2.5 ATA constricts retinal arterioles by 9.6% (standard deviation 0.3%) and venoles by 20.6% (SD 0.3%) of their size in air at ambient pressure. Constriction escalates during treatment. Ten minutes after the HO, arterioles dilate to 94.5% (SD 0.3%) and venoles to 89.0% (SD 0.3%) of their primary size. This pattern is the same for each day of measurement. Heart frequency falls continually during HO. Systolic, diastolic, and mean arterial pressures stay constant.
Conclusion: Exposure to hyperbaric oxygen causes constriction of the retinal vessels. It is found that this constriction is constant through the series of treatments. This suggests that oxygen or products thereof are responsible for the vascular changes during and after hyperbaric oxygenation probably through autoregulation of the retinal vessels.
Keywords: hyperbaric oxygenation, vascular diameter, retina, computer analysis
The retina provides the opportunity for non-invasive observation of human microcirculation in vivo. The study of retinal circulation during exposure to hyperbaric oxygen (HO) treatment is important for further understanding of normal physiological changes and also of a number of pathological conditions, both locally in the eye and extending to brain metabolism and brain oedema.
Short term HO has a large influence on the cardiovascular system. Systolic blood pressure increases and diastolic pressure falls. The mean pressure is constant. Peripheral resistance increases by about 30%. Heart frequency and cardiac output fall by approximately 20%. 1, 2 Retinal blood vessels constrict when the concentration of inspired oxygen rises. 3, 4 After breathing oxygen at 2.36 atmospheres absolute pressure (ATA) for 5 minutes, arterioles constricted by 22.6% 5 and by 42.3% at 2.0 ATA, 3, 6 and venoles constricted by 26.9% at 2.36 ATA 5 and by 30% at 2.0 ATA. 3 Constriction is even greater with higher oxygen pressure: when oxygen is inspired at 3.7 ATA for 5 minutes, arterioles constricted by 25.9% and venoles by 32.4%. 5 The retinal venoles develop the same colour as the retinal arterioles, indicating a significant increase in retinal venous blood oxygen saturation: oxygen breathing at 2.36 ATA for 5 minutes increased venous oxygen saturation from 58% to 94% and retinal mean circulation time (t) increased by 53% from 4.5 to 6.9 seconds. 5 If we consider the fact that main circulation time is proportional to the ratio of retinal blood volume to blood flow rate (t = volume/flow), the calculated blood flow decreased to approximately 30% of the control value after 5 minutes on oxygen at 2.36 ATA. 5
Similar results were observed when cerebral blood flow (CBF) was measured: after 30 minutes of O2 exposure at 3.0 and 4.0 ATA, CBF decreased by 26–39% and 37–43%, respectively. 7
Likewise after 10 minutes exposure to 2.0, 3.5, and 5.0 ATA, CBF decreased 20–25%. 8 It is well known that decreased CBF is correlated with seizures. 8– 10 If we assume that the retinal blood flow changes are similar to changes in CBF, then it might be possible to extrapolate the changes of retinal vessel diameter to predict seizures.
The widespread use of hyperbaric oxygenation raises the issue of describing the long term effects of high pressure oxygen on retinal circulation. The aim of the present study is to examine the effect of oxygen at 2.5 ATA on retinal vessels diameter during 90 minutes treatment and 10 minutes after the treatment during 30 days of HO.
METHODS
The study followed changes of the retinal blood vessel diameter for 6 weeks during daily treatments (Monday to Friday) in a pressure chamber at 2.5 ATA. Each session lasted 90 minutes, where 100% oxygen was inhaled through a Divex facemask. During the treatment electrocardiogram, blood pressure with non-invasive blood pressure measurement and arterial oxygen saturation (SaO2) were monitored. For safety reasons the person taking the pictures inhaled 50%/50% Nitrox (mixture of 50% of air and 50% of oxygen).
Subjects
The current study included one female (VH: 53 years old with perineal necrosis after radio therapy for cancer vaginae) and two male patients (EJ and ER: 54 and 66 years old with osteoradionecrosis after radio therapy for cancer palati duri). None of the subjects used glasses for distant vision. Exclusion criterions were diabetes mellitus, hypertension, lung diseases, and pregnancy.
Photographs
Fundus photographs were taken with a specially developed hand held video ophthalmoscope 11 connected by a C-mount adapter (Coolpix MDC lens 0.82–0.29×Nikon) to a digital colour camera (Nikon Coolpix E950) (fig 1 ). The camera and the ophthalmoscope were tested to 6.0 ATA. The light source was placed outside the chamber and a fibre light guide mounted through the wall of the chamber. This method of taking fundus photographs is original; it is easy to use and pictures can be taken on acute treated, unconscious patients. The equipment is easily installed in the pressure chamber (fig 1 ). The system was tested as described previously 12 with resolution of 8 μm on a retinal target. One picture element (pixel) corresponds to 3 μm on the retina. The limited field of width of the ophthalmoscope of about 5° required centring the lens on the vessels of interest. For convenience, straight first order vessels on the nasal side of the papilla were selected.
Figure 1.
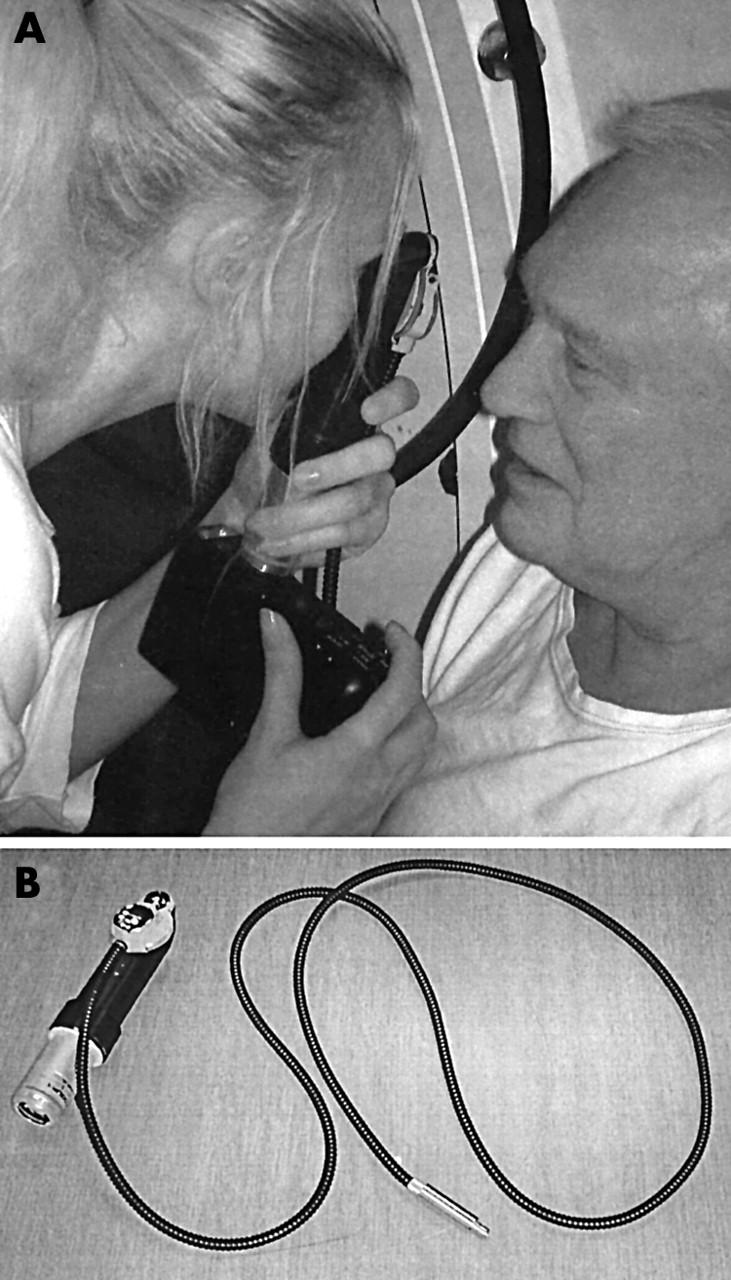
(A) Hand held ophthalmoscope with digital camera in use. (B) Ophthalmoscope with fibre optic light guide and C-mount adapter detached from digital camera. The ophthalmoscope has a field of view about 5°, with resolution of 8 μm.
Fundus photographs were taken on days 1, 2, 3, 10, 20, 29, and 30 of treatment. The pupil was dilated with 0.5% tropicamide (Mydriacyl 0.5%) 20 minutes before HO. The first photograph was taken before the treatment (T00). Others were taken after 10 (T10), 20 (T20), 70 (T70), and 80 minutes (T80) of the start of the treatment. The last one was taken 10 minutes after (U10) the end of HO. At each time point three images were recorded and the best image depicting both an arteriole and venole was selected for measurement.
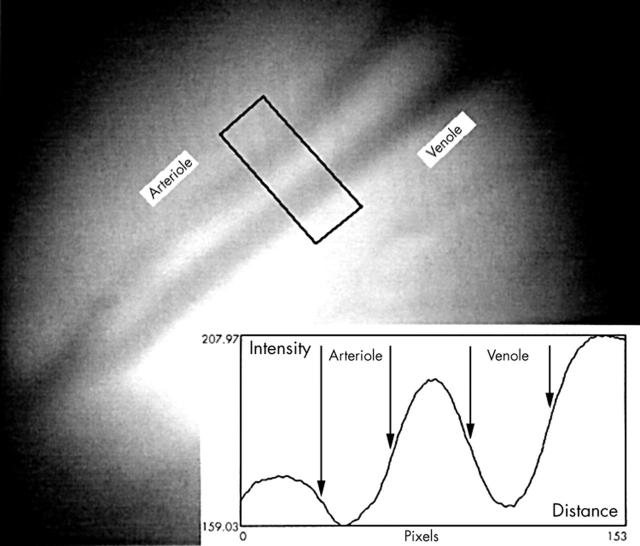
Blood vessels diameter was estimated on retinal colour images by densitometry with a computer program (PC Scion Image, www.scioncorp.com) using the green image channel. A measuring window covering the vessels was used to construct a line plot of the cross sectional intensity profile of each vessel changing from the bright surroundings to a dark minimum inside the vessels (fig 2 ). The border of a vessel 13 was defined as the location of 50% intensity change from the bright surroundings to the minimal intensity inside the vessel (fig 2 ). Vessel diameter was the distance on the x axis between two border points measured in pixels. Three measurements (about 3–6 days between the measurements) of both arterioles and venoles were used for statistic analysis. Consistency was secured by measuring the distance of the measuring window from the papilla. The repeatability of the method was evaluated by estimating diameter of the vessels in seven retinal images taken within 70 seconds on the same person.
Figure 2.
Estimation of the retinal vessel diameter on red free retinal images by computerised densitometry: a measuring window covering the vessels is used to construct a cross sectional intensity profile. The borders of the vessels denoted by arrows are defined as 50% intensity changes from the bright surroundings to the dark minimum in the vessel centre. Diameter is the distance on the x axis between two border points. Each pixel corresponds to approximately 3 μm on the retina. The border of the papilla is located in the lower left corner.
Statistics
The diameter of each vessel was normalised by its control value. Analysis of variance with Bonferroni correction for multiple comparisons (SPSS v 10.0, SPSS Inc, Chicago, IL, USA) was conducted on the data to ascertain whether significant intergroup differences existed (p<0.05 used as limit of significance). Components of variance were vessel type (arteriole and venole), patients (VH, EJ, and ER), day of treatment (D1, D2, D3, D10, D20, D29, and D30), and time (T00, T10, T20, T70, T80, and U10). The results are presented as mean (standard error) of the estimates.
RESULTS
There was no significant difference of the measurements of vascular diameter between the seven control images: between and within images error mean squares were 0.43 and 0.41, respectively (p = 0.41). Thus, the precision of the estimates of vessel diameter is less than 1 pixel.
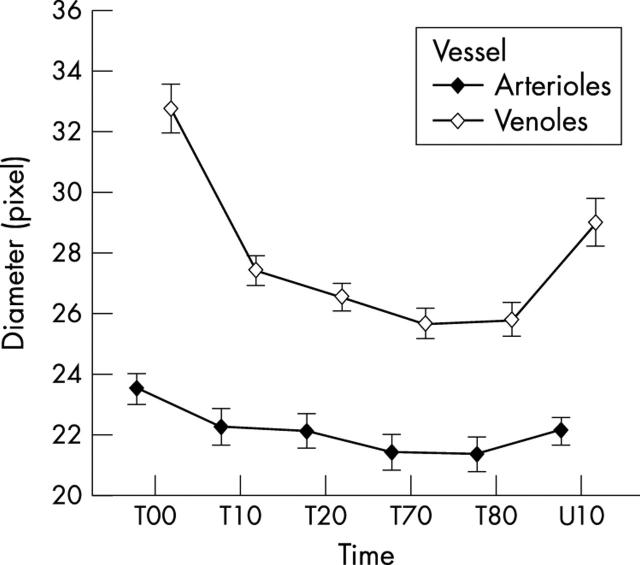
The variance analysis of the relative vessel diameters is presented in table 1 . Breathing of 100% O2 at 2.5 ATA initiated vasoconstriction of the retinal vessels that escalated during the first 20 minutes of HO treatment (fig 3 ). The largest source of variance was the vessel type: after 90 minutes of HO, arterioles constricted 9.6% (0.3%) and venoles 20.6% (0.3%) from the size on air at ambient pressure. The response of the venoles was significantly larger than the arteriolar response (p<0.001). Ten minutes after the end of treatment arterioles had dilated to 94.5% (0.3%) and venoles to 89.0% (0.3%) of their primary size (fig 3 ).
Table 1.
Variance components for normalised diameters of retinal arterioles and venoles during hyperbaric oxygen treatment (HO)
| Variance source | Degrees of freedom | Mean squares |
| Vessel | 1 | 1.304 |
| Patient | 2 | 0.010 |
| Time during HO | 5 | 0.400 |
| Day of examination | 6 | 0.082 |
| Vessel* patient | 2 | 0.217 |
| Vessel* day | 6 | 0.052 |
| Patient* day | 12 | 0.062 |
| Patient* time | 10 | 0.029 |
| Vessel* time | 5 | 0.069 |
| Day* time | 30 | 0.013 |
| Residual error | 504 | 0.0006 |
The mean control diameter of each vessel before HO was used for normalisation. Main effects and first order interactions are shown in the upper and middle part of the table, respectively. All components of variance and interactions were significantly larger than the residual variance (p<0.001) shown in the lower part of the table.
*Statistical interaction between factors.
Figure 3.
Mean diameter for the vessels and standard error of the mean for all patients during HO: T00 is the time of the beginning of the treatment. T10, T20, T70, and T80 show the diameter of the vessels after 10, 20, 70, and 80 minutes from start of treatment. U10 shows the diameter of the vessels 10 minutes after finishing the treatment. The bars denote the standard error of the means.
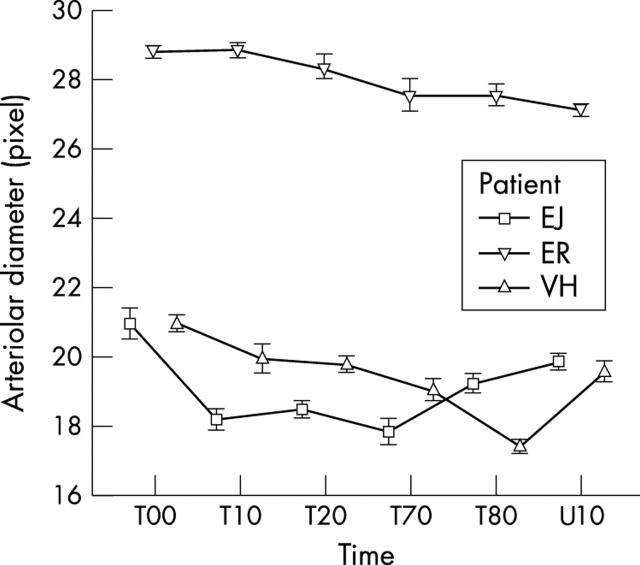
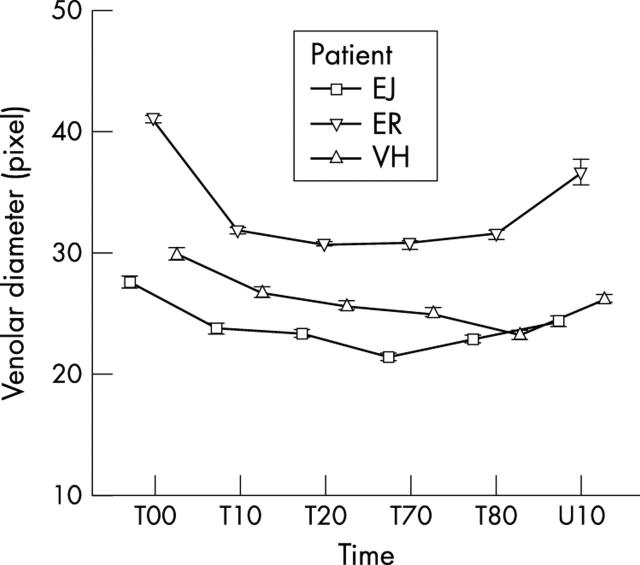
The variance components of days and patients were much smaller (table 1 ) but highly significant. The people had different diameters of the same types of vessel (arterioles or venoles) at ambient pressure. There were differences in constriction pattern of the same types of vessel from different people during HO (figs 4 and 5 ). In all instances the calibre reduction was highly significant statistically (p<0.001). Constriction patterns of the arterioles and venoles from each person were similar for each day of treatment.
Figure 4.
Mean diameter and standard error of the mean of arterioles during HO treatment: VH, EJ, and ER denote patients. T00 is the time of the beginning of the treatment. T10, T20, T80, and T80 show the diameter of the vessels after 10, 20, 70, and 80 minutes after start of treatment. U10 shows the diameter of the vessels 10 minutes after end of treatment. The bars denote the standard error of the means.
Figure 5.
Mean diameter and standard error of the mean of venoles during HO treatment: VH, EJ, and ER denote patients. T00 is the time of the beginning of the treatment. T10, T20, T70, and T80 show the diameter of the vessels after 10, 20, 70, and 80 minutes after start of treatment. U10 shows the diameter of the vessels 10 minutes after finishing treatment. The bars denote the standard error of the means.
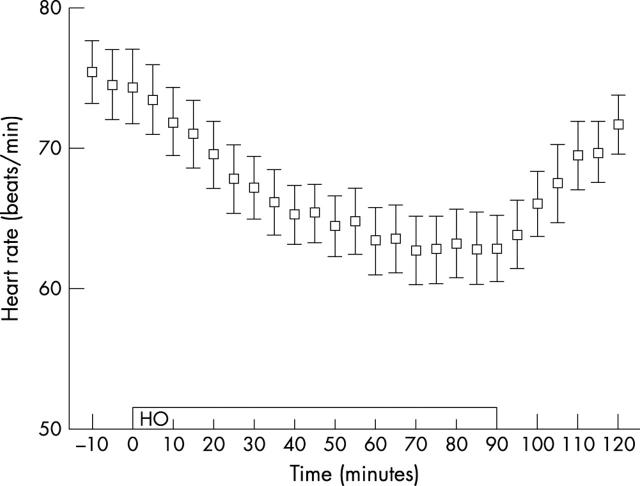
Heart frequency fell during HO from the control value of 75 beats per minute. The fall was greatest (16%) between 70–90 minutes closely following the constriction pattern of the vessels. Ten and 30 minutes after HO it had returned to 88% and 96% of the control value, respectively (fig 6 ). We did not observe significant variations in systolic, diastolic, or mean arterial pressure from the mean control values of 138 (9) mm Hg, 85 (5) mm Hg, and 98 (5) mm Hg, respectively. Mean SaO2 was 98 (0.6) % and 100 (0.0) % before and throughout the treatment, respectively.
Figure 6.
Mean heart frequency and standard error of the mean for all patients during HO: the open bar indicates the duration of the treatment. The bars denote the standard error of the means.
DISCUSSION
To our knowledge this study is the first to describe retinal vessel diameter during a clinical HO treatment and during a complete series of HO treatments.
In previous studies, 3– 6 during the first 5 minutes of one HO treatment fundus photographs were taken with an ordinary fundus camera. The reduction of the retinal vessel diameter was measured on slides by a low power dissecting microscope with a scale in the ocular. In our study reduction of the retinal vessels diameter was measured on digital fundus photographs taken with a hand held ophthalmoscope during 90 minute daily HO treatments for 6 weeks. The retinal blood vessels diameter revealed a reproducible response to HO.
Automated methods for estimating the diameter of the vessels eliminate some but not all bias made by the observer. To minimise it, the diameter was estimated three times with 3–6 days between the measurements. The observer was blinded as to the time of photography and previous results.
Our new method of taking fundus photographs is both consistent and reproducible. It is sufficient to take just one picture of the retina and be able to estimate the diameter of the vessels. This provides the possibility of investigating unconscious people, where the conventional method using a fundus camera is not possible.
There are a few factors that have some influence on the observed results:
Retinal vessel diameter changes during the cardiac cycle. 14 The arterial change is expected as a consequence of the pulse wave entering the eye. Diameter reaches the maximum in mid systole and diminishes towards end diastole. The largest difference represents a change of 3.5%. The diameter of a retinal vein is maintained by balance of the outwardly directed intravascular pressure and the opposing intraocular. Intraocular pressure increases 4% in early systole. This results in a passive reduction of the venous diameter. Diameter increases in diastole. The largest difference represents a change of 4.82%. 14 Those changes during heart cycle are small. They probably do not influence observed changes in our study.
Vasomotion is the spontaneous cyclical contraction and relaxation exhibited by some small arterioles. Its presence has been shown in the vasculature of the retina. 14 Frequency of vasomotoric movements in retina is unknown. 15 The mean change of the diameter caused by vasomotion for arteries and veins is 3.71% and 2.61%, respectively. 14 Those changes are small compared with the observed changes in our study.
Distance between the camera lens and the emmetropic eye barely affect the measured diameter of the vessels in our study: the distance is always almost the same and the size of the images in the camera is constant when parallel waves emit the emmetropic eye.
Development of myopia has been observed in previous studies. 1, 2, 16 Our patients were not refracted but all had normal distant vision and they did not observe any changes during HO.
It would have been desirable to include more people through further study, as significant interaction occurred between people and vessels. For technical reasons the studies were aborted. Notwithstanding, regarding our observation that there is a difference in diameter and constriction pattern of the same types of vessel from different people, the following factors should be considered: (1) Age. The response to oxygen decreases as the age advances. 3 Arteriosclerosis causes decreased vascular reactivity. (2) Sex. There is no evidence that HO affects men and women differently. Therefore this cannot be considered as a source of variation. (3) Health. People in our study were not completely healthy. The fact that they had no distant metastases contradicts the possibility that the disease influenced their cardiovascular system and our results.
HO provides several stress inducing factors. The temperature in the pressure chamber is increasing during HO. Change in skin temperature has been found to influence autonomic nervous regulation. 17 Peripheral vessels dilate at high temperatures and constrict at low. The cooling system provides a relatively constant temperature inside the chamber (temperature fluctuations within 1–2°C). This minimises the influence of autonomic regulation. HO increases density in the gas conveyed through the respiratory passages. 1, 2 Respiratory resistance is directly proportional to the density of the gas. Resistance increases by the delivery valve and shape of Divex mask. Respiratory resistance increase leads to a secondary increase of heart frequency and variation of circulation. Tests of the mask at 2.5 ATA do not influence respiratory resistance. 18 Increase of density at 1.5 to 2.5 ATA is minimal, 1, 2 which does not influence respiration of normal individuals.
The cause of vasoconstriction during hyperbaric oxygenation is not clear by now. Several possibilities have been discussed in previous studies:
Demchenko et al 7 studied cerebral blood flow (CBF) and suggested that reactive O2 species (RES) increase as a function of PO2 19 inactivate NO, and inhibit the vasodilating effect. Formation of other RES, O2-, and other vasodilators may contribute to the observed vasoactive changes during HO. 20
Katusic et al 21 suggested that the superoxyde anion is the endothelium derived contracting factor.
Marrow et al 22 have found that a series of prostaglandin F2 like compounds are produced in vivo in humans by a non-cyclooxygenase pathway involving free radical catalysed peroxydation of arachidonic acid. 8-epi-PGF2α is found to be an extremely potent renal vasoconstrictor.
Lund and Kentala 23 have found that endothelin-1 concentration increases by 6% during HO at 2.5 ATA and 18% during hyperbaric (2.5 ATA) air breathing, and by 30% and 34% after the treatments, respectively. This is in contrast to our observations showing the greatest vasoconstriction of the vessels during HO. Therefore influence of endothelin-1 on retinal vessels alone cannot explain the observed vasoconstriction during HO.
Symphatic and parasymphatic innervation of retina is negligible. 15, 24 It is generally accepted that the retinal vessels have no innervation beyond the lamina cribrosa. Therefore autoregulation of retinal vessels is thought to be particularly important for maintaining constant flow and oxygen supply, despite changes in perfusion pressure and metabolic needs. Although the retinal circulation has no precapillary sphincters 25 it is under strong local autoregulatory control. 26 The arteriolar end of the retinal capillary bed has a unique cytoarchitecture. The ratio between pericyte and endothelial nuclei is 1:1, 27 which is greater than that in cerebral capillaries. They may be expected to be responsive to local metabolic stimuli like PO2, PCO2, and pH levels suggesting an autoregulatory process in the region of 75–85% efficiency. 24
The observed changes in vessel diameter during HO are probably a direct response to the interaction between free oxygen radicals and NO, together with activation of the autoregulatory mechanisms. NO and O2 react rapidly with each other. Therefore vessels constrict significantly after 10 minutes of treatment. The increased NO and sO2 are used promptly after the treatment. This explains rapid dilatation of the vessels after ending of hyperbaric oxidation.
Poiseuille’s law describes the determinants of blood flowing through vessels. 3 The retinal arterioles adjust their diameter and resistance to maintain constant delivery of oxygen. Oxygen content in the arterial blood at atmospheric pressure is about 200 ml/l blood. At 2.5 ATA, it is about 250 ml/l blood due to increased PO2, which increases dissolved O2 in the blood. Maintaining a constant delivery of oxygen, a decrease in flow through a reduction of diameter of the arterioles would be expected. The observed overall reduction of about 10% in the diameter of arterioles in this study corresponds with a 40% fall in flow during HO.
Retinal venous oxygen saturation rises almost to the arterial value during oxygen breathing at atmospheric pressure 1, 2, 5 despite the severe vasoconstriction. The measured increase in venous saturation 5 and colour changes on our photographs suggests this also occur at 2.5 ATA. The available evidence 1, 2, 7, 28 indicates that oxygen consumption remains constant during HO. Diffusion from the choriocapillaries must then be supplying part of the retina previously supplied by retinal vessels. 5 This suggests that the reduction of flow during HO is greater in retinal vessels than choriocapillaries. It is corroborated by the fact that choriocapillaries lack autoregulation. 15, 24
The studies mentioned above describe changes of the arteries. Changes of the vein diameter, governed by La Place’s law, are more difficult to interpret. The observed reduction of 21% in the diameter of the venoles does not exclude the presence of the active constriction mechanism, stimulated by the reaction between RES and NO. More likely, it is a result of change in transmural pressure by reduction in intravascular pressure because of decreased blood flow, causing relaxation of the venous wall. Intraocular pressure is constant during HO, 1, 2, 5 and therefore does not influence the observed results.
In conclusion, our results show reversible vasoconstriction of the retinal vessels during 90 minutes of hyperbaric oxygen treatment. This response is unchanged during 30 treatments distributed over six weeks. Extrapolated to the brain, the results may have implications for the safety of hyperbaric treatment. Our method of taking fundus photographs makes the investigation of unconscious patients possible, in whom the conventional method using a fundus camera is not possible.
Acknowledgments
This study was approved by the ethics committee in Copenhagen, Denmark. The authors would like to thank Mr Peter Engholm and Mr Peder Westergaard for technical assistance and Professor Dr J Bülow for his helpful discussion. Professor Jensen was supported by Eureka project EU1381, AIPO, and The Dandy Foundation.
Abbreviations
ATA, atmospheres absolute pressure
CBF, cerebral blood flow
HO, hyperbaric oxygen
REFERENCES
- 1. Oriani G, Magni R, Wattel F. Handbook of Hyperbaric Medicine. Berlin: Springer-Verlag, 1996:595–607.
- 2. Jain KK. Textbook of Hyperbaric Medicine. 3rd edition. USA: H&H Publishers, 1999:505–17.
- 3. Ramalho PS, Dollery CT. The effects of oxygen on retinal circulation. Ophthalmologica Additamentum 1969;158:506–12. [PubMed] [Google Scholar]
- 4. Beehler CC. Oxygen and the eye. Surv Opht 1964;9:549–60. [PubMed] [Google Scholar]
- 5. Frayser R, Saltsman H, Anderson B, et al. The effects of hyperbaric oxygenation on retinal circulation. Arch Ophthal 1967;77:265–9. [DOI] [PubMed] [Google Scholar]
- 6. Dollery CT, Hill DW, Mailer CM, et al. High oxygen pressure and the retinal blood-vessels. Lancet 1964;13:291–2. [DOI] [PubMed] [Google Scholar]
- 7. Demchenko IT, Boso AE, O’Neill TJ, et al. Nitric oxyde and cerebral blood flow responses to hyperbaric oxygen. J Appl Physiol 2000;88:1381–9. [DOI] [PubMed] [Google Scholar]
- 8. Torbati D, Parolla D, Lavy S. Blood flow in rat brain during exposure to high oxygen pressure. Aviation, Space and Environl Med August 1978:963–67. [PubMed]
- 9. Bean JW, Lignell J, Coulson J. Regional cerebral blood flow, O2 and EEG in exposures at high pressure. J Appl Physiol 1971;31:235–42. [DOI] [PubMed] [Google Scholar]
- 10. Chavko M, Braisted JC, Outsa NJ, et al. Role of cerebral blood flow in seizures from hyperbaric oxygen exposure. Brain Res 1998;791:75–82. [DOI] [PubMed] [Google Scholar]
- 11. Scherfig E, Edmund J, Northved A. Direct ophtalmoscopy with simultaneous colour television transmission. Acta Ophtalmol 1979;57:649–52. [DOI] [PubMed] [Google Scholar]
- 12. Jensen PK, Scherfig E. Resolution of digital colour images. Acta Ophtalmol 1999;77:526–9. [DOI] [PubMed] [Google Scholar]
- 13. Hansen OB, Myhre K, Sandvik L. Retinal vessels responses to exercise and hypoxia before and after high altitude acclimatisation. Eye 1989;3:768–76. [DOI] [PubMed] [Google Scholar]
- 14. Chen HC, Ptel V, Wiek J, et al. Vessel diameter changes during the cardiac cycle. Eye 1994;8:97–103. [DOI] [PubMed] [Google Scholar]
- 15. Dawson H. Physiology of the eye. 5th edition. London: Macmillan Press Ltd 1990.
- 16. Lyne AJ. Ocular effects of hyperbaric oxygen. Trans Opthal Soc UK 1978;98:66–8. [PubMed] [Google Scholar]
- 17. Kunitake T, Ishiko N. Power spectrum analysis of heart rate fluctuations and respiratory movements associated with cooling the human skin. J Auton Nerve System 1992;38:45–56. [DOI] [PubMed] [Google Scholar]
- 18. Lund VE, Kentala E. Heart rate variability in health volunteers during normobaric and hyperbaric hyperoxia. Acta Physiol Scand 1999;167:29–35. [DOI] [PubMed] [Google Scholar]
- 19. Boveris A, Chance B. The mitochondrial generation of hydrogen peroxyde. General properties and effects of hyperbaric oxygen. Biochem J 1973;134:707–16. [DOI] [PMC free article] [PubMed] [Google Scholar]
- 20. Rubanyi GM, Vanhoutte PM. Superoxyde anions and hyperoxya inactivate endothelium-derived relaxing factor. Am J Physiol 1986;250:H822–7. [DOI] [PubMed] [Google Scholar]
- 21. Katusic ZS, Vanhoutte PM. Superoxyde anion is an endothelium-derived contracting factor. Am J Physiol 1989;257:H33–7. [DOI] [PubMed] [Google Scholar]
- 22. Marrow JD, Hill KE, Burk RF, et al. A series of prostaglandin F2-like compounds are produced in vivo in humans by a non-cyclooxygenase, free radical-catalysed mechanism. Proc Natl Acad Sci USA 1990;87:9383–7. [DOI] [PMC free article] [PubMed] [Google Scholar]
- 23. Lund V, Kentala E. Effects of hyperbaric conditions on plasma stress levels and endothelin-1. Undersea Hyperbar Med 1999;26:87–92. [PubMed] [Google Scholar]
- 24. Dumskyj MJ, Eriksen JE, Dore CJ, et al. Autoregulation in the human retina circulation. Assessment using isometric exercise, laser Doppler velocimetry, and computer-assisted image analysis. Microvasc Res 1996;51:378–92. [DOI] [PubMed] [Google Scholar]
- 25. Friedman E, Smith TR, Kuwabara T. Retinal microcirculation in vivo. Invest Ophthalmol 1964;3:217. [PubMed] [Google Scholar]
- 26. Henkind P, Hansen RI, Fzalay J. Ocular circulation. In: Duane TD, eds. Biomedical Foundations of Ophtalmology. Philadelphia: Harper and Row 1987:34–54.
- 27. Cogan DG, Kuwabara T. The mural cell in perspective. Arch Opthalmol 1964;78:133. [DOI] [PubMed] [Google Scholar]
- 28. Chavko M, Braisted JC, Outsa NJ, et al. Role of cerebral blood flow in seizures from hyperbaric oxygen pressure. Brain Res 1998;791:75–82. [DOI] [PubMed] [Google Scholar]


