

Abstract
Aims: To determine the effect of hypoglycaemia on ischaemic retinal injury.
Methods: Rat retinal cultures were incubated in varying concentrations of glucose while placed under standardised anoxic conditions, and the number of surviving GABA immunoreactive neurons was assessed using immunocytochemistry. Hypoglycaemia was induced in age and sex matched Wistar rats by an injection of rapid acting insulin. The blood, vitreous, and retinal glucose concentrations were measured using a hexokinase assay kit. Electroretinography, semiquantitative RT-PCR, and histology were used to compare the functional and structural retinal injury in these rats with the injury in appropriate controls after a period of pressure induced retinal ischaemia.
Results: Retinal cultures maintained in low glucose concentrations (<1 mM) had fewer surviving GABA immunoreactive neurons after an anoxic insult compared with retinal cultures maintained in 5 mM glucose. Hypoglycaemic rats had significantly lower vitreous glucose concentrations (0.57 (SEM 0.04) mM) than the control rats (3.1 (0.70) mM; p<0.001). The a-wave and b-wave amplitudes of the hypoglycaemic rats after 3 and 7 days of reperfusion were significantly lower than the amplitudes of the control rats. Furthermore, the level of Thy-1 mRNA (a retinal ganglion cell marker) was significantly lower in the hypoglycaemic group (p<0.001) and there was a corresponding exacerbation of structural injury compared with the controls.
Conclusion: Hypoglycaemia causes a significant reduction in vitreous glucose levels and exacerbates ischaemic retinal injury.
Keywords: hypoglycaemia, ischaemia, retina, rats
The effect of hypoglycaemia on cerebral ischaemia has been well studied, but information about the effect of hypoglycaemia on retinal ischaemia is lacking. Although severe prolonged hypoglycaemia can cause irreversible neuronal injury, both experimentally and clinically, 1– 4 lesser degrees of insulin induced hypoglycaemia have been shown to attenuate cerebral ischaemic injury, with neuroprotective effects attributed to insulin itself 5, 6 and to the induced low blood glucose levels. 7– 9 The protective effect of hypoglycaemia is consistent with the well described exacerbation of cerebral ischaemia by pre-existing hyperglycaemia, 10 and has led to the suggestion that insulin induced mild hypoglycaemia may benefit stroke patients. 8 Although the retina and brain share many common features, there are reasons to suspect that the effect of hypoglycaemia on retinal ischaemia may be different from its effect on cerebral ischaemia.
Several in vivo studies have shown that vitreous glucose and retinal glycogen are utilised during ischaemia, 11– 14 suggesting that they may be important energy reservoirs. For the rat, an animal that stores little retinal glycogen, 15 the vitreous glucose concentration may be a particularly important determinant of retinal ischaemic tolerance time. Furthermore, the isolated retina can maintain the majority of its ATP requirements under anaerobic conditions, but only as long as glucose is abundant. 16, 17 Conversely, if both glucose and oxygen are scarce, retinal ATP production dramatically declines. 18 We therefore hypothesised that if insulin induced hypoglycaemia reduced vitreous glucose levels and the availability of glucose to the ischaemic retina, then it may exacerbate ischaemic retinal injury. Here, we present evidence in support of this hypothesis and discuss the implications of the findings.
METHODS
Culture preparation and treatment
Retinas were obtained from the enucleated eyes of 3–5 day old Wistar rat pups and mixed rat retinal cultures were prepared as described previously. 19 Cells were harvested and plated on borosilicate glass coverslips coated with poly-l-lysine (10 μg/ml; 15 minutes) in MEM plus 5 mM glucose (Invitrogen, Paisley, UK). After 7 days in culture, the medium was removed and replaced with glucose free MEM with varying amounts of added glucose (0 mM, 100 μM, 1 mM, and 5 mM.) Some cultures were then subjected to 24 hours of anoxia by perfusing them continuously with a 95% N2/5% CO2 gas mixture. After treatment, the number and appearance of the GABA immunoreactive (GABA-IR) neurons were assessed by immunocytochemistry, as previously described. 19
Treatment of animals
Procedures used in this study conformed to the ARVO statement for the use of animals in ophthalmic and vision research and were approved by the Home Office in the United Kingdom. Male Wistar rats (250–300 g) housed in a 12 hour light/dark cycle were used for all experiments; food and water were provided ad libitum. Anaesthesia was achieved with a combination of intramuscular Hypnorm 0.4 ml/kg ((fentanyl citrate 0.315 mg/ml and fluanisone 10 mg/ml) Janssen Pharmaceutica, Beerse, Belgium) and diazepam 0.4 ml/kg.
Induction of hypoglycaemia
Age and sex matched Wistar rats were fasted overnight and injected subcutaneously with rapid acting human insulin (2 U/kg); controls received saline. Two hours later they were anaesthetised and their blood glucose level (BGL) was measured from tail vein blood using a blood glucose sensor (Abbott Laboratories, Medisense Products, Abbott Park, IL, USA). Hypoglycaemia was defined as BGL <2.5 mM; if the BGL was higher the rat was not used in further experiments. Rats were then subjected to pressure induced retinal ischaemia. At the completion of the ischaemia, glucose (2 g/kg) was administered intraperitoneally and rats were allowed to recover with free access to food and water.
Retinal ischaemia
After appropriate anaesthesia, the pupil was dilated with cyclopentolate (1%), the rat was placed in a stereotactic frame, and a 30 gauge needle attached to an elevated sterile isotonic saline reservoir was inserted into the anterior chamber. This produced an intraocular pressure (IOP) of 120 mm Hg (as determined by previous manometric measurements) and induced retinal ischaemia as evidenced by immediate whitening of the fundus. The ischaemia was maintained for precisely 45 minutes, and the fellow eye was left undisturbed. Chloramphenicol ointment was applied to the eye after the procedure and the rat was kept warm during recovery, and then returned to the animal house.
Electroretinography
Baseline electroretinography (ERG) recordings were taken 1–4 days before ischaemia and 3 and 7 days after ischaemia. The scotopic flash ERGs were recorded from dark adapted rats by placing a platinum electrode in contact with the cornea and a reference electrode through the tongue; a grounding electrode was attached to the scruff of the neck. The pupils were dilated with cyclopentolate (1%), and the cornea was intermittently irrigated with balanced salt solution (Alcon, Fort Worth, TX, USA) to maintain the baseline recording and to prevent exposure keratopathy. All procedures were performed in dim red light and the rats were kept warm during and after the procedure.
Ten responses to a 2500 cd/m2 white light flash (10 μs, 0.1 Hz) from a photic stimulator (model PS33-plus; Grass Instrument Divisions; West Warwick, UK) were amplified and averaged using a 1902 Signal Conditioner/1401 Laboratory Interface (CED, Cambridge, UK). The b-wave amplitude was measured from the trough of the a-wave to the peak of the b-wave, and the a-wave was measured as the difference in amplitude between the recording at baseline and the trough of the negative deflection.
Assessment of retinal mRNA levels
Seven days after ischaemia, retinal cyclophilin and Thy-1 mRNA levels were determined using RT-PCR, as previously described. 20 Briefly, total RNA was isolated from whole retinas, and first strand cDNA synthesis performed on 2 μg DNase treated RNA. The individual cDNA species were amplified in a 10 μl reaction, containing the 2 μl cDNA aliquot, PCR buffer (10 mM TRIS-HCl, pH 8.3, 50 mM KCl), 4 mM MgCl2, 200 μM of each dNTP, 4 ng/μl of both the sense and anti-sense primers and Taq polymerase (2.5 U). Reactions were initiated by incubating at 94°C for 10 minutes and PCRs (94°C, 15 seconds; 52°C, 55°C, or 56°C, 30 seconds; 72°C, 30 seconds; performed for a suitable number of cycles (so that the amplification of DNA remained within the linear phase) followed by a final extension at 72°C for 3 minutes). Interexperimental variations were avoided by performing all amplifications in a single run. The PCR products of the primer pairs were separated on 1.5% agarose gels using ethidium bromide for visualisation and yielded single bands corresponding to the expected molecular weights. The relative abundance of each PCR product was determined by digital analysis of gel photographs using Labworks software (Ultra-violet Products, Cambridge, UK). For semiquantitative analysis, the ratio of the Thy-1 densitometric readings between the ischaemic and control eyes was calculated and was normalised to the internal standard mRNA ratio (cyclophilin), which was assumed to be unaffected by the ischaemia.
Histopathology
Terminally anaesthetised rats were transcardially perfused with 50 ml 10 mM phosphate buffered saline, followed by 4% paraformaldehyde. The eyes were enucleated and immersion fixed for 1 hour in 4% paraformaldehyde, transferred to 10% neutral buffered formalin overnight, and processed for routine paraffin embedded sections on an automated tissue processor (Shandon Pathcenre, Thermo Shandon Inc, Pittsburgh, PA, USA). Eyes were embedded sagittally and 5 μm serial sections including the optic nerve were cut using a rotary microtome (Microm HM 330, McBain Instruments, Chatsworth, CA, USA) and stained with haematoxylin and eosin.
Measurement of glucose in the vitreous and retina
The vitreous and retinas were removed from freshly killed rats and placed on ice. The retina samples were weighed, diluted in 1 ml of deionised water, sonicated, deproteinised by boiling for 5 minutes, and centrifuged at 12 000×g for 10 minutes. The supernatant was removed and added to a glucose hexokinase assay reagent (Sigma Chemical Co, St Louis, MO, UK) for 15 minutes and the spectroscopic absorbance was then read at 340 nm. The vitreous samples were sonicated and centrifuged at 12 000×g for 10 minutes. The supernatant was made up to 100 μl with distilled water and assayed in an identical manner. The final glucose concentration (mg/ml) in the vitreous was determined by allowing for the dilution factor and comparing the absorbance to a previously constructed calibration curve (in hypoglycaemic rats the vitreous from both eyes of three animals was pooled to obtain readings within the range of the assay). The weight of glucose per weight of retina was determined in a similar manner.
Statistical analysis
When parametric assumptions were met, a one way ANOVA was used to compare means between two or more independent groups (no post hoc comparisons were made). If parametric assumptions were not met then a Kruskal-Wallis test was used. All statistical determinations were performed using SPSS for Windows, version 10 (SPSS Inc, Chicago IL, USA) and all data are expressed as mean (SEM); a p value of <0.05 was considered statistically significant.
RESULTS
Anoxia for 24 hours caused a drastic reduction in the number of GABA-IR neuronal bodies in mixed retinal cultures and a loss of neural processes from surviving cell bodies (fig 1 ). The extent of the reduction in numbers of these neurons after anoxia was dependent on the concentration of glucose present in the medium during the insult. In the presence of 5 mM glucose (equal to the control amount of glucose in untreated cultures), approximately 17% of GABA-IR neurons remained after anoxia. However, when the concentration of glucose in the medium was 0 mM or 0.1 mM, the neuronal survival was significantly reduced (p<0.001 and 0.01 respectively) compared to the survival with 5 mM glucose. (The reduced survival with 1 mM glucose was of borderline significance (p = 0.06) compared to the survival with 5 mM glucose.)
Figure 1.

The effect of reducing the concentration of glucose in the medium of mixed rat retinal cultures subjected to an anoxic insult. (A) Representative control plate containing 5 mM glucose without anoxia. (B) An anoxic insult causes neuronal death in the presence of 5 mM glucose, but survival markedly worsens when glucose is removed from the media, (C). (D) The concentration of glucose in the medium has a dose dependent effect on neuronal survival after an anoxic insult.
Preliminary experiments showed that 2 U/kg of rapid acting insulin (Actrapid) administered to fasting rats produced blood glucose levels within the desired range, without obvious long term deleterious effects (fig 2 ) The concentration of glucose in the blood, vitreous and retina of hypoglycaemic and control rats is given in table 1 . Two hours after the insulin injection, the mean BGL was 1.5 (0.1) mM. At this level, apart from mild lethargy in some rats, there was no obvious change in neurological function.
Figure 2.

The effect of 2 U/kg rapid acting insulin (Actrapid) administered subcutaneously on the blood glucose level of fasted Wistar rats. The arrow indicates an intraperitoneal injection of glucose 2 g/kg.
Table 1.
Concentration of glucose in the blood, vitreous, and retina of hypoglycaemic* and control rats
| Group | Blood glucose (mM) | Vitreous glucose (mM) | Retinal glucose (μg glucose/mg retina) |
| Hypoglycaemic | 1.5 (0.1) | 0.57 (0.04) | 5.1 (0.16) |
| (n = 9) | (n = 3) | (n = 6) | |
| Control | 6.1 (0.7) | 3.1 (0.70) | 5.3 (0.31) |
| (n = 6) | (n = 6) | (n = 6) |
*Rats were fasted overnight and injected subcutaneously with rapid acting insulin (2 U/kg); glucose concentrations were measured 2 hours later.
The vitreous glucose concentration in the hypoglycaemic group was significantly less than the concentration in the control group (p<0.001), but the free glucose concentration in the retina was not significantly different (p = 0.59).
The mean a-wave and b-wave amplitudes of the untouched eyes in the hypoglycaemic group were not significantly different from the amplitudes of the untouched eyes in the control group at any time point, nor were the levels of Thy-1 mRNA; however, the a-and b-wave amplitudes of the eyes that received ischaemia were significantly different between groups. The mean amplitudes are shown in figure 3A and B , and representative tracings are shown in figure 3C–E . Three and 7 days after the ischaemic injury, the b-wave amplitude in the hypoglycaemic group was significantly smaller than the amplitude in the control group (p<0.001 at both time points; fig 3B ). The a-wave amplitude was less affected by the ischaemia than the b-wave, but was also significantly smaller in the hypoglycaemic group (p = 0.008 at day 3 and<0.001 at day 7; fig 3A ).
Figure 3.

The effect of concomitant hypoglycaemia and ischaemia/reperfusion injury on the ERG. (A) Hypoglycaemia significantly exacerbated the ischaemia induced reduction in the a-wave and the b-wave, (B). (C) Representative baseline ERG recording (arrow indicates the b-wave amplitude); (D) representative ERG recording 7 days after 45 minutes of ischaemia in a normoglycaemic rat; (E) representative ERG recording 7 days after 45 minutes of ischaemia in a hypoglycaemic rat. **p<0.01, ***p<0.001.
Seven days after ischaemia, the level of Thy-1 mRNA (relative to the control gene product, cyclophilin) was significantly less in the hypoglycaemic group than in the control group (p<0.001; fig 4 ).
Figure 4.
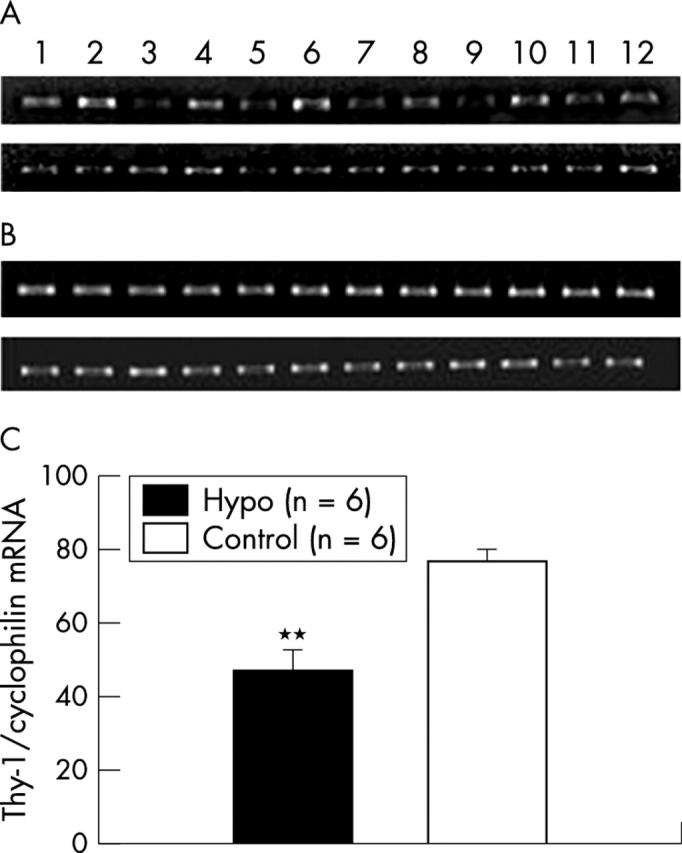
The effect of combined hypoglycaemia and ischaemia/reperfusion injury on the Thy-1 mRNA level. (A) Representative PCR gels of Thy-1, and (B) cyclophilin. (The top gel in each case is from hypoglycaemic rats and the bottom gel is from normoglycaemic rats; odd numbered lanes are from retinas subjected to ischaemia and even numbered lanes are from the fellow untouched retinas.) (C) Graphic representation of optical densitometric recordings from the gels. The Thy-1 ratio between the paired eyes is presented as a percentage of the house keeping gene product (cyclophilin) ratio. **p<0.01.
Figure 5 shows representative histological sections from hypoglycaemic and control rats 7 days after retinal ischaemia. Control rats display partial loss of retinal ganglion cells and mild thinning of the outer plexiform layer (fig 5B ); however, the structural injury in the ischaemic eye of the hypoglycaemic rats (fig 5C ) was considerably more marked. Acute hypoglycaemia without concomitant ischaemia (fig 5D ) did not affect retinal structure.
Figure 5.

(A and B) Representative histological sections from retinas subjected to 45 minutes of ischaemia and 7 days reperfusion. The structural injury, particularly to the inner retina, is considerably worse in the presence of hypoglycaemia (A), compared to normoglycaemia (B). Hypoglycaemia, without concomitant ischaemia, did not affect retinal structure (C) compared to an untreated control retina (D). GCL = ganglion cell layer; IPL = inner plexiform layer; INL = inner nuclear layer; ONL = outer nuclear layer. Solid bars indicate the thickness of the IPL.
DISCUSSION
The b-wave amplitude of the ERG is a functional parameter that is particularly susceptible to ischaemia, 21, 22 and provides a quantitative measurement of middle and inner retinal function. Similarly, Thy-1 mRNA is a RGC marker and its measurement by semiquantitative RT-PCR provides a useful gauge of ischaemic insult, 20 which predominantly affects the inner retina; histopathology provides qualitative structural data about all retinal layers. Using these complementary measurements, we found that hypoglycaemia exacerbates functional and structural ischaemic retinal injury. Furthermore, the in vitro experiments showed a dose dependent reduction in neuronal survival with decreasing concentrations of glucose in retinal cultures subjected to anoxia.
These findings may be explained in light of data from previous in vitro and in vivo studies. Winkler et al have demonstrated that the isolated retina can maintain most of its ATP requirement in the absence of oxygen, as long as glucose is abundant, supporting the notion that the anaerobic conversion of glucose to lactate may represent an important energy source for the ischaemic retina. 16, 17 Conversely, when both glucose and oxygen are scarce, retinal ATP production is dramatically reduced. 18 Furthermore, several in vivo studies have shown that vitreous glucose and retinal glycogen are utilised during ischaemia. 11– 14 Using a pressure induced ischaemia model in rabbits, Weiss found that in the first 20 minutes of ischaemia, retinal glycogen was utilised, but after this period the vitreous became an important source of glucose for anaerobic glycolysis 14 and concluded that the vitreous glucose was the most important energy substrate for retinal ischaemia lasting more than 20 minutes and that the exhaustion of anaerobic glycolysis was a crucial factor in determining the ischaemic tolerance time of the rabbit retina. 14 Given that rats store low amounts of retinal glycogen, 15 and the finding that the free retinal glucose levels were not significantly different in the hypoglycaemia and normoglycaemic rats, it seems likely that vitreous glucose is an important energy source for the ischaemic rat retina.
Moreover, the findings from the current study are consistent with recent studies that have examined the cat ERG during periods of both hypoglycaemia and hypoxaemia. 23, 24 Derwent and Linsenmeier 24 found relatively subtle changes to the cat ERG when the BGL was approximately 1 mM, but noted that the effects of hypoxaemia on the ERG, particularly the reduction of the b-wave amplitude, were exaggerated in the presence of hypoglycaemia. Also consistent with the findings from the current study, they noted that the a-wave was less affected by combined hypoglycaemia and hypoxaemia than the b-wave. 24
Insulin induced hypoglycaemia has been reported to attenuate ischaemic cerebral injury. 5– 9 Hence, the findings from the present study differ from similar studies conducted on the brain. A possible explanation for this discrepancy is the slightly greater degree of hypoglycaemia that was produced in the present study compared to similar studies. Hamilton et al 9 found that an insulin induced BGL of 3.4 (0.2) mM attenuated focal ischaemic cerebral injury. Voll et al, 7 studying the effect of post-ischaemic hypoglycaemia on a forebrain ischaemia model in rats, found that BGLs of 1.2–2.9 mM in the post-ischaemic period significantly reduced the ischaemic injury. Although differences in the degree hypoglycaemia or in the ischaemic model may account for the differences, it is also possible that peculiarities of the retinal metabolism and its unique environment may account for the differences.
The clinical relevance of the present study principally pertains to the relation between diabetes and ischaemic retinopathy. The well described association between initial tightening of glycaemic control and worsening of diabetic retinopathy 25– 29 may represent a clinical correlate of the exacerbation of ischaemic retinopathy by hypoglycaemia. Interestingly, the initial worsening of diabetic retinopathy in the early period of tight glycaemic control usually takes the form of an increase in features characteristic of retinal ischaemia, especially an increase in the number of soft exudates. 27, 29 These findings are consistent with the notion that glucose is an important energy substrate for the ischaemic retina and indicate that low blood glucose levels, although beneficial in terms of retarding the progression of diabetic retinopathy, can compromise the ability of the retina to metabolically compensate during periods of low oxygen availability. Furthermore, it is possible that low glucose levels may exacerbate other ischaemic retinopathies, including venous occlusions and possibly age related macular degeneration.
In conclusion, the present study has demonstrated that reduced blood glucose levels are associated with a significant reduction in the vitreous glucose concentration, and it is suggested that this represents an important loss of energy substrate for the ischaemic retina, effectively reducing the retinal ischaemic survival time and exacerbating an ischaemic injury of a given duration.
No financial support or commercial interests were involved in the research that culminated in this paper.
REFERENCES
- 1. Agardh CD, Kalimo H, Olsson Y, et al. Hypoglycemic brain injury: metabolic and structural findings in rat cerebellar cortex during profound insulin-induced hypoglycemia and in the recovery period following glucose administration. J Cereb Blood Flow Metab 1981;1:71–84. [DOI] [PubMed] [Google Scholar]
- 2. Auer RN, Siesjo BK. Hypoglycaemia: brain neurochemistry and neuropathology. Baillieres Clin Endocrinol Metab 1993;7:611–25. [DOI] [PubMed] [Google Scholar]
- 3. De Courten Myers GM, Xi G, Hwang JH, et al. Hypoglycemic brain injury: potentiation from respiratory depression and injury aggravation from hyperglycemic treatment overshoots. J Cereb Blood Flow Metab 2000;20:82–92. [DOI] [PubMed] [Google Scholar]
- 4. Nellgard B, Wieloch T. Cerebral protection by AMPA- and NMDA-receptor antagonists administered after severe insulin-induced hypoglycemia. Exp Brain Res 1992;92:259–66. [DOI] [PubMed] [Google Scholar]
- 5. Izumi Y, Pinard E, Roussel S, et al. Insulin protects brain tissue against focal ischemia in rats. Neurosci Lett 1992;144:121–3. [DOI] [PubMed] [Google Scholar]
- 6. Voll CL, Auer RN. Insulin attenuates ischemic brain damage independent of its hypoglycemic effect. J Cereb Blood Flow Metab 1991;11:1006–14. [DOI] [PubMed] [Google Scholar]
- 7. Voll CL, Auer RN. The effect of postischemic blood glucose levels on ischemic brain damage in the rat. Ann Neurol 1988;24:638–46. [DOI] [PubMed] [Google Scholar]
- 8. Auer RN. Insulin, blood glucose levels, and ischemic brain damage. Neurology 1998;51:S39–43. [DOI] [PubMed] [Google Scholar]
- 9. Hamilton MG, Tranmer BI, Auer RN. Insulin reduction of cerebral infarction due to transient focal ischemia. J Neurosurg 1995;82:262–8. [DOI] [PubMed] [Google Scholar]
- 10. Kagansky N, Levy S, Knobler H. The role of hyperglycemia in acute stroke. Arch Neurol 2001;58:1209–12. [DOI] [PubMed] [Google Scholar]
- 11. Kaskel D, Hockwin O, Metzler U, et al. Glycogen content in the rabbit retina in relation to blood circulation. Ophthalmol Res 1973;5:177–85. [Google Scholar]
- 12. Wassileva P, Dabov S. Changes in the glycogen content and the electroretinogram in retinal ischaemia experimentally-induced in rabbits. In: C. JS, eds. Vision and circulation. London: Kimpton, 1976:66–78.
- 13. Wassilewa P, Hockwin O, Korte I. Glycogen concentration changes in retina, vitreous body and other eye tissues caused by disturbances of blood circulation. Albrecht von Graefes Arch Klin Ophthalmol 1976;199:115–20. [DOI] [PubMed] [Google Scholar]
- 14. Weiss H. The carbohydrate reserve in the vitreous body and retina of the rabbit’s eye during and after pressure ischaemia and insulin hypoglycaemia. Ophthalmol Res 1972;1:360–71. [Google Scholar]
- 15. Kuwabara T, Cogan D. Retinal glycogen. Arch Ophthalmol 1961;66:96–104. [DOI] [PubMed] [Google Scholar]
- 16. Winkler B. A quantitative assessment of glucose metabolism in the isolated rat retina. In: Christen Y, Doly M, Droy-Lefaix M-T, eds. Les Seminaires ophtalmologiques dIPSEN: vision et adaptation. Amsterdam: Elsevier, 1995:78–96.
- 17. Winkler BS, Arnold MJ, Brassell MA, et al. Glucose dependence of glycolysis, hexose monophosphate shunt activity, energy status, and the polyol pathway in retinas isolated from normal (nondiabetic) rats. Invest Ophthalmol Vis Sci 1997;38:62–71. [PubMed] [Google Scholar]
- 18. Winkler BS. Glycolytic and oxidative metabolism in relation to retinal function. J Gen Physiol 1981;77:667–92. [DOI] [PMC free article] [PubMed] [Google Scholar]
- 19. Chidlow G, Schmidt KG, Wood JP, et al. Alpha-lipoic acid protects the retina against ischemia-reperfusion. Neuropharmacology 2002;43:1015–25. [DOI] [PubMed] [Google Scholar]
- 20. Nash MS, Osborne NN. Assessment of Thy-1 mRNA levels as an index of retinal ganglion cell damage. Invest Ophthalmol Vis Sci 1999;40:1293–8. [PubMed] [Google Scholar]
- 21. Block F, Schwarz M. The b-wave of the electroretinogram as an index of retinal ischemia. Gen Pharmacol 1998;30:281–7. [DOI] [PubMed] [Google Scholar]
- 22. Barnett N, Osborne N. Prolonged bilateral carotid artery occlusion induces electrophysiological and immunohistochemical changes to the rat retina without causing histological damage. Exp Eye Res 1995;61:83–90. [DOI] [PubMed] [Google Scholar]
- 23. McRipley MA, Ahmed J, Chen EP, et al. Effects of adaptation level and hypoglycemia on function of the cat retina during hypoxemia. Vis Neurosci 1997;14:339–50. [DOI] [PubMed] [Google Scholar]
- 24. Derwent JJ, Linsenmeier RA. Hypoglycemia increases the sensitivity of the cat electroretinogram to hypoxemia. Vis Neurosci 2001;18:983–93. [PubMed] [Google Scholar]
- 25. Lauritzen T, Frost Larsen K, Larsen HW, et al. Effect of 1 year of near-normal blood glucose levels on retinopathy in insulin-dependent diabetics. Lancet 1983;1:200–4. [DOI] [PubMed] [Google Scholar]
- 26. Dahl JK, Brinchmann HO, Hanssen KF, et al. Rapid tightening of blood glucose control leads to transient deterioration of retinopathy in insulin dependent diabetes mellitus: the Oslo study. Br Med J (Clin Res Ed) 1985;290:811–15. [DOI] [PMC free article] [PubMed] [Google Scholar]
- 27. Brinchmann HO, Dahl JK, Hanssen KF, et al. Effects of intensified insulin treatment on retinal vessels in diabetic patients. Br J Ophthalmol 1988;72:666–73. [DOI] [PMC free article] [PubMed] [Google Scholar]
- 28. The Kroc Collaborative Study Group. Blood glucose control and the evolution of diabetic retinopathy and albuminuria. A preliminary multicenter trial. N Engl J Med 1984;311:365–72. [DOI] [PubMed] [Google Scholar]
- 29. Brinchmann HO, Dahl JK, Hanssen KF, et al. Effects of intensified insulin treatment on various lesions of diabetic retinopathy. Am J Ophthalmol 1985;100:644–53. [DOI] [PubMed] [Google Scholar]