Abstract
Aims: To describe a method for computerised alignment and averaging of sequences in optical coherence tomography (OCT) B-scans and to present selected clinical observations based on the resulting improvement in retinal imaging.
Methods: A methodological study and retrospective investigation of selected cases. Five human subjects were included, one healthy subject, two patients with central serous chorioretinopathy, one patient with branch retinal vein occlusion, and one patient with cilioretinal artery pseudo-occlusion. Based on computerised alignment of sets of B-scans obtained at identical retinal locations, average OCT images were produced and displayed in false colour or grayscale. These enhanced tomograms were compared with other morphological and functional characteristics.
Results: Improved retinal imaging enabled assignment of the OCT image to retinal anatomy particularly at the outer layer of the photoreceptors and the retinal pigment epithelium, both in the healthy eye and in pathology. Identification of both post-oedematous structural disorganisation as well as post-ischaemic attenuation of the inner retina was superior to standard OCT images.
Conclusions: Averaging of multiple OCT B-scans enhances the quality of retinal imaging sufficiently to reveal new details of retinal pathophysiology. Using the technique on OCT3 scans enables visualisation of details comparable with the results obtained using ultra high resolution OCT.
Keywords: central serous chorioretinopathy, imaging, ischemia, optical coherence tomography
First generation clinical instrumentation for optical coherence tomography (OCT1 and OCT2) enables reliable demonstration of changes in overall retinal thickness, detection of fluid in and behind the neurosensory retina, and, to some extent, identification of the retinal nerve fibre and photoreceptor layers. The intervening layers of the neurosensory retina are only vaguely discernible and, in spite of the improved resolution of the OCT3, the relation between histology and OCT has not been fully elucidated.
Further improvements are possible with ultra high resolution instruments based on titanium sapphire lasers; however, this instrument is yet not commercially available.1–3
Theoretically, improved OCT imaging may be achieved by alignment and averaging of a series of repetitive B-scans from identical fundus locations. We have successfully explored this idea using data from conventional OCT instruments (OCT2 and OCT3) and examined selected informative cases where tissue damage was confined to specific layers and regions of the retina.
SUBJECTS
This retrospective non-interventional study included five subjects, one in good health, two patients with idiopathic central serous chorioretinopathy, and two patients with localised inner retinal ischaemia. The study was a retrospective analysis of digital image information and did not require institutional review.
METHODS
Patients were examined with optical coherence tomography using the OCT2 and the OCT3 instruments (Zeiss Humphrey, Inc, Dublin, CA, USA and Carl Zeiss, Meditec, Dublin, CA, USA). In the case of OCT2 each B-scan is based on 100 A-scans equally divided along the scan. With the OCT3 system the number of A-scans per B-scan is 512. Thus for a given width of the scan line the OCT3 measurement provides a smaller transverse pixel spacing than is obtained with the OCT2. The nominal transverse resolution is 20 μm for both instruments and the scan length for an OCT2 should not exceed 2 mm to obtain the optimal resolution, while a standard 6 mm scan in the OCT3 takes full advantage of the resolution. The axial resolution of the OCT2 system is approximately 15 μm and has been improved to 10 μm for the OCT3. Additional examinations included slit lamp biomicroscopy, automated perimetry (HFA II, model 750, Zeiss Humphrey), digital greyscale fundus photography in red free illumination using a Topcon TRC-50X (Tokyo, Japan) retina camera with a Kodak Megaplus model 1.4 (San Diego, CA, USA) digital backpiece.
The dominating noise source in OCT images is usually speckle noise arising from interference between coherent waves backscattered from nearby scatterers in the measuring volume of the retina. One classic way of suppressing noise is to average a number of measurements, the underlying assumption being that the noise is stochastically varying over the measurements taken. However a geometrical/physical change of the measuring configuration relative to the sample or vice versa is needed to change the speckle pattern. The use of polarisation diversity, spatial compounding, and frequency compounding have been suggested as ways of obtaining measurements with uncorrelated speckles, but none of them has proved to be entirely satisfactory.4 One can also apply digital filters (mean or median) or wavelets for denoising in a post-processing step. The wavelet technique is however compromised by the scale and structures of the speckle patterns, being typically quite similar to the structures one is attempting to image.5
In the present case where the measurements are carried out in vivo, sufficient variation is introduced by the invariable inaccuracy in reproducing the full geometric configuration of the eye and the OCT instrument between successive B-scans. To provide an example, the target region of the retina may well be in proper focus for all B-scans and yet be observed through slightly different aspects of the pupil. This implies that the generated speckles will vary between successive B-scans. In order to align these with enough precision to reduce speckle noise we developed a robust correlation algorithm for aligning the individual A-scans from corresponding retinal locations from the series of B-scans. Thus, the scans are aligned by maximising a weighted least square measure of the signal difference between corresponding A-scans. The average is a weighted average, in that individual A-scans exhibiting a poor correlation with the corresponding A-scans from other B-scan sequences contribute less to the final average than A-scans with higher correlation. This average image is then aligned horizontally using cross correlation. All computations were made on a personal computer with a Pentium II 850 MHz processor using customised software.
Five to 15 consecutive recorded B-scans were retrieved for each retinal location of interest. The specific number of scans included per average was chosen by visual inspection—that is, new scans were added until no further improvement in image quality was observed. It was assumed that the scan line does not shift between the repeated recordings. The few scans that were clearly misaligned in the transverse direction were simply rejected.
The images were displayed in false colour and greyscale after histogram stretching and smoothing.
RESULTS
Comparison of conventional single scan OCT images, with images produced by averaging of multiple scans of identical retinal locations, demonstrated the following general and disease specific characteristics:
Case 1
In a healthy woman aged 28 years, conventional horizontal transfoveal single scan OCT of her right eye (OCT2, fig 1A) demonstrated four clearly discernible retinal layers of the perifoveal retina. They are commonly interpreted as representing, from the inside, the hyperreflective retinal nerve fibre layer, a composite layer of other inner retinal layers, the hyporeflective photoreceptor layer, and the retinal pigment epithelium/choriocapillaris. The choroid is defined by the posterior border of the retinal pigment epithelium (RPE) but is in itself structureless and without definition of its posterior limitation. The average image shown in fig 1B and C (false colour and greyscale, respectively) demonstrates the improved imaging. From the average image in false colour the hyperreflective inner and outer plexiform layers are discernible. In the greyscale image, the hyperreflective layer (which in other OCT3 studies has been interpretated as the junctions of the inner/outer photoreceptor), segments are visible as well as the layer interpretated as the elongated outer photoreceptor segments in the fovea (a hyporeflective layer).
Figure 1.
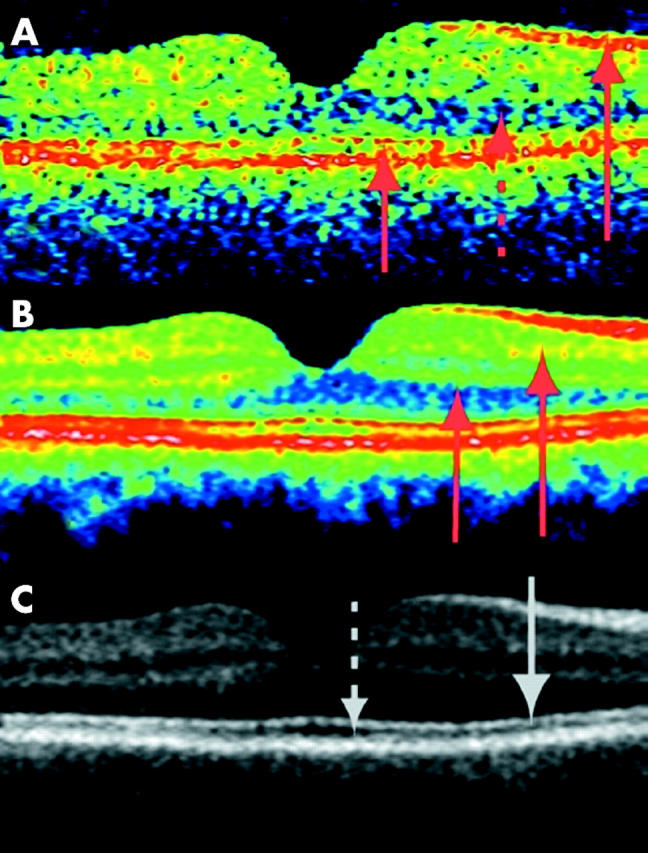
Transfoveal optical coherence tomograms of the right eye of a healthy 28 years old woman (horizontal section, nominal width 5 mm). With the greyscale palette, white corresponds to the highest reflectivity and black to the lowest. For the false colour image, the colours are in order of decreasing signal intensity: white-red-yellow-green-blue-black. Hyperreflective layers are shown by arrows drawn in full, the hyporeflective layers are shown with a stippled arrow. (A) Conventional single scan image from OCT2, the most prominent layers shown by arrows (from top to bottom: retinal nerve fibre layer (RNFL), photoreceptor layer (PL), retinal pigment epithelium (RPE), and choriocapillaries (ChC). (B) Average of nine scans from the same location. Note the increased differentiation between the layers, the hyperreflective inner and outer plexiform layers are now discernible (arrows). The hyperreflective layer attributed to the RPE/choriocapillaris is now seen as a multilayered structure. (C) The same averaged scans as above, now in greyscale. The multilayered structure is clearly visible. The hyperreflective band (first arrow from the top) is attributed to the junctional complex of inner and outer photoreceptor segments (IS/OS). The hyporeflective band below, clearly wider in the fovea, is attributed to the photoreceptor outer segments.
With the improved resolution of OCT3, the layers are more clearly defined though the signal to noise ratio seems lower with the OCT3 (fig 2A). The averaged OCT3 image (figs 2B and C) enables definition of several additional layers, the histological correlations of which can be assigned tentatively.6,7 Thus, a hyporeflective layer of ganglion cells appears to be discernible from the hyperreflective inner plexiform layer, which again is discernible from the hyporeflective inner nuclear layer. Then follows a well defined hyperreflective outer plexiform layer, after which the hyporeflective outer nuclear layer appears to blend without a visible transition into the equally hyporeflective photoreceptor layer.
Figure 2.
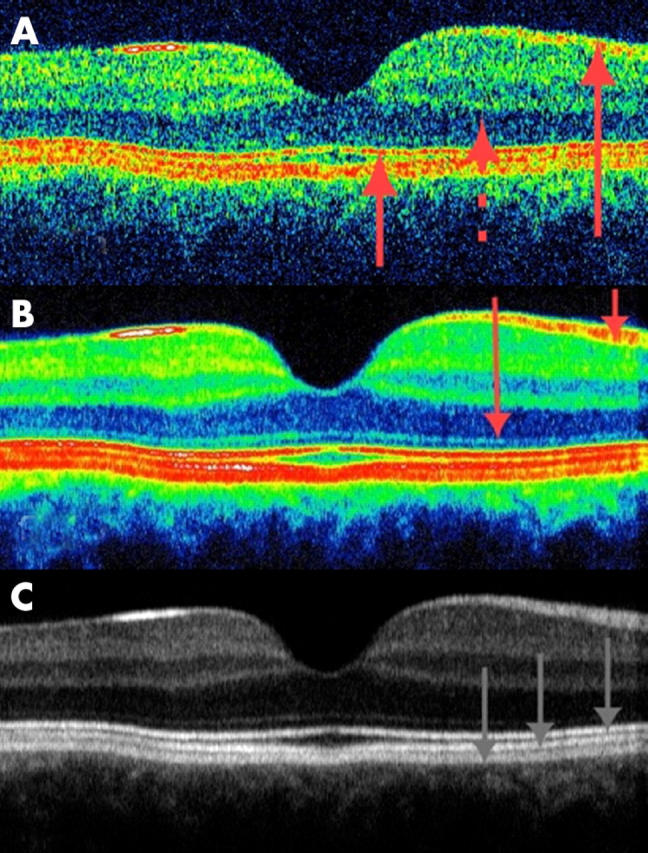
(A) Conventional single scan from the same patient as in figure 1 but recorded with the OCT3 (again the nominal width of the horizontal section is 5 mm). The signal to noise ratio seems to be lower in the OCT3 image (probably because of the increased scanning speed of the system). The retinal nerve fibre layer (RNFL) and photoreceptor layers as well as the inner and outer photoreceptor segments (IS/OS) junctional complex are shown by arrows. (B and C) Averaging of 13 scans from the same retinal location enables enhanced imaging of the retina, and display in false colour coding or greyscale enables identification of several additional layers. In the colour coded image, the RNFL layer and the thin external limiting membrane are shown with red arrows. The outermost layers are clearly seen as a five layered structure consisting of three hyperreflective bands and two thin hyporeflective bands. From top to bottom in the greyscale image: the innermost hyperreflective band of the IS/OS junctional complex, the second hyperreflective layer corresponding to the outer segments interdigitising with the microvilli of the retinal pigment epithelium (RPE), and the outermost hyperreflective bands are shown by grey arrows. The outermost layer is probably due to a signal from the RPE cell bodies, although reflections from choriocapillaris might also be included.
By comparison with histological sections, the photoreceptors appear to extend through layers of markedly varying reflectivity, the cell bodies and inner segments being hyporeflective. The outermost part of this compound hyporeflective OCT layer contains a distinct, very thin photoreceptor hyperreflectivity layer, possibly the outer limiting membrane,1,2 about 20 μm in front of the layer conventionally assigned to the RPE. A measure of the full width half maximum of reflections from isolated structures in the retina indicates that axial resolution of the averaged OCT scans is approximately 10 µm in agreement with the distinct outline of the outer limiting membrane.
In averaged OCT2 images we note that the outer, hyperreflective band observed in single scan OCT2 images is resolved into three distinct hyperreflective layers with two intervening hyporeflective layers, all of which are elevated in the case of retinal pigment epithelial detachment (not shown). The innermost of the three hyperreflective layers has been assigned to the inner/outer photoreceptor junctions and the first hyporeflective layer to the outer segments of the photoreceptors known to be elongated in the foveal region.1,2 Thus two of the five layers have been identified.
The three remaining layers, which are clearly visible in figure 1C, have previously been assigned to the RPE. However, these three layers are too thick to be composed of the RPE cell bodies only, their thickness being only 10 µm in histological sections. From histological studies it is known that the photoreceptor outer segments are wholly or partially immersed in the apical processes of the RPE cells. Whereas the nuclei of several cell types seem to be hyporeflective, intraretinal membranous structures perpendicular to the optical axis seem to be hyperreflective. The second hyperreflective layer of the outer five layered structure of the OCT scan might be attributed to the interdigitising outer segment/RPE junction.
Case 2
A man aged 62 years presented with a paracentral relative scotoma in his left eye, the scotoma being distinctly visible immediately after awakening in the morning and upon blinking. Ophthalmoscopy revealed multiple small, asymmetrically distributed foci of pigment epithelial pallor without transparency, compatible with previous episodes of central serous chorioretinopathy. Corresponding to the inferonasal relative scotoma, a superotemporal parafoveal area of attenuation of the RPE was seen. A conventional vertical transfoveal scan (OCT2, fig 3A) passing tangentially through this area showed a spherical region of hyperreflectance in the fovea and a hyporeflective localised defect of the layer conventionally attributed to the RPE. With the averaged images (fig 3B and C) the layer attributed to the RPE is now seen a as multilayered structure and a splitting of layers seems to have occurred in the parafoveal region. A splitting occurring at the level of the outer segments/retinal pigment epithelial interdigitation is also a likely explanation of the central serous chorioretinopathy. The evaluation of the foveal region is most favourable in the grey image where the layer of the junction between inner and outer photoreceptor segments is visible. The hyporeflective layer of the outer segments seems relatively undisturbed compared with the healthy subject, corresponding to a visual acuity of 1.0.
Figure 3.
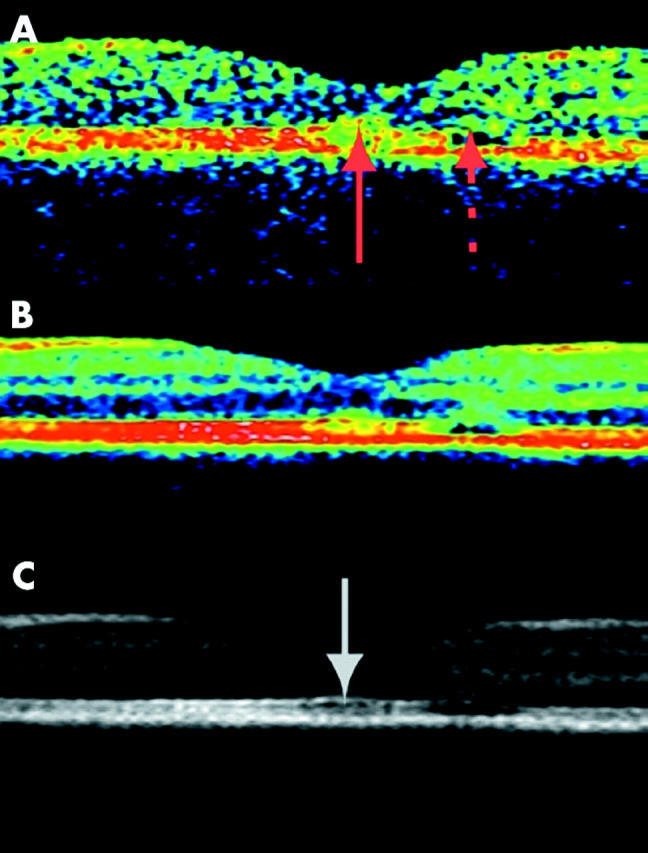
Transfoveal optical coherence tomogram of the left eye of a 62 year old man with recurrent central serous chorioretinopathy but otherwise healthy (OCT2, vertical scan, nominal width 2.83 mm). The patient complained of a paracentral relative scotoma of recent onset. The fundus demonstrated many small asymmetrically distributed foci of untransparent pigment epithelial pallor and a larger parafoveal area of RPE pallor corresponding to the scotoma. (A) Conventional single scan OCT demonstrated a parafoveal hyporeflective, localised defect in the layer conventionally attributed to the retinal pigment epithelium (stippled arrow). The fovea seems slightly abnormal (full drawn arrow) compared with a healthy eye. (B and C) Averaging of 10 OCT scans demonstrated that the RPE splitting is located at the top and/or middle part of the multiple outer layers demonstrated in figure 1 bottom, presumably at the interdigitating transitional level of the photoreceptor outer segments and RPE microvilli. The impression of a relatively undisturbed fovea (white arrow) is compatible with a visual acuity of 1.0.
Case 3
A woman aged 50 years complained of a decrease in vision during the preceding 4 months. In her left eye visual acuity was 0.6 and a central serous detachment was found at the ophthalmological examination and confirmed with OCT3 (fig 4). As revealed clearly in figure 4C, the inner/outer photoreceptor junction is visible although the image intensity is below that of the healthy eye. The reduction in intensity could be caused by a change in backscatter properties, with a change towards more multiple scatter and/or scatter in all directions at the expense of direct backscatter. The loss of intensity is also seen on OCT images of patients with severe degrees of retinal oedema and both a change in the scatter properties of the tissue and a tilt of reflecting surfaces in relation to the optical axis might be a cause. The outer segments and the inner part of the next hyperreflective layer appear to have been torn up at the level of the serous detachment, indicating that the middle hyperreflective layer seen in the healthy eye is composed of the tips of the photoreceptors and the villous processes of the RPE. With time, the threadlike remnants probably condense to pigment lumps, as is typically observed for long standing serous detachment. The outermost hyporeflective and hyperreflective layers therefore seem to originate from the RPE cell bodies. The outermost hyperreflective layer might include a strong signal from the RPE/Bruch’s membrane/choriocapillaris interface.
Figure 4.
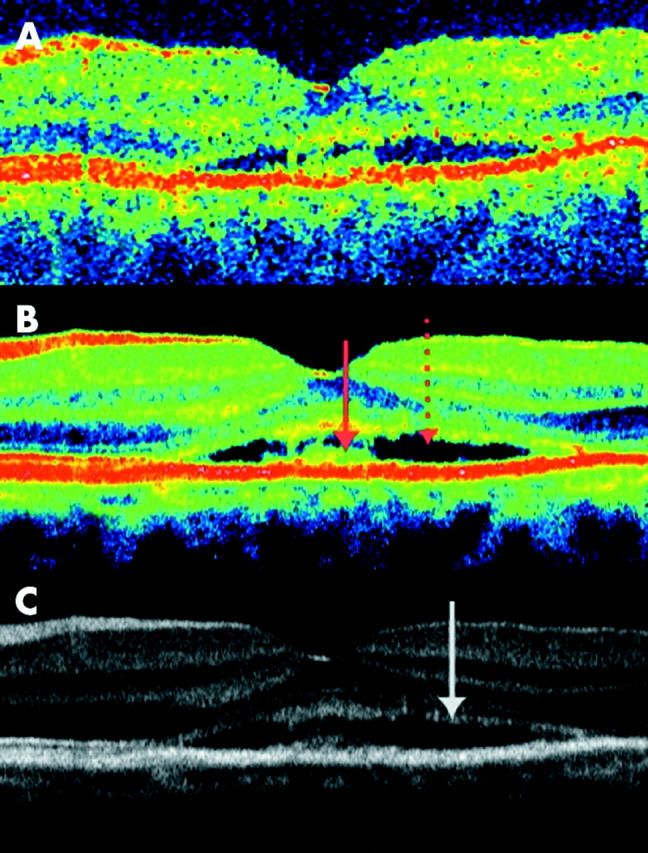
Transfoveal optical coherence tomograms (OCT3, horizontal orientation, nominal width 5 mm) of the left eye of a 50 year old woman with 6 months complaint of blurred vision and photograpic (not shown) and clinically evidence of central serous retinopathy. (A) Conventional single scan image. (B and C) Averaging of eight images. The serous detachment and debris at the inner surface of the RPE are shown with arrows on the colour image. A serous detachment is seen at the level of the middle hyperreflective band, bordered with debris both on the posterior border of the neuroretina and the anterior border of the RPE. As seen on the greyscale image, both the hyperreflective lines from the outer limiting membrane and the junctions of inner and outer photoreceptor segments (arrow) are of lower intensity but otherwise comparable with the healthy eye.
Case 4
A woman aged 57 years developed a minor macular branch retinal vein occlusion without accompanying foveal oedema in her right eye (fig 5, upper left). Haemorrhage and oedema resolved spontaneously over a period of 3 months (fig 5, upper middle), leaving an arcuate relative scotoma corresponding to the temporarily congested area of the macula and the adjacent upper temporal macula, documenting partial lesion by congestion and associated ischaemia of the involved region, including traversing nerve fibres from the adjacent temporal macula (fig 5, upper right). Single scan OCT2 images demonstrated no difference between the affected right eye and the healthy left eye (fig 5, upper of three OCT rows). Averaged images, however, demonstrated localised loss of the layered structure of the inner retina superior to the fovea without accompanying reduction of the overall retinal thickness (fig 5, lower two).
Figure 5.
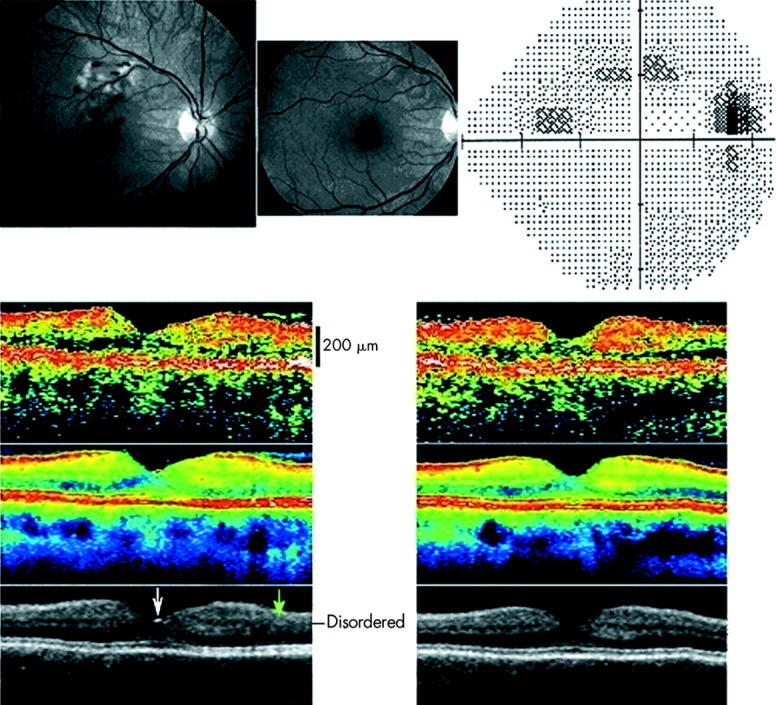
Fundus photographs in red free illumination (upper left and middle) and automated perimetry (upper right) from the right eye of a 57 year old woman with a macular branch retinal vein occlusion compromising the drainage of a section of the right macula above the fovea. No foveal oedema was found at presentation (upper left) or at follow up 3 months later (upper middle). Perimetry threshold sensitivity values at follow up are presented using graphical encoding as per Humphrey standard. The perimetry spans an eccentricity of 30° in all directions from the point of fixation and is shown in retinal view to enable comparison with the fundus photographs. Threshold values encoded as per Humphrey standard, with eccentricity markers for every 10°. At presentation, oedema and haemorrhage were confined to an area above the fovea. All ophthalmoscopical visible lesions resolved within 3 months (middle). However a permanent relative arcuate scotoma was found corresponding to the most ischaemic part of the affected venous drainage area and an area inferotemporal to the ischaemic area—presumably caused by ischaemic injury to the retinal nerve fibres traversing the ischaemic area. Lower section shows transfoveal optical coherence tomograms (OCT2, vertical scan, nominal width 5.65 mm), from the right eye (left) and the healthy left eye (right) of the same subject 3 months after presentation. The uppermost OCT scan is a conventional single scan, whereas the middle image is obtained from averaging eight images. A reflection is seen from the foveal pit (white arrow). The affected region of the retina of the right eye demonstrated a disruption of the layered structure of the inner retina superior to the fovea (marked with a green arrow). In the figure the superior retina is seen to the right of the foveal pit.
Case 5
A man aged 52 years with anchylosing spondylitis on the day of admission for visual loss secondary to acute unilateral inner retinal ischaemia in the supply area of a cilioretinal artery. At presentation the fundus demonstrated ischaemic oedema in this area (fig 6, top). The ischaemia of the cilioretinal artery was attributable to non-occlusive central retinal vein congestion (papillophlebitis) causing an increased resistance to outflow and a secondary reduction of inflow in the cilioretinal artery, which has a lower perfusion pressure than the central retinal artery. Three months after presentation, when the congestion had disappeared, the fundus appearance was normal but conventional OCT demonstrated distinct atrophic attenuation of the retina in the supply area of the affected retinal arteriole (fig 6 top, with inserted OCT in vertical orientation and line indicating orientation of scan). Single scan OCT of the macula above the fovea are compared to colour coded and grey averaged OCT scans in the bottom of figure 6. The averaged OCT image demonstrated that the layered structure of the retina was intact, and confirmed with improved definition that the reduction in thickness was confined to the inner half of the retina. The averaged scans indicate a relative hyperreflectivity of the inner retina, which is indicative of condensation of the tissue as a result of the selective inner retina ischaemic injury.
Figure 6.
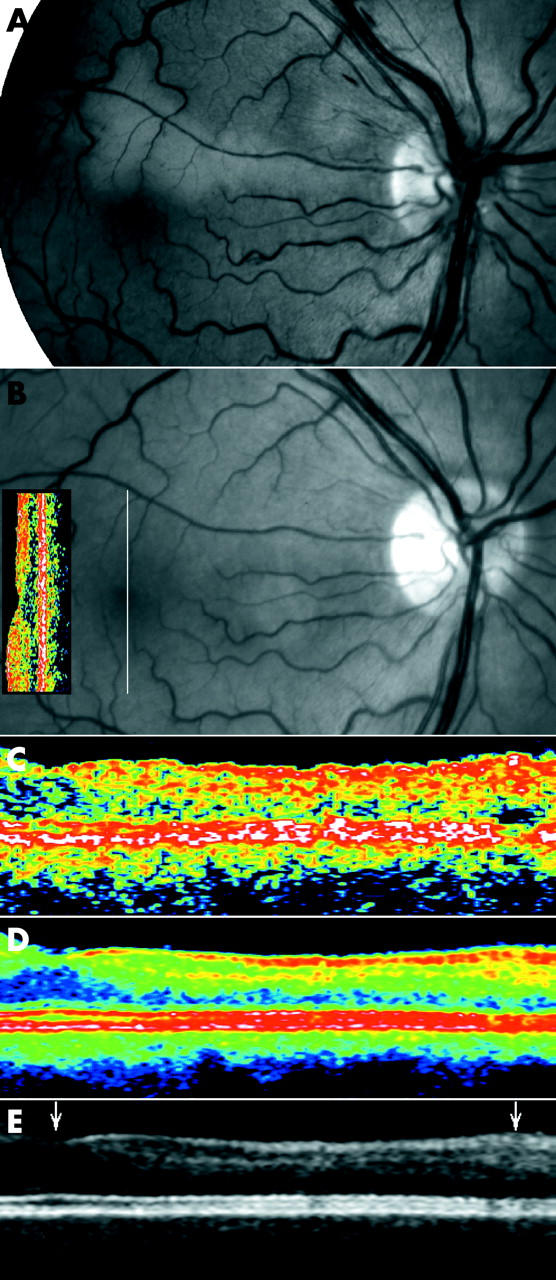
(A) Fundus photographs of the right eye of a 52 year old man on the day of admission for visual loss secondary to acute unilateral inner retinal ischaemia in the supply area of a cilioretinal artery. Four months later venous congestion and the accompanying ischaemic oedema had spontaneously disappeared (B) without ophthalmoscopically visible changes, but an absolute scotoma persisted along the cilioretinal artery. Single scan OCT in conventional display demonstrated attenuation of the neurosensory retina above the fovea (the OCT insert on the fundus image, vertical orientation indicated by white line through the fovea, nominal width 2.83 mm, OCT2). Optical coherence tomograms centred above the fovea corresponding to the supply area of the cilioretinal artery (5 mm scan), in single scan mode (C), and after averaging 11 scans (colour coded, (D), and greyscale, (E)) demonstrated that the attenuation was confined to the inner retinal layers of the superior macula, corresponding exactly to the area of ischaemia. The scans include the fovea (left arrowhead) and the upper half of the macula of the right eye to the level of the branch vein above the fovea (right arrowhead). Only the average images show that the attenuation is confined to the middle and, to a lesser extent, the innermost layers of the retina.
DISCUSSION
Our study confirms that reduction of speckle noise in optical coherence tomography by alignment and averaging of multiple OCT scans from identical retinal locations results in improved imaging of the retina. The averaged images correlate well with the known pathology of clinical cases, and yield new information of the outer layers of the retina most notably with the OCT3. With this technique, three hyperreflective and two hyporeflective layers are discernible in the outermost part of the scan, and the middle hyperreflective layer can be attributed to the level of outer photoreceptor pigment epithelium interdigitising cells in agreement with histological studies.8,9 In the case of single scan OCT2, this layering is not detectable and the whole band has simply been allocated to the retinal pigment epithelium/choriocapillaris.
With the new averaged images, we were also able to demonstrate subtle, previously undocumented alterations of intraretinal architecture after ischaemic injury, leaving no opthalmoscopically visible changes of the neurosensory retina, even with OCT2 images.
The correlation between histology and OCT is not straightforward because the two techniques rely on different principles to produce contrast. The histological preparation makes use of artificial stains to achieve contrast or freeze fracturing of tissue to expose its natural surfaces of mechanical cleavage, whereas OCT displays contrast in reflectivity and attenuation as observed from the centre of the pupil. Thus, only variations in tissue refractive index at surfaces that are close to orthogonal to the direction of view will be detected. These are found at the vitreous retina interface and in the plexiform layers of the retina, but variations in refractive index could also be the origin of the hyperreflective signals from the inner/outer photoreceptor junctions and the zone of interdigitising outer segments/pigment epithelium. The orientation and hence the reflectivity of some retinal structures varies, however, with eccentricity from the fovea, Furthermore, the reflectivity varies in relation to disease. Such effects have scarcely been researched.
The functional subdivision of the retina is closely related to its histological layering and hence the correlation between histology and OCT is of fundamental interest.10,11 Comparison with histology indicates that the fibre layer of Henle contributes to a wide hyporeflective OCT layer which also includes the outer nuclear layer and some of the photoreceptor layer, the only interruption of which is seen as a resolution limited thin band of moderate reflectivity near the transition between the outer and inner segments, presumably the outer limiting membrane.1,2 The hyporeflectivity of the photoreceptors might be attributed to their elongated morphology where light is internally reflected, in analogy with optical fibres.1,2
The photoreceptors extend through layers of markedly varying reflectivity as their outer section forms part of several layers of the RPE associated complex. When the neurosensory retina is split from the retinal pigment epithelium, microscopic examination demonstrates fragments of pigment found among the photoreceptors.9 This is compatible with our observations in central serous chorioretinopathy (figs 3 and 4) which indicate that the level of splitting is at the tips of the photoreceptors and causes the villous processes of the RPE to be torn from the RPE cell bodies. It thus appears that the interdigitising layers of photoreceptor outer segments and RPE cells produce a distinct OCT reflection line. Corresponding findings have previously been made of an artificial serous detachment in a porcine eye using experimental ultra high resolution OCT technique.3 Additionally, patients with stage 3–4 macular holes demonstrate that only the outermost of the three high intensity layers of the RPE photoreceptor complex seen in OCT is attributable to the RPE as it presents after pathological denudation (not shown).
Impaired venous outflow results in increased transmural pressure and a reduction in blood flow (case 4). The resulting thickening of the retina and the ischaemia, as indicated by the presence of angiographic hypoperfusion and cotton wool spots, is largely reversible, as only a shallow relative scotoma was detectable after resolution. Averaged OCT images demonstrated clear evidence of selective structural damage to the inner retina, the normal layered pattern of which was absent despite the retina being of normal thickness. By comparison, the more severe ischaemia of cilioretinal artery pseudo-occlusion was associated with a better preservation of retinal layering but a significant reduction of retinal thickness (case 5) and pronounced irreversible functional deficit of the involved area.
In conclusion, OCT averaging enables recovery of detailed structural information about the retina. The non-invasive in vivo OCT image is not related to histological preparations in a straightforward manner, and the interpretation of OCT requires consideration of the specific interaction between light and tissue in the retina. Selected cases of highly localised pathological change show an excellent correlation with the known sites of injury. The method demonstrated in the present study allows upgrading of widely available clinical instrumentation.
Acknowledgments
Dr Larsen was supported by a Patient-Oriented Diabetes Research Career Award from the Juvenile Diabetes Research Foundation (grant no 8-2002-130), and L Thrane and T M Jørgensen were supported by the Danish Technical Research Council under grant 9901433 and 26-02-0020 (BIOLASE framework programme).
Abbreviations
OCT, optical coherence tomography
IS/OS, inner and outer photoreceptor segments
RNFL, retinal nerve fibre layer
RPE, retinal pigment epithelium
Financial/proprietary interest: the authors have no proprietary interest in the products mentioned in this manuscript.
REFERENCES
- 1.Drexler W, Morgner U, Ghanta RK, et al. Ultrahigh-resolution ophthalmic optical coherence tomography. Nat Med 2001;7:502–7. [DOI] [PMC free article] [PubMed] [Google Scholar]
- 2.Drexler W, Sattmann H, Hermann BK, et al. Enhanced visualization of macula pathology with the use of ultrahigh-resolution optical coherence tomography. Arch Ophthalmol 2003;121:695–706. [DOI] [PubMed] [Google Scholar]
- 3.Gloesmann M, Hermann B, Schubert C, et al. Histologic correlation of pig retina radial stratification with ultrahigh-resolution optical coherence tomography. Invest Ophthalmol Vis Sci 2003;44:1696–703. [DOI] [PubMed] [Google Scholar]
- 4.Schmitt JM, Xiang SH, Young KM. Speckle in optical coherence tomography. J Biomed Optics 1999;4:95–105. [DOI] [PubMed] [Google Scholar]
- 5.Xiang SH, Zhou L, Schmitt JM. Speckle noise reduction for optical coherence tomography. Proc SPIE 1997;3196:79–88. [Google Scholar]
- 6.Huang D . Relation of optical coherence tomography to microanatomy in normal and rd chickens. Invest Ophthalmol Vis Sci 1998;39:2405–16. [PubMed] [Google Scholar]
- 7.Hogan MJ, Alvarado JA, Weddell JE. Histology of the human eye. Philadelphia: WB Saunders, 1971.
- 8.Hageman G, Marmor M, Yao X, et al. The interphotoreceptor matrix mediates primate retinal adhesion. Arch Ophthalmol 1995;113:655–60. [DOI] [PubMed] [Google Scholar]
- 9.Yao XY, Hageman GS, Marmor MF. Retinal adhesiveness is weakened by enzymatic modification of the interphotoreceptor matrix in vivo. Invest Ophthalmol Vis Sci 1980;31:2051–8. [PubMed] [Google Scholar]
- 10.Chauhan DS, Marshall J. The interpretation of optical coherence tomography images of the retina. Invest Ophthalmol Vis Sci 1999;40:2332–42. [PubMed] [Google Scholar]
- 11.Toth CA, Narayan DG, Boppart SA, et al. A comparison of retinal morphology viewed by optical coherence tomography and by light microscopy. Arch Ophthalmol 1997;115:1425–8. [DOI] [PubMed] [Google Scholar]


