Abstract
Aims: To introduce new terminology and validate its reliability for the analysis of optical coherence tomography (OCT) scans, compare clinical detection of cystoid macular oedema (CMO) and subretinal fluid (SRF) with OCT findings, and to study the effect of photodynamic therapy (PDT) on the foveal morphology.
Methods: Patients with subfoveal, predominantly classic choroidal neovascularisation (CNV) secondary to age related macular degeneration (AMD) undergoing PDT were evaluated with refraction protocol best corrected logMAR visual acuity (VA), slit lamp biomicroscopy, stereoscopic fluorescein angiography (FFA), and OCT. New terminologies introduced to interpret the OCT scans were: neuroretinal foveal thickness (NFT), bilaminar foveal thickness (BFT), outer high reflectivity band thickness (OHRBT), intraretinal fluid (IRF), subretinal fluid (oSRF), and vitreomacular hyaloid attachment (VMHA).
Results: Fifty six eyes of 53 patients were studied. VA was better in eyes with a thinner outer high reflectivity band (OHRBT) (p = 0.02) and BFT (p = 0.05). BFT was less in eyes that had undergone a greater number of PDT treatments (p = 0.04). There was poor agreement between OCT and clinical examination in the detection of CMO and subretinal fluid (κ = 0.289 and κ = 0.165 respectively). To validate the interpretation and measurements on OCT, two groups of 20 scans were analysed by two independent observers. There was good agreement between the observers in the detection of IRF, oSRF, and VMHA (p<0.001). Measurements of NFT and BFT had a high reproducibility, and of OHRBT reproducibility was low.
Conclusions: New terminology has been introduced and tested. OCT appears to be superior to clinical examination and FFA in the detection of CMO. In this study, better vision was associated with a thinner OHRBT and/or the absence of SRF giving insight into the biological effect of PDT.
Age related macular degeneration (AMD) is a leading cause of registerable blindness in the developed world in people over the age of 65 and subfoveal choroidal neovascularisation (CNV) is the major cause of severe visual loss.1–3 The Treatment of AMD with Photodynamic therapy (TAP) study 4,5 reported a reduction in visual loss in subfoveal predominantly classic CNV.
Routine methods of assessing macular morphology, including fluorescein angiography (FA) and slit lamp biomicroscopy, allow only limited evaluation of the three dimensional relation between the CNV and retinal pigment epithelium.
Optical coherence tomography (OCT) is a relatively new tool and its role in the assessment of AMD has yet to be fully established in clinical practice. Fukuchi et al6 and Toth et al7 have demonstrated that the pseudocolour banding of retinal OCT images correlates well with histology. To date the literature has been descriptive and qualitative, concentrating on the detection of intraretinal and subretinal fluid8,9,10 and the assessment of vitreomacular traction.11 Objective measures from OCT images in AMD have yet to be developed or validated.
In our study we used the Zeiss Optical Coherence Tomographer Model 3000 (OCT3) (Zeiss-Humphrey, Dublin, CA, USA) to study the retinal morphology in patients with AMD undergoing photodynamic therapy (PDT) with the following aims: (1) to develop a relevant descriptive terminology to analyse OCT scans; (2) to test its reproducibility between observers; (3) to analyse clinical findings compared with OCT, and (4) to study the effect of PDT on the foveal morphology in patients with subfoveal CNV secondary to AMD using OCT in order to relate findings to the number of applications of PDT.
PATIENTS AND METHODS
This was a non-randomised prospective cross sectional study of eyes with predominantly classic subfoveal CNV secondary to AMD attending the St Paul’s Clinical Eye Research Centre. All patients underwent refraction and visual acuity measurement using TAP protocol. The Early Treatment Diabetic Retinopathy Study (ETDRS) chart (Lighthouse Television Products, NY, USA) was used. Best corrected visual acuity was measured at 2 m. The score was the total number letters read correctly plus 15. If the patients saw fewer than 20 letters, they were tested with the top three lines at 1 m. The score then was the total number of letters read at 2 m plus the number of letters read at 1 m. Clinical and fundus fluorescein angiography (FFA) evaluation was by a retina specialist or a fellow experienced in clinical studies. The presence or absence of cystoid macular oedema (CMO) and subretinal fluid (SRF) was determined on slit lamp biomicroscopy using a 60 dioptre Volk (Volk Opticals, Mentor, OH, USA) lens and a standard Mainster (Ocular Intruments Inc, Bellevue, USA) contact lens with 1.5 magnification and on FFA by interpretation of 10 minute late frames. Patients with CNV secondary to non-AMD aetiologies were excluded.
OCT was performed and analysed by a single observer (JS) on the OCT3 masked to visual acuity (VA) clinical and FFA findings. All scans were performed prior to FFA and slit lamp biomicroscopy. Pupils were dilated with tropicamide (1%) and phenylephrine (2.5%) drops. Internal fixation guided by the video image was used to ensure that scans passed through the fovea. Scans that did not pass through the fovea were excluded. Horizontal single line A scans through the fovea of default length 5 mm at 0° and a fast macular thickness map consisting of six simultaneous 6 mm radial line scans were obtained. With each single line scan pass, 512 longitudinal range samples were captured—each consisting of 1024 data points over 2 mm of depth, giving 524 288 data points, which are integrated to construct a cross sectional anatomical image (tomogram). In cases with poor central fixation, the scan was manually positioned on the anatomical fovea as viewed on the black and white video image.
All thickness measurements were made on the single line horizontal scans. The measurements were done by manual positioning of the callipers using the retinal thickness (single eye) quantitative analysis protocol offered by Stratus OCT3.
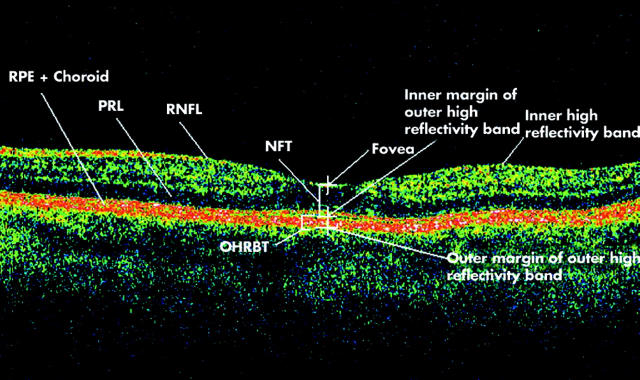
New terminology was defined and used in interpreting OCT images as shown in table 1 and figures 1, 2, and 3. The foveal centre was defined as the maximum depression within the depression or pit within the neuroretina12 and the fovea was defined as the surrounding area, the diameter of which was 500 μm. Measurements were obtained from acquired scans using these definitions and compared against clinical observations. Scans were also studied for features which could confound the interpretation and measurement of the images.
Table 1.
Terms and definitions used within this paper
| Term | Definition |
| Neuroretinal foveal thickness (NFT) | Distance between the inner high reflectivity band and the inner margin of the outer high reflectivity band at the foveal centre |
| Bilaminar foveal thickness (BFT) | Distance between the inner high reflectivity band and the inner margin of the outer high reflectivity band at the foveal centre in the presence of subretinal hyporeflective space at the fovea |
| Outer high reflectivity band thickness (OHRBT) | Distance between the inner margin of the outer high reflectivity band and the outer margin of the outer high reflectivity band at the fovea |
| Vitreomacular hyaloid attachment (VMHA) | Incomplete separation of the posterior hyaloid with attachment at the macula in the OCT scan |
| Posterior vitreous detachment (PVD) | Complete separation of the posterior hyaloid from the macula in the OCT scan |
| Intraretinal fluid (IRF) | Well defined intraretinal hyporeflective spaces at the fovea separated by reflective septae |
| Subretinal fluid (oSRF) | Separation of the neuroretina from the outer high reflectivity band by a well defined hyporeflective space at the fovea |
Figure 1.
Optical coherence tomogram passing through the fovea of a normal eye illustrating retinal layers and terminology developed for the study. RNFL, retinal nerve fibre layer; PRL, photoreceptor layer; RPE, retinal pigment epithelium; NFT, neuroretinal foveal thickness (distance between inner high reflectivity band and inner margin of outer high reflectivity band at foveal centre); OHRBT, outer high reflectivity band thickness; NFT = 181 μ and OHRBT = 58 μ in this scan.
Figure 2.
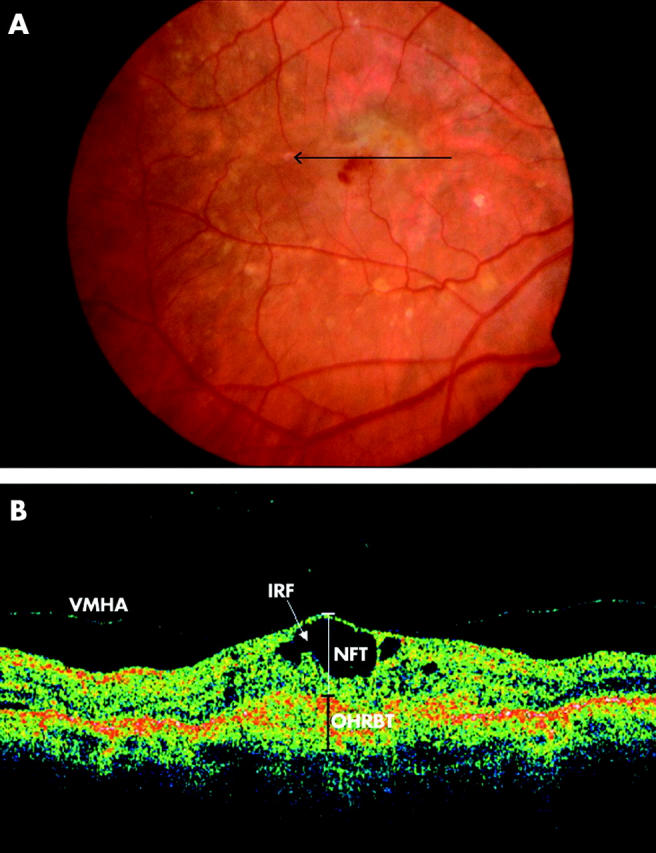
(A) Colour fundus photograph of the right eye of an 83 year old male patient demonstrates a green-grey subfoveal lesion with haemorrhage. The arrow indicates the location and direction of the optical coherence tomographic (OCT) scan. (B) OCT image demonstrates loss of foveal depression with cystoid spaces and vitreoretinal hyaloid attachment. NFT, neuroretinal foveal thickness; OHRBT, outer high reflectivity band; IRF, intraretinal fluid. NFT = 406 μm and OHRBT = 307 μ in this scan.
Figure 3.
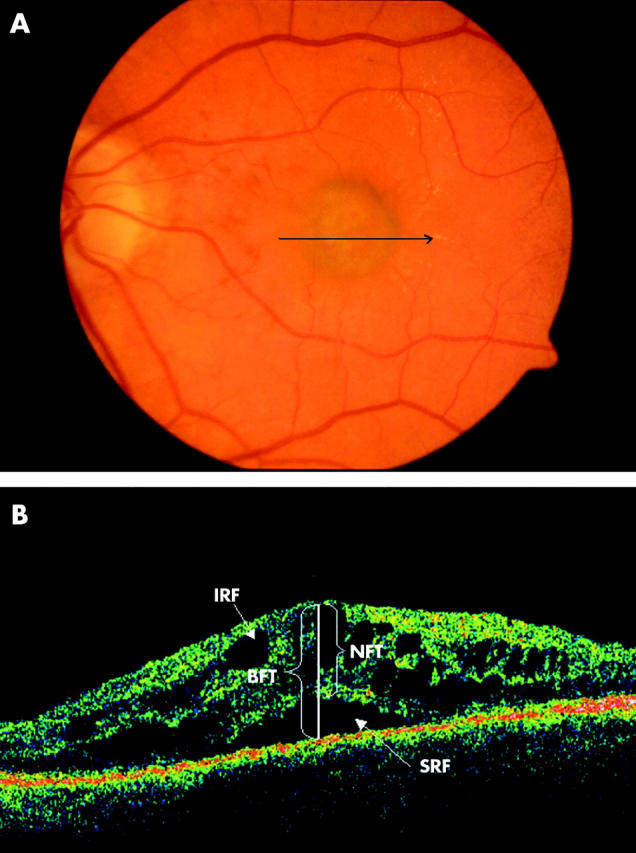
(A) Colour fundus photograph of the left eye of a 54 year old female patient shows a subfoveal green-grey lesion with minimal haemorrhage. The arrow indicates the location and direction of the optical coherence tomographic (OCT) scan. (B) OCT passing through the fovea illustrating bilaminar foveal thickness (BFT), intraretinal fluid (IRF), and subretinal fluid (SRF). BFT is the distance between the inner high reflectivity band and the inner margin of the outer high reflectivity band at the foveal centre in the presence of subretinal hyporeflective area. NFT = 473 μ and BFT = 722 μ in this scan.
Validation
Two groups of 20 scans of patients with subfoveal predominantly classic CNV secondary to AMD were analysed by two groups of independent observers. For each horizontal 5 mm line scan, each observer independently recorded the presence or absence of IRF, oSRF, and VMHA and measured NFT, BFT, and OHRBT by manual positioning of the callipers.
Statistics
Statistical analysis of the data was performed using SPSS for windows version 11.0 (SPSS Inc, Chicago, IL, USA). Intraclass correlation coefficient (ICC) was used as a measure of reliability between the observers for the validation study. To obtain the standard deviation of the differences between the 20 pairs of measurements by the observers, we squared all the differences, added them up, divided by 20 and took the square root.
The relation between NFT, BFT, and OHRBT respectively with VA was analysed using the Pearson correlation coefficient. Agreement between clinical examination and OCT in the detection of CMO and SRF were investigated on 2×2 tables and kappa statistic (κ) was calculated. A p value of ⩽0.05 was taken to be significant.
VALIDATION RESULTS
Forty eyes of 40 patients (not included in the cross sectional study) with subfoveal predominantly classic CNV undergoing PDT were divided into two groups of 20 each. Observer 1 and observer 2 analysed group 1 and observer 1 and observer 3 analysed group 2.
For observer 1 and observer 2: the ICC for NFT was 0.98 with an interobserver standard deviation of 14.33 μ; for BFT, ICC was 0.98 (SD 21.3) μ and for OHRBT the ICC was 0.76 (SD 46.74) μ. The ICC for IRF was 0.87 (p<0.001). For SRF there was high repeatability (ICC = 1, p<0.001) and for VMHA the ICC was 0.75 (p<0.001)
For observer 1 and observer 3: the ICC for NFT was 0.97 with an interobserver SD of 17 μ; for BFT, ICC was 0.97 (SD 23.5) μ and for OHRBT the ICC was 0.93 (SD 28.8) μ. The ICC for IRF was 0.73 (p<0.001). For SRF the ICC was 0.73 (p<0.001) and for VMHA there was high repeatability (ICC = 1, p<0.001).
RESULTS
Sixty eight eyes of 65 patients attending St Paul’s Eye Unit, Royal Liverpool University Hospital between August 2002 and February 2003 were recruited. Twelve eyes (17%) were excluded, as scans passing through the fovea could not be obtained due to erratic and inaccurate fixation leaving 56 eyes for analysis. The median age was 76 years. Mean duration since baseline visit was 9.5 months (range 0 to 30; 24 males, 32 females). Three patients were scanned at baseline prior to receiving any treatment. Sixteen had undergone one PDT treatment application, 11 had two, 10 had three, six had four, nine had five, and one patient had seven treatment applications prior to the OCT scanning.
IRF was found in 23 (42%) eyes on OCT imaging and CMO was found in 13 (23%) eyes in the same group on slit lamp clinical examination. Κappa was 0.29 signifying a poor agreement between the two tests. There was poor agreement between slit lamp biomicroscopy and OCT in the detection of SRF (κ = 0.17).
There was no significant difference in the distance VA in eyes with and without IRF at the fovea (p>0.5).
The mean NFT was significantly greater in patients with IRF at 223 μm compared with those without at 154 μm (p = 0.005). There was no correlation between the NFT and VA (p>0.5) and NFT and the number of PDT applications (r = −0.23, p>0.05).
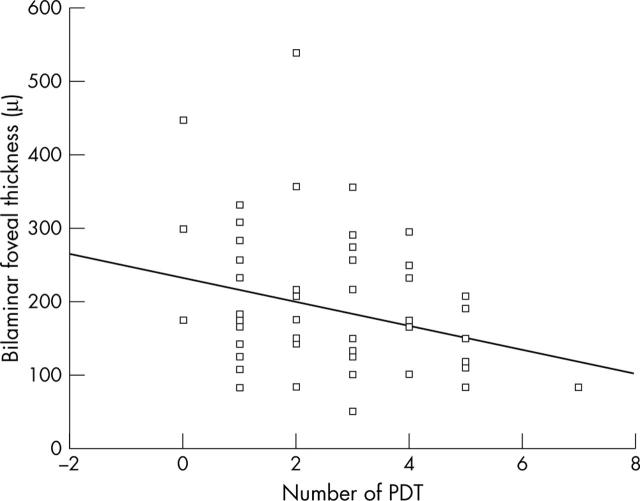
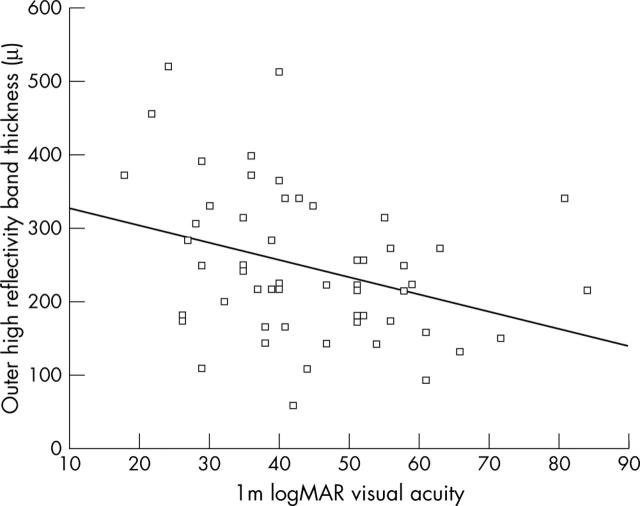
The correlation between BFT and VA was significant (p = 0.05). There was a statistically significant correlation between BFT and the number of PDT applications (r = −0.28; p = 0.04) (fig 4). TAP protocol VA was significantly better in eyes with a thinner OHRBT (fig 5) (r = −0.331; p = 0.013). A VMHA was present in 20/56 patients (35.7%). No statistically significant association was found between IRF and VMHA (p = 0.4).
Figure 4.
Relationship between bilaminar foveal thickness (BFT) and number of PDT application in 56 eyes. The linear regression line is y = −15.928x+231.14 (r = −0.275, p = 0.04).
Figure 5.
Relation between visual acuity (logMAR letters) units plotted against outer high reflectivity band (OHRBT) in μm in 56 eyes. The linear regression line is y = −2.3352x+350.58 (r = −0.331, p = 0.02).
New observations were made from the scans in these patients. In some cases with atrophy of the retinal pigment epithelium (RPE) (on slit lamp or FFA) an optical shadow was present interfering with the identification of the outer border of the OHRBT. In cases with a large amount of intraretinal or subretinal fluid or haemorrhage, signal attenuation appears to reduce the apparent OHRBT.
DISCUSSION
Optical coherence tomography8,10 is a relatively new technique for cross sectional imaging of the retina. To date, the published literature has been descriptive and definitions of clinical relevance have not been defined.9 In our study we used the most recent OCT model with higher data sampling than in previously published reports and have developed specific terms for future use in clinical studies.
In the previous literature there has been no definition to describe the thickness of the central fovea. Firstly, therefore, we defined the centre of the anatomical fovea and went on to define two measures of foveal thickness—BFT and NFT—to allow distinction between measures, depending on the presence or absence respectively of subretinal hyporeflectivity on OCT.
In our study we have used the term IRF for describing well delineated hyporeflective spaces separated by reflective septae within the neuroretina. Otani et al have described two distinct OCT appearances of macular oedema in diabetes under the terms “cystoid macular oedema” and “sponge-like retinal swelling”.13 The use of an OCT system providing fewer data points per scan could have influenced the tomographic appearance of the intraretinal fluid in their study. We found considerable interobserver variability in the detection of the second of these terms and believe that an increase in NFT in the absence of IRF may be taken as evidence of diffuse retinal swelling.
We have introduced the term OHRBT to measure the thickness of the subretinal hyperreflectivity at the fovea. Finally we have introduced the term VMHA to describe when partial separation of the posterior hyaloid with attachment at the macula was noted on the OCT. We avoided calling this “traction”, as tractional forces cannot be measured with OCT.
As OCT becomes more widely available, debate continues on the relevance and reliability of the images produced. The usefulness of the instrument depends on the reproducibility of its measurements and the ability of the observers to agree on the interpretation of the results. In the validation study, reproducibility of the neuroretinal thickness and bilaminar foveal thickness had high ICCs and low standard deviations, which are essential for accurate and reliable measurements of retinal thickness. OHRBT reproducibility was lower, with lower ICC and higher SD in both groups of observers. This high variability may be because of the difficulty in identification of the true outer margin of the outer high reflectivity band. There was good agreement between the observers in the detection of IRF, oSRF, and VMHA (p<0.001).
For OCT to be meaningful in macular disease, scans must pass through the anatomical centre of the fovea, especially if measurements are to be compared with VA. In our study 12 (17%) of 68 eyes could not be reliably scanned through the fovea. Reliability of scans was limited by poor fixation, excessive eye movements, and difficulty identifying the true location of the fovea because of morphological changes caused by disease. Two other studies have reported on the difficulty of obtaining scans. Hee et al14 failed to obtain adequate scans in 4.2% of the study population, comprising mainly patients with diabetes with moderate to good VA (better than 20/80). Rogers et al15 reported a higher percentage (12.2%) of scans to be unobtainable/unreliable in a population of patients with AMD, a result more similar to ours but still lower. Unlike these authors our population was consecutive, often with quite low levels of vision and poor fixation, and accounting for a 17% exclusion rate: the mean VA score was 42 letters (roughly equivalent to 20/120) and scans that did not pass through the foveal centre were excluded. This significant failure rate raises the question of reliability and suitability of OCT as an objective means of measuring and monitoring retinal thickness at the fovea in some patients.
All measurements in our study were obtained by manual positioning of the callipers. Hee et al14 obtained retinal thickness measurements automatically by means of a computer algorithm that searches for the changes in reflectivity observed at the superficial and deep retinal boundaries. We therefore tested the algorithm that is supplied within the software suite of the OCT 3000. In most cases it failed to distinguish between the detached posterior hyaloid and the true inner high reflectivity band corresponding to the inner retinal border. In the presence of a subretinal hyporeflective space, the algorithm usually misread the true NFT. We believe that manual calliper placement currently remains the method of choice.
In the clinical management of AMD the detection of CMO and SRF is important. Bressler et al16 have commented on the difficulty of correctly identifying leakage due to CNV in the presence of coexisting CMO, which can confound interpretation of FFA images. FFA and slit lamp biomicroscopy are the standard examinations used for the diagnosis of CNV in patients with AMD and these examinations are relatively insensitive at detecting small changes in retinal thickness.17 Hee et al14 reported that slit lamp biomicroscopy was unreliable in detecting an increase in thickness smaller than 250 μm in diabetic macular oedema. Browning et al18 calculated κ to be 0.63 in their cohort of diabetics for the agreement between slit lamp biomicroscopy and OCT in the detection of macular oedema. In our study OCT detected IRF in more than 50% of patients in whom CMO was not seen on slit lamp biomicroscopy. The agreement between the two methods was much less in our study, κ = 0.29. This may be because the majority of our patients had undergone previous PDT making clinical interpretation difficult. There was also poor agreement between the two methods in the detection of SRF (κ = 0.165). The presence/absence of leakage is integral to retreatment decision making during a course of PDT.19 With OCT, a new standard for assessment of CMO and SRF have been set, which is more objective than slit lamp biomicroscopy and fluorescein angiography.
Studying the relation between VA and retinal thickness/fluid is important in increasing the understanding of retinal pathophysiology in exudative maculopathies. The presence of CMO has been reported to be associated with poorer VA in neovascular AMD.20 However in our study of patients with AMD who had undergone PDT, there was no statistically significant association between the presence or absence of IRF and SRF and VA. We could not show a statistically significant association between VA and NFT or BFT. This could be because other factors such as the baseline VA and size of CNV may also affect the final VA. Using OCT, we have shown that a higher number of PDT treatments are associated with lower BFT. This observation needs further investigation in longitudinal studies but does suggest that OCT imaging may be helpful. We are currently undertaking a study to develop a new set of retreatment criteria taking these findings into consideration.
Previous studies6,7 have shown that the outer high reflectivity band corresponds to the RPE and choriocapillaris. Hee et al21 categorised untreated CNV on OCT tomograms as well defined, poorly defined, or as a fibrovascular PED. In our experience these characteristics were lost following PDT. We found a statistically significant inverse association between the RPE-CNV complex thickness, defined in our study as OHRBT, and VA. The suggestion from our study is that in addition to the recognised anti-angiogenic effect,22,23 PDT may preserve VA in patients with AMD by modifying the natural history of the scarring process,24 which in turn prevents photoreceptor loss. There was no association between the OHRBT and the number of PDT treatments or the duration since initial treatment. Measurement of OHRBT appears to have some limitations, as the absorption and scattering properties of fluid and fibrosis can attenuate the OCT signal. In contrast, RPE/choroidal atrophy can intensify the transmission of the light and might result in a thicker OHRBT measurement.
Vitreomacular traction has been implicated in the progression of diabetic maculopathy.25 We looked at the pattern of vitreous interaction with the retinal surface at the fovea. VMHA was present in 20 patients, but we did not find a statistically significant correlation between CMO and VMHA. We propose that in AMD disruption of RPE metabolism by the associated CNV is responsible for changes in the retinal architecture as opposed to vitreomacular traction (as has been implicated in other conditions).11
A limitation of this study is that scans were not possible in 17% of our patient population, because of poor vision and fixation. Although we have taken great care to accurately delineate the outer high reflectivity band, errors in measuring true RPE-CNV thickness may have arisen because of light attenuation or amplification properties of the tissue. Although we have only sought correlations between vision and OCT features, baseline VA, diameter of the CNV, presence of fibrosis, atrophy, and blood may have also influenced the VA results.
Power calculations were not performed as there were no preliminary data on which to base them. In any future studies our data will be useful to perform power calculations in this specific population.
Our study shows that OCT can be a useful technique for quantitative retinal measurements in patients undergoing PDT. We were able to show that VA was better in those patients with an absence of SRF following PDT. We also showed that the favourable visual outcome following PDT might be associated with a thinner OHRBT. Thus OCT and the terminology we have developed appears to be useful in evaluating the response of the retina and can aid in interpreting the FFA when evaluating the activity of CNV treated with PDT. Further prospective longitudinal studies are needed to establish retreatment criteria based on these findings, and may improve the efficacy and cost effectiveness of PDT.
Acknowledgments
This study was presented in part as a poster at the annual meeting of the Association for Research in Vision and Ophthalmology, Fort Lauderdale, FL, USA, May 2003. The authors do not have any commercial or proprietary interest in the OCT model 3000 (Zeiss-Humphrey, USA). The authors are grateful to the staff of the Clinical Eye Research Centre at St Paul’s Eye Unit, Liverpool for their help with the study.
Abbreviations
AMD, age related macular degeneration
BFT, bilaminar foveal thickness
CMO, cystoid macular oedema
FFA, fundus fluorescein angiography
ICC, intraclass correlation coefficient
IRF, intraretinal fluid
NFT, neuroretinal foveal thickness
OCT, optical coherence tomography
OHRBT, outer high reflectivity band thickness
PDT, photodynamic therapy
RPE, retinal pigment epithelium
SRF, subretinal fluid
TAP, Treatment of AMD with Photodynamic therapy study
VA, visual acuity
VMHA, vitreomacular hyaloid attachment
REFERENCES
- 1.Klein R, Klein BE, Linton KL. Prevalence of age-related maculopathy: the Beaver Dam Eye Study. Ophthalmology 1992;99:933–43. [DOI] [PubMed] [Google Scholar]
- 2.Vingerling JR, Dielemans I, Hofman A, et al. The prevalence of age-related maculopathy in the Rotterdam study. Ophthalmology 1995;102:205–10. [DOI] [PubMed] [Google Scholar]
- 3.Bressler NM, Bressler SB, Fine SL. Age-related macular degeneration. Surv Ophthalmol 1988;32:375–413. [DOI] [PubMed] [Google Scholar]
- 4.TAP study group. Photodynamic therapy of subfoveal choroidal neovascularisation in age-related macular degeneration with verteporfin: one-year results of 2 randomised clinical trials. TAP report 1. Arch Ophthalmol 1999;117:1329–45. [PubMed] [Google Scholar]
- 5.Bressler NM, TAP study group. Photodynamic therapy of subfoveal choroidal neovascularisation in age-related macular degeneration with verteporfin: two-year results of 2 randomised clinical trials. TAP report 2. Arch Ophthalmol 2001;119:198–207. [PubMed] [Google Scholar]
- 6.Fukuchi T, Takahashi K, Uyama M, et al. Comparative study of experimental choroidal neovascularisation by optical coherenece tomography and histopathology. Jpn J Ophthalmol 2001;45:252–8. [DOI] [PubMed] [Google Scholar]
- 7.Toth CA, Narayan DG, Boppart SA, et al. A comparison of retinal morphology viewed by optical coherence tomography and by light microscopy. Arch Ophthalmol 1998;115:1425–8. [DOI] [PubMed] [Google Scholar]
- 8.Hee MR, Izatt JA, Swanson EA, et al. Optical coherence tomography of the human retina. Arch Ophthalmol 1995;113:325–32. [DOI] [PubMed] [Google Scholar]
- 9.Montero JA, Ruiz-Moreno JM, Tavolato M. Follow-up of age-related macular degeneration patients treated by photodynamic therapy with optical coherence tomography 3. Graefes Arch Clin Exp Ophthalmol 2003;241:797–802. [DOI] [PubMed] [Google Scholar]
- 10.Puliafito CA, Hee MR, Lin CP, et al. Imaging of macular diseases with optical coherence tomography. Ophthalmology 1995;102:217–29. [DOI] [PubMed] [Google Scholar]
- 11.Gallemore RP, Jumper JM, McCuen BM 2nd, et al. Diagnosis of vitreoretinal adhesions in macular disease with optical coherence tomography. Retina 2000;20:115–20. [PubMed] [Google Scholar]
- 12.Fine BS, Yanoff M. Ocular histology. A text and atlas. 2nd edition. Hagerstown: Harper & Row, 1979:61–127.
- 13.Otani T, Kishi S, Mauyama Y. Patterns of diabetic macular edema with optical coherence tomography. Am J Ophthalmol 1999;127:688–93. [DOI] [PubMed] [Google Scholar]
- 14.Hee MR, Puliafito CA, Wong C, et al. Quantitative assessment of macular edema with optical coherence tomography. Arch Ophthalmol 1995;113:1019–29. [DOI] [PubMed] [Google Scholar]
- 15.Rogers AH, Martidis A, Greenberg PB, et al. Optical coherence tomography findings following photodynamic therapy of choroidal neovascularisation. American J Ophthalmol 2002;134:566–76. [DOI] [PubMed] [Google Scholar]
- 16.Bressler NM, Bressler SB, Alexander J, et al. MPS reading center. Loculated fluid: a previously undescribed fluorescein angiographic finding in choroidal neovascularisation associated with macular degeneration, Arch Ophthalmol 1991;109:211–15. [DOI] [PubMed] [Google Scholar]
- 17.Shahidi M, Ogura Y, Blair NP, et al. Retinal thickness analysis for quantitative assessment of diabetic macular edema. Arch Ophthalmol 1991;109:1115–19. [DOI] [PubMed] [Google Scholar]
- 18.Browning DJ, McOwen MD, Bowen RM, et al. Comparison of the clinical diagnosis of diabetic macular edema with diagnosis by optical coherence tomography. Ophthalmology 2004;111:712–15. [DOI] [PubMed] [Google Scholar]
- 19.Harding S. Photodynamic therapy in the treatment of subfoveal choroidal neovascularisation. Eye 2001;15:407–12. [DOI] [PubMed] [Google Scholar]
- 20.Ting TD, Cox TA, Meyer CH, et al. Decreased visual acuity associated with cystoid macular edema in neovascular age-related macular degeneration. Arch Ophthalmol 2002;120:731–7. [DOI] [PubMed] [Google Scholar]
- 21.Hee MR, Baumal CR, Puliafito CA, et al. Optical coherence tomography of age-related macular degeneration and choroidal neovascularisation. Ophthalmology 1996;103:1260–70. [DOI] [PubMed] [Google Scholar]
- 22.Ghazi NG, Jabbour NM, De La Cruz ZC, et al. Clinicopathologic studies of age-related macular degeneration with classic subfoveal choroidal neovascularization treated with photodynamic therapy. Retina 2001;21:478–86. [DOI] [PubMed] [Google Scholar]
- 23.Schlotzer-Schrehardt U, Viestenz A, Naumann GO, et al. Dose-related structural effects of photodynamic therapy on choroidal and retinal structures of human eyes. Graefes Arch Clin Exp Ophthalmol 2002;240:748–57. [DOI] [PubMed] [Google Scholar]
- 24.Green WR, Enger C. Age related macular degeneration histopathologic studies: the 1992 Lorenz E Zimmerman Lecture. Ophthalmology 1993;100:1519–35. [DOI] [PubMed] [Google Scholar]
- 25.Giovannini A, Amato GP, Mariotti C, et al. Diabetic maculopathy induced by vitreo-macular traction: evaluation by optical coherence tomography (OCT). Doc Ophthalmol 1999;97:361–6. [DOI] [PubMed] [Google Scholar]


