Abstract
Aim: To evaluate the influence of clear cornea phacoemulsification on filtering bleb morphology, function, and intraocular pressure (IOP) in glaucomatous eyes with previously successful filtering surgery.
Methods: The clinical course of 30 patients (30 eyes) who underwent clear cornea phacoemulsification after successful filtering glaucoma surgery was prospectively evaluated. Mean IOP and filtering bleb morphology (standardised assessment criteria and score 0–12, 12 = optimum) were determined before surgery, and 3 days, 6 months, and 12 months after surgery. The control group consisted of 36 patients with glaucoma after clear cornea phacoemulsification without previous filtering surgery.
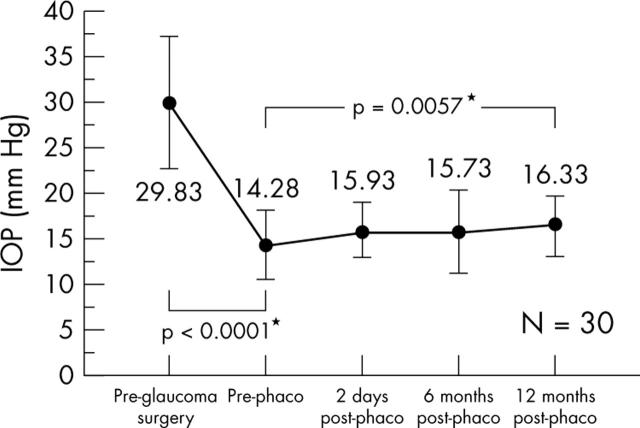
Results: Mean IOP increased after phacoemulsification by about 2 mm Hg (preoperatively 14.28 (SD 3.71) mm Hg, 12 months postoperatively 16.33 (3.31) mm Hg, p = 0.006). 15 patients (50%) showed an IOP increase of >2 mm Hg, 11 patients (36.7%) had no IOP difference (within 2 mm Hg), and in four patients (13.3%) IOP decreased >2 mm Hg. Mean score of filtering bleb morphology 1 year after surgery decreased from 9.5 to 9.0 (p = 0.154). In three of 30 preoperatively IOP regulated eyes the postoperative IOP was 21 mm Hg. The control group showed an average IOP decrease of 2.01 mm Hg (p = 0.014) 12 months after cataract surgery.
Conclusion: An increase in IOP was found 1 year after phacoemulsification in half of the filtered glaucomatous eyes. IOP in glaucomatous eyes without previous filtering surgery decreased in the same period. Cataract extraction using clear cornea phacoemulsification may be associated with a partial loss of the previously functioning filter and with an impairment of filtering bleb morphology.
Keywords: phacoemulsification, intraocular pressure
Cataract formation may be accelerated by filtering surgery especially in eyes with postoperative hypotony, flat anterior chamber, or excessive inflammation.1,2 It has been reported that cataract surgery can compromise the function of the filtering bleb, resulting in loss of intraocular pressure (IOP) control.1,3,4 In a number of retrospective studies a rise of IOP after extracapsular cataract extraction1,5–7 and even after phacoemulsification1,6,7 in filtered glaucoma eyes was shown.
Our goal was to prospectively investigate the influence of clear cornea phacoemulsification on filtering bleb morphology, function and intraocular pressure in glaucoma eyes with previously successful filtering surgery.
METHODS
A prospective and controlled study was designed to include 66 eyes of 66 patients with chronic open angle (high pressure) glaucoma and visual acuity limiting cataract before phacoemulsification. Thirty patients had previously undergone a successful glaucoma filtering surgery with controlled IOP ⩽21 mm Hg (bleb group), when additional glaucoma medication was allowed. Thirty six patients with open angle glaucoma controlled by medication had had no glaucoma surgery before (control group). We included one eye of each patient. Patients with low tension glaucoma and angle closure glaucoma were excluded.
Ophthalmological examination consisted of best corrected visual acuity, Goldmann applanation tonometry at least three measurements distributed over daytime, a detailed slit lamp examination of the filtering bleb using standardised criteria,8,9 and filtering bleb photography. The following morphological criteria were evaluated: vascularisation, corkscrew vessels, microcysts, encapsulation, and bleb elevation (table 1). We created a score (0–12) for a semiquantitative analysis of the bleb. A high bleb score (12 = optimum) indicates a “favourable,” functioning filtering bleb. The bleb elevation was calculated separately using equivalents of corneal thickness for quantification. Patients were examined before phacoemulsification, between the first and fourth postoperative day, 6 months, and 12 months postoperatively.
Table 1.
Standardised filtering bleb classification and bleb score
| Vascularisation | 0 = avascular | 0, 0–1 | 3 points |
| 1 = equal to surrounding conjunctiva | 1, 1–2 | 2 points | |
| 2 = enhanced | 2 | 1 point | |
| 3 = massive | 3 | 0 point | |
| Screw vessels | 0 = no | 0 | 3 points |
| 1 = in 1 third | 0–1 | 2 points | |
| 2 = in 2 third parts | 1 | 1 point | |
| 3 = in whole bleb | 2, 3 | 0 point | |
| Microcyts | 0 = no | 0 | 0 point |
| 1 = above scleral flap | 0–1, 1 | 1 point | |
| 2 = at one side | 1–2, 2 | 2 points | |
| 3 = in whole bleb | 2–3, 3 | 3 points | |
| Encapsulation | 0 = no | 0 | 3 points |
| 1 = in 1 third | 1 | 2 points | |
| 2 = in 2 third parts | 2 | 1 point | |
| 3 = in whole bleb | 3 | 0 point |
Cataract surgery was performed by three surgeons (FG, JS, WL) by phacoemulsification via temporal clear cornea incision with implantation of a foldable lens (Acrysof IOL Model MA60BM, Rayner Model 574R, and Memory lens IOL Model U940A) into the capsular bag.
Statistical analysis
The Wilcoxon test was used for longitudinal comparison of intraindividual IOPs, visual acuity, number of glaucoma medications, and changes in bleb morphology. Linear regression analysis was performed to investigate the influence of the interval between glaucoma and cataract surgery on IOP outcome and the relation between IOP and bleb score. Comparisons between bleb and control group were performed by using Mann-Whitney U test, Meta/Patel, test and contingency table. A p value of 0.05 or less was considered statistically significant.
StatView (SAS Institute Inc, USA) and MEDAS (Grund Company EDV-Systems, Germany) were used for statistical analysis.
RESULTS (TABLE 2)
Table 2.
Demographic data, glaucoma diagnosis, additional interventions, and complications
| Bleb group | Control group | p Value | |
| Patients/eyes | 30 | 36 | |
| Female/male | 17/13 | 21/15 | 0.86 (A) |
| Mean age (years) | 70.6 (8.5) | 76.2 (6.8) | 0.19 (B) |
| Range | 49.7–84.5 | 57.3–86.1 | |
| Glaucoma diagnosis | |||
| Primary open angle glaucoma | 22 (73%) | 26 (72%) | 0.82 (A) |
| Pseudoexfoliation | 7 (23%) | 10 (28%) | |
| Secondary glaucoma (uveitis) | 1 (3%) | 0 | |
| Glaucoma surgery | |||
| Trabeculectomy (Cairns) | 24 (80%) | ||
| With antimetabolites | 6 | ||
| Mitomycin C (intraoperatively) | 1 | ||
| 5-Fluorouracil (intraoperatively) | 3 | ||
| 5-Fluorouracil (postoperatively) | 2 | ||
| 5-Fluorouracil without antimetabolites | 18 | ||
| Goniotrephination (without antimetabolites) | 6 (20%) | ||
| Time between glaucoma surgery and phaco | 5.8 (6.2) years | ||
| Range | 3 months–19.7 years | ||
| Phacoemulsification | |||
| Additional manipulation: | |||
| Synechiolysis | 15 | 10 | 0.14 (A) |
| Iris retractors | 9 | 5 | |
| Capsule tension ring | 0 | 2 | |
| Intraoperative complication: | |||
| Posterior capsular tear with vitreous loss | 1 | 0 | |
| Zonulolysis | 1 | 0 | |
| Postoperative complication: | |||
| Fibrin reaction | 2 | 5 | |
| Hyphaema | 1 | 0 |
A = Meta/Patel test.
B = Mann-Whitney U test.
Bleb group
The mean IOP of the filtering bleb group increased after phacoemulsification by 2.05 (SD 4.2) mm Hg within 1 year (preoperatively 14.28 (3.71) mm Hg, 1-4 days postoperatively 15.93 (2.68) mm Hg, 6 months postoperatively 15.73 (4.12) mm Hg, 12 months postoperatively 16.33 (3.31) mm Hg, p = 0.0057, fig 1 and fig 3).
Figure 1.
Mean intraocular pressure (IOP) of glaucomatous eyes with previous glaucoma surgery after phacoemulsification (bleb group). *Significant p<0.05.
Figure 3.
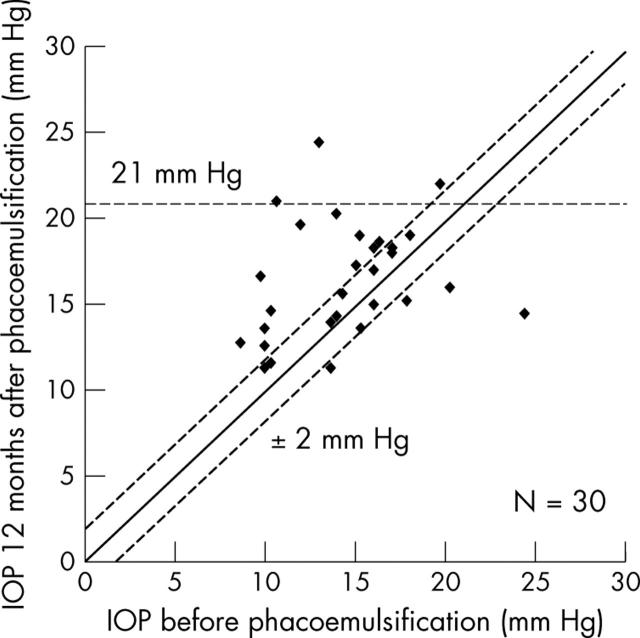
Scattergram of individual intraocular pressures (IOP) before and 12 months after phacoemulsification (bleb group).
In 15 patients (50%) the IOP increased by >2 mm Hg, 11 patients (36.7%) had no IOP difference (SD 2 mm Hg), and in four patients (13.3%) IOP decreased >2 mm Hg within 1 year.
In three of 30 preoperatively IOP regulated eyes the postoperative IOP was ⩾21 mm Hg.
One patient required cyclophotocoagulation 9 months after phacoemulsification because of a persistent IOP increase.
There was no significant difference of IOP outcome between patients who received antimetabolites during or after glaucoma surgery and those who did not. The IOP before phacoemulsification in patients who previously had glaucoma surgery with antimetabolites (n = 6) was 14.0 (3.4) mm Hg and 17.3 (4.2) mm Hg after 12 months. The IOP before phacoemulsification in patients who previously had glaucoma surgery without antimetabolites (n = 24) was 14.3 (3.8) mm Hg and 16.1 (3.1) mm Hg after 12 months (p = 0.22).
There was no significant correlation between the IOP change and the time between glaucoma and cataract surgery (preoperative versus 12 months after cataract surgery, calculated with linear regression analysis, R2 = 0.002, p = 0.806 ANOVA).
Control group
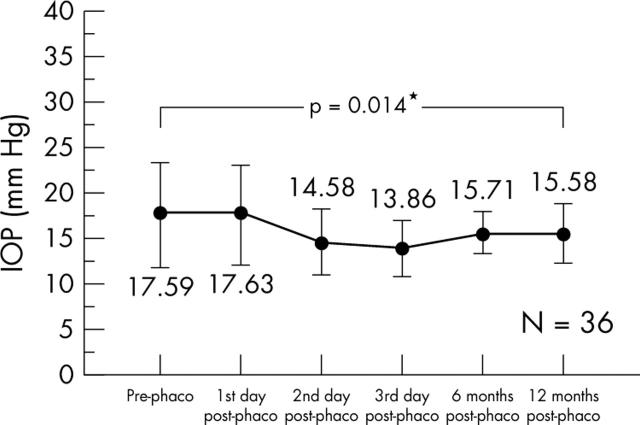
The control group showed an average IOP decrease of 2.01 mm Hg (p = 0.014) 12 months after cataract surgery. The mean IOP before surgery was 17.59 (5.26) mm Hg, 17.63 (5.02) mm Hg on the first postoperative day, 14.58 (3.17) mm Hg on the second postoperative day, 15.71 (2.19) mm Hg 6 months postoperatively, and 15.58 (3.15) mm Hg 12 months postoperatively (figs 2 and 4).
Figure 2.
Mean intraocular pressure (IOP) of glaucomatous eyes without previous glaucoma surgery after phacoemulsification (control group). *Significant p<0.05.
Figure 4.
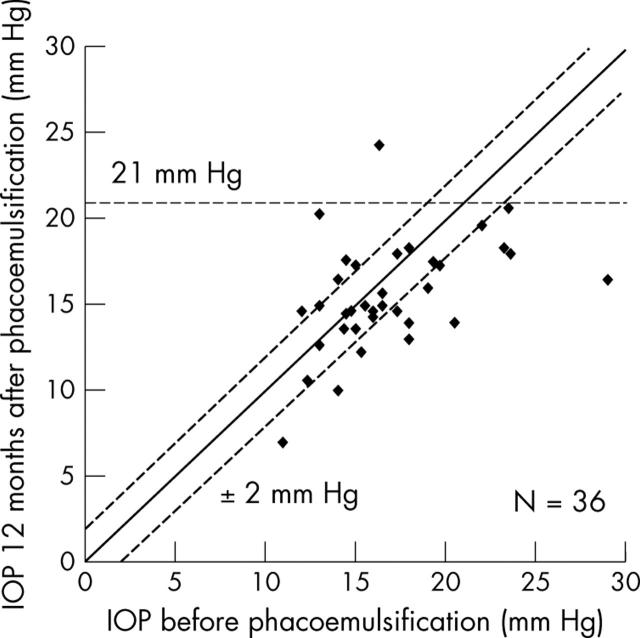
Scattergram of individual intraocular pressures (IOP) before and 12 months after phacoemulsification (control group).
13 Patients (36.1%) showed an IOP decrease of more than 2 mm Hg within 1 year, 17 patients (47.2%) had no IOP difference and six patients (16.7%) had an IOP increase of >2 mm Hg. In one patient the IOP was not controlled (>21 mm Hg). The difference in IOP changes of bleb group and control-group (table 3) is statistically significant (p = 0.0089).
Table 3.
Intraocular pressure (IOP) changes after phacoemulsification in bleb group versus control group
| Bleb group | Control group | Totals | |
| IOP increase >2 mm Hg | 15 | 6 | 21 |
| no IOP change | 11 | 17 | 28 |
| IOP decrease >2 mm Hg | 4 | 13 | 17 |
| Totals | 30 | 36 | 66 |
χ2, p value 0.0089.
Glaucoma medication
The mean number of glaucoma medications (0.8 before cataract surgery, 0.7 immediately postoperatively, 0.7 at 6 months postoperatively, 0.8 at 12 months postoperatively) did not change significantly during the 12 months follow up period. The number of patients in the bleb group who did not require any glaucoma medication after phacoemulsification decreased from 67% before to 57% at 12 months.
Bleb morphology
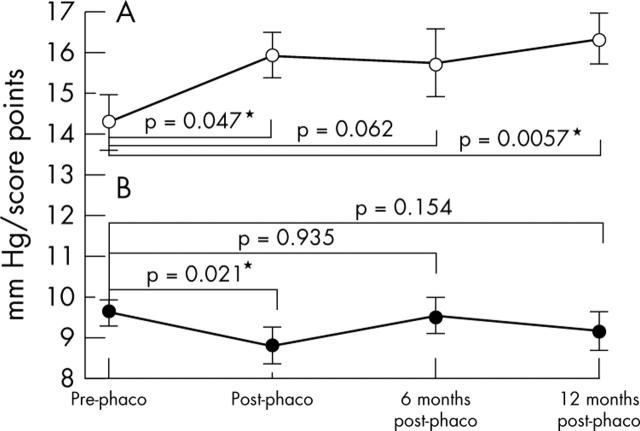
Figure 5 shows the correlation between IOP changes and bleb morphology, which indicates no strong linear relation (R2 = 0.588, p = 0.233).
Figure 5.
Mean intraocular pressure (A) versus mean bleb morphology score (B). *Significant p<0.05.
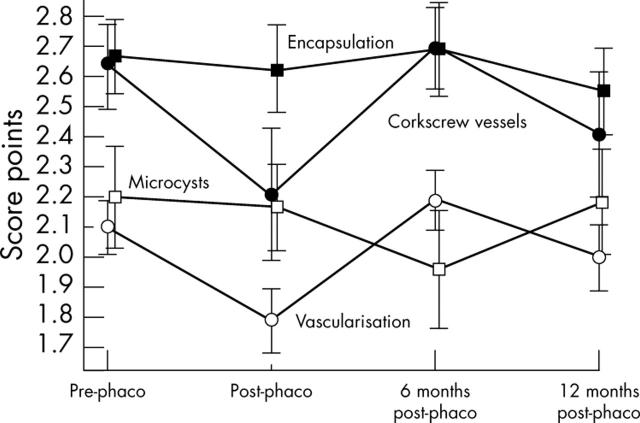
The mean score of filtering bleb morphology 1 year after surgery decreased from 9.5 (2.8) points to 8.9 (3.4) points (p = 0.154) (table 4). The number of corkscrew vessels and general vascularisation significantly increased in the first days after cataract surgery (p = 0.027) (fig 6). The tendency of encapsulation remained stable over 12 months. The elevation of the filtering bleb significantly decreased from 1.6 (1.1) to 1.0 (0.6) corneal thickness equivalents (p = 0.0013).
Table 4.
Bleb morphology score of filtered eyes before and after phacoemulsification
| Mean score | SD | p Value | Total appearance of filtering bleb (max 12 points) | |||
| Insufficient ⩽6 | Medium | Favourable ⩾10 | ||||
| Before phaco | 9.5 | 2.8 | 17% | 50% | 33% | |
| 1st–4th postop day | 8.7 | 3.0 | 0.0214* | 21% | 54% | 25% |
| 6 months postop | 9.3 | 3.0 | 0.935 | 24% | 40% | 36% |
| 12 months postop | 8.9 | 3.4 | 0.154 | 15% | 60% | 27% |
*Statistical significant (Wilcoxon test).
Figure 6.
Mean score of individual filtering bleb parameters.
Visual acuity
Visual acuity improved significantly after phacoemulsification from an average of 0.14 (5.5) lines (0.85 logMAR) before surgery to 0.43 (3.6) lines (0.37 logMAR) 12 months later (p = 0.0001). Twenty nine eyes (96.7%) had a better visual acuity after phacoemulsification, one eye lost two lines of visual acuity because of epiretinal gliosis. 19 eyes (63.3%) achieved a final best corrected visual acuity of 0.5 or better.
DISCUSSION
As glaucoma requires a lifelong management, the development of cataract is a significant concern because its treatment may lead to loss of IOP control. There are differing reports on IOP changes after cataract surgery in glaucoma filtered eyes, ranging from a decrease of 0.8 mm Hg to an increase of 6.6 mm Hg (follow up ranging from 8 to 70 months).1 In our prospective, controlled study we found a statistically significant mean IOP increase of 2.05 mm Hg 1 year after phacoemulsification (p = 0.0057). To our knowledge there are only two prospective studies on this topic.3,10
In a comparable prospective study, Rebolleda and Munoz-Negrete3 reported similar results with a mean IOP increase of 2.04 mm Hg 12 months after phacoemulsification. Khokar et al10 found no statistically significant IOP difference before and after phacoemulsification. In this study only chronic angle closure glaucoma eyes were included and IOP control was achieved by lens extraction in up to 68%11,12 as a result of anterior chamber deepening. In our study we excluded eyes with angle closure glaucoma to avoid opposite mechanisms of action in different forms of glaucoma.
There is a number of retrospective studies showing an IOP increase after cataract surgery (ECCE or phaco) in filtered glaucoma eyes,1,4,5,7,11,13 few authors reported on IOP decrease or no change.6,14 In our study we matched a control group with respect to age, sex, IOP, glaucoma diagnosis, and duration of follow up to compare our results after phacoemulsification to those without previous glaucoma surgery. This control group showed a mean IOP decrease of 2.01 mm Hg (p = 0.0014) in the 12 months follow up. 36% of the patients of the control group had an IOP decrease of ⩾2 mm Hg. This corresponds well with previously published data.15,16
For interpretation IOP regulation in filtered eyes we have to consider the normal course of IOP after filtering surgery. In the Advanced Glaucoma Intervention Study (AGIS) 17 an average IOP increase at the 72 months follow up (corresponding to our interval) was measured: 0.33 mm Hg IOP increase (<14 mm Hg group), 1.11 mm Hg IOP increase (14–17.7 mm Hg group), 2.60 mm Hg IOP increase (>17.5 mm Hg group). These data show that a slight increase of IOP over time is common after trabeculectomy.19 Therefore the influence of phacoemulsification on IOP may not as high as it seems to be.
In contrast with Chen et al1 we did not find an influence of the glaucoma diagnosis or of any intraoperative manipulation (for example, iris retractors) on IOP. Furthermore, we could not demonstrate an effect of antimetabolites used during glaucoma surgery on the IOP outcome or filtering bleb morphology, but only six patients received antimetabolites.
Also there was no influence of the interval between glaucoma and cataract surgery on IOP outcome (R2 = 0.002, p = 0.806).
It was a major concern of this study to find a correlation between filtering bleb development and IOP using well defined morphological slit lamp criteria. Most reports in the literature only focused on bleb size, elevation,1,3,4,6 and vascularity.19 To our knowledge a detailed and standardised bleb evaluation in a long-term follow up of filtered glaucoma eyes has not yet been published. Wyganski-Jaffe et al4 used a graded scale for conjunctival elevation and found a significantly decrease of the size of the filtering bleb 3 months after ECCE through a superior clear corneal incision, but not further up to 18 months follow up. Dickens et al13 and Chen et al1 also reported on decreased filtering bleb size. However, reconstruction and evaluation of bleb morphology in retrospective studies without standardised criteria is difficult.
In our study we used the parameters vascularisation, corkscrew vessels, microcyts, encapsulation and elevation as morphological slit lamp criteria (table 1). Increased vascularisation might accelerate the migration of inflammatory cells and fibroblasts resulting in collagen formation.20 Contraction of collagen fibrils leads to the development of corkscrew vessels, while microcysts are a sign of good filtration of the bleb. The investigator has to pay attention on corkscrew vessels and encapsulation as signs of imminent scar formation.
A modification of our bleb classification has recently been used in a prospective study21 to investigate the morphological appearance of filtering blebs after primary MMC trabeculectomy.
We used four criteria (vascularisation, corkscrew vessels, microcysts and encapsulation) to establish a semiquantitative score. The mean bleb score decreased from 9.5 points before phacoemulsification to 8.9 points after 1 year which was not statistically significant (p = 0.154). However, in some specific parameters some interesting changes were noticed. The follow up immediately after phacoemulsification revealed an increase in vascularisation and corkscrew vessels according to the surgical trauma (see fig 6). Encapsulation remained stable over 1 year follow up. Elevation was not included in our bleb score, because it might have favourable (good filtration) and also unfavourable aspects (prominent Tenon cyst). We calculated the bleb elevation separately using corneal thickness equivalents for quantification. The mean elevation significantly decreased from 1.6 (1.1) to 1.0 (0.6) corneal thickness equivalents (p = 0.0013). This is comparable to previously published results,1,4,13 which described a reduction in bleb size and elevation. The reason for the decrease of elevation might be a transient reduced production of aqueous humour followed by a decreased flow through the trabeculectomy resulting in bleb flattening.22 Although we could not find a strong linear relation between IOP outcome and bleb score (fig 6), the tendency that a higher IOP and a more “unfavourable” filtering bleb are related is obvious.
Thirty three per cent of the filtering blebs were classified as “favourable” (⩾10 points) before phacoemulsification, 27% remained “favourable” at the 12 month visit. Hence, there was only little general effect of phacoemulsification on bleb morphology as detectable with slit lamp biomicroscopy. Although there are only few long term changes in bleb morphology, a standardised bleb evaluation is very important in the early postoperative period after trabeculectomy to be always aware of early signs of bleb scarring.
Our results indicate that a phacoemulsification may jeopardise a previously functioning filtering bleb, resulting in IOP increase. In this respect, the cataractogenesis of glaucoma surgery may become an important issue for indication of both glaucoma and cataract surgery.
REFERENCES
- 1.Chen PP, Weaver YK, Budenz DL, et al. Trabeculectomy function after cataract extraction. Ophthalmology 1998;105:1928–35. [DOI] [PubMed] [Google Scholar]
- 2.Mills KB. Trabeculectomy: a retrospective long term follow up of 44 cases. Br J Ophthalmol 1981;65:790–5. [DOI] [PMC free article] [PubMed] [Google Scholar]
- 3.Rebolleda G, Munoz-Negrete FJ. Phacoemulsification in eyes with functioning filtering blebs: a prospective study. Ophthalmology 2002;109:2248–55. [DOI] [PubMed] [Google Scholar]
- 4.Wygansky-Jaffe T, Barak A, Melamed S, et al. Intraocular pressure increments after cataract extraction in glaucomatous eyes with functioning filtering blebs. Ophthalmic Surg Lasers 1997;28:657–61. [PubMed] [Google Scholar]
- 5.Crichton ACS, Kirker AW. Intraocular pressure and medication control after clear cornea phacoemulsification and Acrysof posterior chamber intraocular lens implantation in patients with filtering blebs. J Glaucoma 2001;10:38–46. [DOI] [PubMed] [Google Scholar]
- 6.Manoj B, Chako D, Khan MY. Effect of extracapsular cataract extraction and phacoemulsification performed after trabeculectomy on intraocular pressure. J Cataract Refract Surg 2000;26:75–8. [DOI] [PubMed] [Google Scholar]
- 7.Doyle W, Smith MF. Effect of phacoemulsification surgery on hypotony following trabeculectomy surgery. Arch Ophthalmol 2000;118:763–65. [DOI] [PubMed] [Google Scholar]
- 8.Picht G, Grehn F. Classification of filtering blebs in trabeculectomy: biomicroscopy and functionality. Curr Opin Ophthalmol 1998;9:2–8. [DOI] [PubMed] [Google Scholar]
- 9.Picht G, Grehn F. Sickerkissenentwicklung nach Trabekulektomie. Ophthalmologe 1998;95:380–7. [DOI] [PubMed] [Google Scholar]
- 10.Khokhar S, Sindhu N, Pangtey MS. Phacoemulsification in filtered chronic angle closure glaucoma eyes. Clin Exp Ophthalmol 2002;30:256–60. [DOI] [PubMed] [Google Scholar]
- 11.Derbolav A, Vass C, Menapace R, et al. Long-term effect of phacoemulsification on intraocular pressure after trabeculectomy. J Cataract Refract Surg 2002;28:425–30. [DOI] [PubMed] [Google Scholar]
- 12.Gunning FP, Greve EL. Lens extraction for uncontrolled angle closure glaucoma: long-term follow-up. J Cataract Refract Surg 1998;24:1347–56. [DOI] [PubMed] [Google Scholar]
- 13.Dickens MA, Cashwell LF. Long-term effect of cataract extraction on the function of an established filtering bleb. Ophthalmic Surg Lasers 1996;27:9–14. [PubMed] [Google Scholar]
- 14.Park HJ, Kwon YH, Weitzman M, et al. Temporal corneal phacoemulsification in patients with filtered glaucoma. Arch Ophthalmol 1997;115:1375–80. [PubMed] [Google Scholar]
- 15.Tennen D, Masket S. Short- and long-term effect of clear corneal incisions on intraocular pressure. J Cataract Refract Surg 1996;22:568–70. [DOI] [PubMed] [Google Scholar]
- 16.Shingleton BJ, Gamell LS, O’Donoghue MW, et al. Long-term changes in intraocular pressure after clear corneal phacoemulsification: normal patients versus glaucoma suspect and glaucoma patients. J Cataract Refract Surg 1999;25:885–90. [DOI] [PubMed] [Google Scholar]
- 17.The Advanced Glaucoma Intervention Study (AGIS) 7. The relationship between Control of intraocular pressure and visual field deterioration. Am J Ophthalmol 2000;130:429–40. [DOI] [PubMed] [Google Scholar]
- 18.Lochhead J, Casson RJ, Salmon JF. Long term effect on intraocular pressure of phacotrabeculectomy compared to trabeculectomy. Br J Ophthalmol 2003;87:850–2. [DOI] [PMC free article] [PubMed] [Google Scholar]
- 19.Cantor LB, Mantravadi A, WuDunn D, et al. Morphologic classification of filtering blebs after glaucoma filtration surgery: the Indiana Bleb Appearance Grading Scale. J Glaucoma 2003;12:266–71. [DOI] [PubMed] [Google Scholar]
- 20.Cordeiro MF, Chang L, Lim S, et al. Modulating conjunctival wound healing. Eye 2000;14:536–47. [DOI] [PubMed] [Google Scholar]
- 21.Sacu S, Rainer G, Findl O, et al. Correlation between the early morphological appearance of filtering blebs and outcome of trabeculectomy with mitomycin C. J Glaucoma 2003;12:430–5. [DOI] [PubMed] [Google Scholar]
- 22.Bigger JF, Becker B. Cataracts and primary open angle glaucoma: the effect of uncomplicated cataract extraction on glaucoma control. Ophthalmology 1971;75:260–72. [PubMed] [Google Scholar]


