Abstract
Aims: To examine the ability of the multifocal pattern visual evoked potential (mVEP) to detect field loss in neurological lesions affecting the visual pathway from the chiasm to the cortex.
Method: The mVEPs recorded in the clinic were retrospectively reviewed for any cases involving central neurological lesions. Recordings had been performed with the AccuMap V1.3 objective perimeter, which used an array of four bipolar occipital electrodes to provide four differently oriented channels for simultaneous recording. 19 patients with hemianopias were identified. Of these there were 10 homonymous hemianopias with hemifield type loss, two bitemporal hemianopias, and seven homonymous hemianopias with quadrantanopic distribution. A comparison with subjective field results and CT/MRI findings was done to determine the relation between the two methods of visual field mapping and any relation with the anatomical location of the lesion and the mVEP results.
Results: In all hemianopic type cases (12) the defect was demonstrated on the mVEP and showed good correspondence in location of the scotoma (nine homonymous and two bitemporal). The topographic distribution was similar but not identical to subjective testing. Of the seven quadrantanopic type hemianopias, only four were found to have corresponding mVEP losses in the same areas. In the three cases where the mVEP was normal, the type of quadrantanopia had features consistent with an extra-striate lesion being very congruous, complete, and respecting the horizontal meridian.
Conclusions: The mVEP can detect field loss from cortical lesions, but not in some cases of homonymous quadrantanopia, where the lesion may have been in the extra-striate cortex. This supports the concept that the mVEP is generated in V1 striate cortex and that it may be able to distinguish striate from extra-striate lesions. It implies caution should be used when interpreting “functional” loss using the mVEP if the visual field pattern is quadrantic.
Keywords: multifocal pattern visual evoked potential, perimetry
The visual evoked potential (VEP) has traditionally been an important method for assessing the state of visual pathways. It has been most useful in the diagnosis of conditions such as optic neuritis and other optic neuropathies. There have been several reports of VEP abnormalities in cortical lesions, which demonstrated reductions in amplitudes when the affected part of the visual field was stimulated. Sequential quadrantic or hemifield stimulation was used in these studies.1–6
The clinical findings from these studies were limited by the fact that the conventional pattern VEP is predominantly generated by cortical elements receiving projections from the central retina and it has been estimated that the central 2° of visual field contributes 65% of the response.7–9 Therefore, the conventional VEP had limited ability to reflect field loss in non-central areas. Recent developments in multifocal stimulation techniques have provided a new method for assessing visual function, and expanded the scope of the VEP to enable assessment of multiple sites in the field out to 30° eccentricity.10,11 Results published using multifocal techniques have demonstrated a good correspondence between visual field thresholds and the amplitude of the local multifocal VEP (mVEP) response. Scotomas can be identified, and field defects in glaucomatous optic neuropathy and optic neuritis have been well defined.12–17
There are a few reports of mVEPs in cortical lesions, which have suggested that hemianopic and quadrantic defects can be identified and topographically represented with the mVEP responses.18,19 This has led to the notion if a normal mVEP response is obtained from stimulation of the “blind” area of the field that the visual loss is “functional” rather than pathological.18 If true then this would have implications for the investigation of suspected malingerers and cases of medicolegal compensation.
We have investigated a sample of confirmed visual pathway or cortical lesions with varying types of field defects to determine if the mVEP does represent the subjective losses seen on perimetric testing. Based on previous conventional VEP studies, which were thought to be a good differentiating tool for functional versus organic field loss, and limited mVEP research, it had been anticipated that all types of lesions would be detected. However, since the mVEP is thought to be derived from the striate V1 cortex20–22 (although exact origins are yet to be confirmed), the possibility that extra-striate lesions might remain undetected still remains.
METHODS
Subjects
A retrospective review was performed of all subjects tested in the clinic with mVEP. Nineteen subjects were identified who had various forms of homonymous or bitemporal field loss from lesions of the posterior visual pathway (pituitary to visual cortex). All subjects had subjective visual fields (Humphrey visual field Sita standard 24-2), and 17/19 had some form of neuroimaging (computed tomography (CT) or magnetic resonance imaging (MRI)) available. Three of the subjects had been tested twice on the mVEP.
Informed consent was obtained from all subjects before mVEP testing. The study had ethics approval and followed the principles of the Declaration of Helsinki.
Stimulation and recording
The AccuMap system (ObjectiVision, Sydney, Australia) has been described in detail in previous publications.16 Briefly, a checkerboard pattern undergoes pseudo-random binary exchange at each of 56 sites in the visual field. Each input (stimulation site) is modulated in time according to a different sequence. The technique permits computation of the resulting signal by cross correlation of the response evoked by the sequence stimulation, with the sequence itself. Further runs then use different sequences for the same stimulation site to reduce cross contamination.
The visual stimulus is generated on a computer screen (22″ Hitachi high resolution display, video frame rate 75 Hz). Fifty six close packed segments in a dartboard configuration are used. The segments are cortically scaled with eccentricity to stimulate approximately equal areas of cortical (striate) surface (see fig 1). The scaling therefore produces a signal of similar amplitude from each stimulated segment. Each segment contains a checkerboard pattern (16 checks), with the size of individual checks being proportional to the size of the segment and therefore also dependent on eccentricity. Luminance of the white check is 146 cd/m2 and luminance of the black check 1.1 cd/m2, producing Michelson contrast of 99%. Background luminance of the screen is maintained at a mean level of 73.5 cd/m2. A dim room light is always on.
Figure 1.
Stimulus pattern for mVEP. Note central check sizes and stimulus areas are much smaller than peripheral (cortical scaling of stimulus). External ring expands up to 26° of eccentricity with an additional nasal step up to 32°.
Subjects are seated comfortably in a chair and asked to fixate on the fixation number at the centre of the stimulus pattern. The distance to the screen is 30 cm, corresponding to a total subtense of the stimulus of 52° with an additional nasal step. All subjects are optimally refracted for near and the pupils are not dilated. All recordings are collected using monocular stimulation. The signal is amplified 100 000 times and band pass filtered between 1 Hz and 30 Hz, with later digital filtering down to 20 Hz, using finite impulse response (FIR) band pass filter. The data sampling rate is 502 Hz. Raw data are scanned in real time and runs contaminated by a high level of noise are rejected. Usually eight runs of 55 seconds are recorded to provide a good signal to noise ratio.
Gold disc electrodes (Grass) are positioned in an occipital cross electrode holder positioned over the inion (with electrodes 3 cm above, 6 cm below, and 4 cm either side).12 Four channels are derived from different pairs of electrodes (vertical, horizontal, and two oblique). Raw trace data are analysed using the ObjectiVision software. Peak to trough amplitudes for each wave within the interval of 60–220 ms are determined and compared among channels for every stimulated segment of the visual field. The wave of maximal amplitude from the four channels, for each point in the field, is selected and a combined four channel topographic map is created by the software. Amplitude and latency of the mVEP for each point in the field is then determined (for details see Klistorner and Graham12).
The mVEP amplitudes in the combined trace array are compared with the normals database percentiles, and probability of abnormality plots are constructed.
Student’s t tests are used to calculate statistical difference between averaged mVEP amplitudes derived from affected and non-affected quadrants of the visual field.
RESULTS
There were 19 cases identified where the diagnosis and clinical findings were consistent with a posterior pathway (chiasm to cortex) lesion. These resulted in 12 cases with hemianopic and seven quadrantanopic type defects. Of these, there were 14 definite cerebrovascular events, one presumed cerebrovascular accident (CVA) having no lesion identified on CT scan, one cerebral aneurysm, one traumatic head injury, a pituitary tumour, and a craniopharyngioma. A CT scan or MRI had been able to confirm a lesion in 15/19 cases. In 2 cases no lesion was seen on CT scan, but the patient had been presumed to have had an ischaemic event (which is not always identifiable by CT scanning). A further two cases were longstanding deficits (cerebral aneurysm and trauma) and did not have old CT scans available. Table 1 summarises the subjects and the clinical findings.
Table 1.
Summary of clinical, mVEP, and CT/MRI findings of all patients
| Patient No | Age | Sex | Diagnosis | CT or MRI confirmed | Field defect | MVEP defect | Repeat MVEP defect | ||
| 1 | 56 | M | L occipital infarct | Yes | R hemianopia incomplete | Yes | – | ||
| 2 | 80 | F | L occipital infarct | Yes | R complete hemianopia | Yes | – | ||
| 3 | 53 | M | L occipital infarct | Yes | R hemianopia congruous, macular sparing | Yes | – | ||
| 4 | 65 | M | Pituitary tumour | Yes | R hemianopia, incomplete, plus L optic atrophy | Yes | – | ||
| 5 | 43 | M | Embolic CVA, partial recovery | No lesion on CT | L incomplete congruous hemianopia | Yes | – | ||
| 6 | 53 | M | Blunt head injury 20 years ago | Not available | L hemianopia, complete, congruous | Yes | Yes | ||
| 7 | 80 | F | R medial occipital lobe infarct | Yes | L incomplete hemianopia, congruous | Yes | – | ||
| 8 | 45 | F | Craniopharyngioma with chiasmal compression | Yes | Bitemporal hemianopia | Yes | – | ||
| 9 | 74 | M | L occipital infarct | Yes | R hemianopia incomplete | Yes | – | ||
| 10 | 57 | M | Massive R middle cerebral CVA/ craniectomy decompression | Yes | L hemianopia, R complete field loss and optic atrophy | Yes | – | ||
| 11 | 66 | F | R occipital infarct | Yes | L hemianopia incomplete | Yes | – | ||
| 12 | 69 | F | Left parietal and right occipital infarcts | Yes | L hemianopia, R incomplete incongruous quadrantanopia | Yes | – | ||
| 13 | 62 | M | Cerebral aneurysm | Not available | RS quadrantanopia incomplete non-congruous | Yes | – | ||
| 14 | 51 | F | Occipital infarct | Yes | RI quadrantanopia incomplete, non-congruous | Yes | – | ||
| 15 | 61 | F | R occipital infarct | Yes | LS quadrantanopia non-congruous | Yes | Yes | ||
| 16 | 73 | F | L inferior pole occipital lobe infarct | Yes | RS quadrantanopia incomplete, macular sparing | Yes | – | ||
| 17 | 51 | F | L inferior pole occipital lobe infarct | Yes | RS quadrantanopia complete, congruous | No | – | ||
| 18 | 66 | F | Hypotensive episode ?infarct | No lesion on CT scan | LS quadrantanopia, complete, congruous | No | No | ||
| 19 | 80 | M | L occipital infarct | Yes | RI quadrantanopia incomplete, congruous | No | – |
R: right; L: left; S: superior; I: inferior; CVA: cerebrovascular accident; CT: computed tomography scan; MRI: magnetic resonance imaging.
Repeat mVEP defect shows result if second test was done (3 cases only).
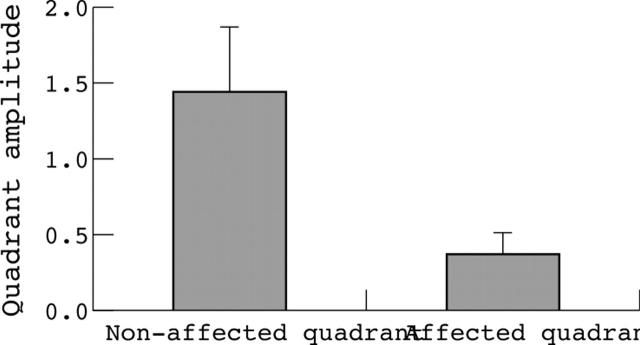
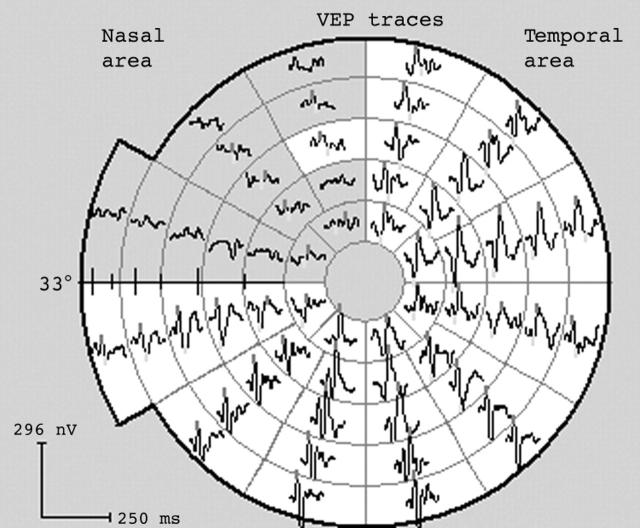
In 16 out of 19 cases (12 hemifield type hemianopias and four quadrantic type hemianopias) the mVEP result was abnormal according to the Accumap severity index16 (ASI) and showed a scotoma of >10 points on the probability plot of p<0.1. In all those cases there was clear topographic correspondence between subjective visual field and mVEP. However, the distribution of the field defect did not always show as clear a vertical demarcation as the subjective test, and in some cases did not fully extend to the periphery. Despite this, it was always identifiable as a hemifield defect, and was not obscured by surrounding noise. When average quadrantic amplitude of mVEP from subjectively normal quadrants was compared with amplitude derived from quadrants which were affected on Humphrey visual field (HVF) (at least 75% of test points p <0.5%) the difference was highly statistically significant (p<0.0001, Student’s t test) (fig 2).
Figure 2.
Average quadrantic amplitude of mVEP from normal quadrants on Humphrey visual field (HVF) Sita 24-2 compared with mVEP amplitude derived from quadrants which were affected on HVF (at least 75% of test points p<0.5%). Data from the 10 cases where mVEP was abnormal (p<0.0001).
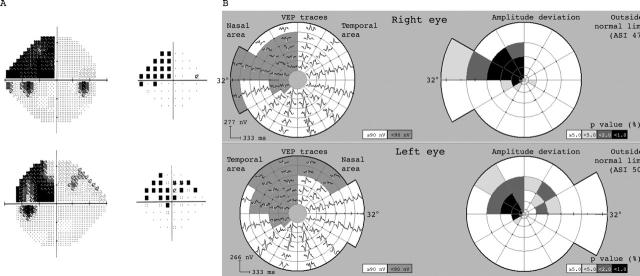
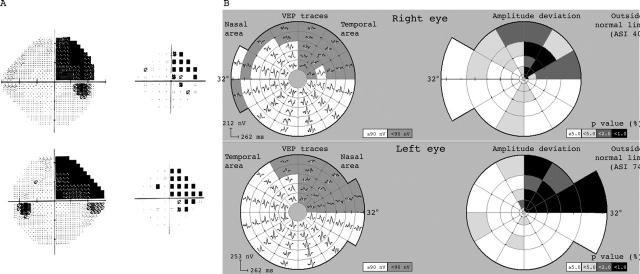
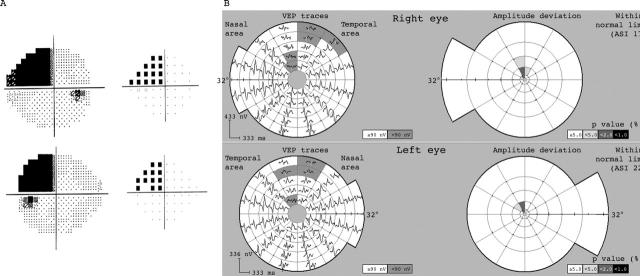
Examples showing subjective fields and corresponding mVEP are presented in figures 3–5, with one hemianopic type and two quadrantic type hemianopias. The hemianopic defect is well defined on both subjective and objective tests (fig 3). The quadrantic field defect in figure 4 just crossed the horizontal midline in the left eye making it incongruous, although in the mVEP it respects the horizontal. Figure 5 shows an incomplete left homonymous quadrantanopic defect, with an additional small defect in the superonasal field of the left eye which was caused by an old retinal lesion.
Figure 3.
Subject with hemianopia from head trauma (patient 6). Shows HVF grey scale and pattern deviation plots (Sita 24-2) for right and left eyes (A) and corresponding mVEP trace arrays and probability plots (B) from AccuMap. There is good correspondence between HVF and mVEP defects.
Figure 5.
Subject with an incomplete incongruous left quadrantanopia, with an additional small defect in the superonasal field of the left eye which was caused by an old retinal lesion (subject 15).
Figure 4.
Subject with right superior quadrantic field defect (subject 13). The defect just crosses the horizontal meridian in the left eye making it not completely congruous.
However, in three cases (all congruous quadrantanopic types) the amplitude of mVEP was normal across the whole field despite clear abnormality seen on HVF (see example in fig 6). On examining quadrantic mVEP amplitudes there was no statistical difference (p = 0.46, Student’s t test) between the mVEP amplitudes of the affected and unaffected quadrants.
Figure 6.
Subject with complete, congruous left superior quadrantanopia from a presumed vascular event with normal CT scan (subject 18). Repeat visual fields on more than five occasions confirmed distribution. A normal mVEP was recorded twice, with only a few paracentral points reaching borderline significance. Finding is consistent with an extra-striate lesion.
Therefore, in all of the hemianopic type cases (12/12) but only 4/7 quadrantanopic type lesions, corresponding mVEP losses were found in the same areas of the visual field. The topography of the field loss in the corresponding 15 cases showed very similar distributions, as seen in the figures 3–5. However, the vertical midline demarcation was not as clear in the mVEP as it was on subjective testing, with some abnormal points seen in several cases adjacent to the midline in the normal hemifield.
To determine if artefactual signals could be generated in a quadrant with no signal input we occluded a quadrant of the screen and recorded the mVEP in a normal subject (fig 7). This clearly showed loss of signal in that quadrant, so we do not believe the normal signals in the three cases with quadrantanopic type defects with normal mVEPs are generated by cross contamination or artefact. It is important to realise that occluding a segment of the screen does not simulate a real scotoma, it merely confirms that the software is not generating artificial signals by cross contamination.
Figure 7.
Artificial quadrant defect in a normal subject produced by occluding the upper left quadrant of the stimulus screen. Confirms loss of mVEP signal and excludes cross contamination that could mask field loss. Grey shading indicates areas where signal is indistinguishable from noise or <60 nV. There is slight signal spill over across the vertical (in one segment) possibly due to fixation shifts. It is important to realise that occluding a segment of the screen does not simulate a real scotoma, it only confirms that the software is not generating artificial signals by cross contamination or processing errors.
DISCUSSION
The use of multichannel multifocal VEP recording provides a new means of assessing the integrity of the visual pathway through to the visual cortex. There have been many previous studies on the ability of the conventional VEP to detect field loss and hemianopias.1–6 While it can be achieved, the topographical relation is difficult to define without the new dimension that multifocal techniques provide. Thus, two recent reports by Ringger (ARVO abstract no 248, 2004) and Wall23 indicated that hemianopic lesions can be detected by mVEP, but that subcortical lesions are more readily identified than cortical.
In this study all of the 12 hemianopic cases with hemifield type defects were found to have corresponding mVEP losses in the same areas. These hemianopic cases showed definite occipital lesions in eight cases, two more were from chiasmal compression, one from clipping of a cerebral aneurysm more than 15 years earlier and one from old head trauma from a motor vehicle accident. In all these cases the hemianopia was demonstrated on the mVEP, even if the topographic correspondence was not exact.
However, only four out of seven hemianopias with quadrantanopic type defects showed corresponding defects on mVEP. In three quadrantanopia cases the mVEP was normal across the whole field. A more detailed examination of the HVF in these cases was undertaken, and revealed a noticeable difference between the two groups. While in the four cases where the mVEP was affected the subjective scotoma did not quite reach horizontal meridian (three cases) or was slightly over it (one case), in the remaining three cases with a normal mVEP, the HVF defect respected horizontal meridian.
The mVEP is thought to be mostly derived from the striate cortex (area V1).14,20–22 Thus, recent studies based on principal component analysis have confirmed that the electrical dipole that generates the mVEP response follows the shape of V1 folding.22 We therefore would expect that any lesions before or including V1 would lead to reductions in signal. Alternatively, the presence of a mVEP should indicate that there is no abnormality present at least up to the level of neurons of the striate cortex. However, the possibility remains that focal cortical lesions involving extra-striate areas (which are also retinotopically organised) could produce subjective visual field loss but retain a normal amplitude mVEP signal.
While there is no information available about the topography of extra-striate V2/V3 areas in humans, animal experiments indicate that V2 surrounds V1 with projections of upper and lower hemifields being separated by the striate cortex, while V3 is wrapped around V2, being therefore with its upper and lower hemifields separated even further.24–26
Based on anatomical topography it has been suggested, and clinically confirmed in a few cases, that lesions on the border between V2/V3 or V1/V2 will manifest quadrantanopic type scotomas, which would exactly respect the horizontal meridian.27–30 Furthermore, it was proposed that for localised damage in V1 to produce a scotoma strictly respecting the horizontal meridian, the lesion must transect the striate cortex exactly along the base of the calcarine fissure all the way through to incorporate central and peripheral parts of the field.30 This is very unlikely for both vascular and neoplastic type lesions. The idea that lesions in extra-striate areas can produce dense perimetric scotomas has been questioned by Merigan and co-workers, however.31 Based on animal studies using chemical deactivation of neurons in area V2, they suggested that a quadrantic type scotoma is more likely to be caused by damage to fibre tracts leading from V1 to extra-striate areas, rather than neuronal damage in extra-striate areas themselves. While this matter still remains controversial, it is accepted that a quadrantanopic type scotoma, which strictly respects the horizontal meridian can be caused by damage beyond the neurons of V1.
As was indicated, in the three cases of quadrantanopic type scotoma, which were not manifested on mVEP the defects strictly respected the horizontal as well as the vertical midline. This was consistent with a lesion beyond the striate cortex.30 The CT or MRI showed small localised occipital pole infarcts in two cases, and no detectable lesion in the third. Standard neuroimaging is not accurate enough to confirm an exclusively extra-striate lesion, but the small occipital infarcts were not inconsistent. A recent study using functional MRI has demonstrated in a human with a congruous quadrantic defect the loss of MRI signal in the corresponding extra-striate area, but preservation of the MRI signal in V1.28
In the four other cases of quadrantanopic type hemianopia where the mVEP was reduced, the field defects were more characteristic of lesions at or before the striate cortex. They had less congruous defects that did not respect the horizontal meridian. In these cases the mVEP was abnormal in the quadrants involved.
The observation that in many cases the mVEP was not as clearly respecting the vertical midline is important in terms of applying the mVEP technique to investigating neurological lesions. This may be because the stimulus extends right up to the midline in the mVEP, whereas in the Humphrey visual field the test points are 3° either side of the vertical. Shifts of fixation therefore can have a greater impact. A similar problem was reported in frequency doubled threshold (FDT) perimetry32 and has been adjusted for in the latest version of the FDT system.
A further reason for lack of exact correspondence between mVEP and subjective fields is that in some areas the background noise (including alpha rhythm) is being incorrectly recognised as a true signal, so the probability plot is not flagging the area as abnormal. Improvements in signal recognition will help reduce this problem.
In conclusion, in the investigation of optic pathway or cortical lesions the mVEP can be used to confirm hemianopic defects, in lesions up to and involving the V1 striate cortex neurons. We propose that the three cases with quadrantanopic type defects with preserved mVEP (which showed scotomas respecting horizontal meridian) may have been lesions in extra-striate areas or the tracts leading from V1, as they had field defects typical for this. The findings are consistent with the notion that most of the mVEP signal appears to derive from V1. It also means that preservation of amplitude implies an intact pathway to V1, which helps localise the lesion. However, a quadrantic subjective field loss respecting horizontal meridian should not be judged as “functional” or malingering just because the mVEP is preserved, since it could be of extra-striate origin.
Abbreviations
CVA, cerebrovascular accident
FDT, frequency doubled threshold
FIR, finite impulse response
HVF, Humphrey visual field
mVEP, multifocal pattern visual evoked potential
VEP, visual evoked potential
Proprietary interest: AIK and SLG consultants for ObjectiVision.
AIK is Sydney Medical Foundation research fellow.
REFERENCES
- 1.Vallar G, Sandroni P, Rusconi ML, et al. Hemianopia, hemianesthesia and spatial neglect: a study with evoked potentials. Neurology 1991;41:1918–22. [DOI] [PubMed] [Google Scholar]
- 2.Biersdorff WR, Bell RA, Beck RW. Pattern visual evoked potentials in patients with homonymous hemianopia. Doc Ophthalmol 1992;80:51–61. [DOI] [PubMed] [Google Scholar]
- 3.Maccolini E, Andreoli A, Valde G, et al. Hemifield pattern-reversal visual evoked potential in retrochiasmal lesions with homonymous visual field defect. Ital J Neurol Sci 1986;7:437–42. [DOI] [PubMed] [Google Scholar]
- 4.Bradham MS, Montgomery DM, Evans AL, et al. Objective detection of hemifield and quadrantic field defects by visual evoked cortical potential. Br J Ophthalmol 1996;80:297–303. [DOI] [PMC free article] [PubMed] [Google Scholar]
- 5.Howe JW, Mitchell KW. Visual evoked potentials from quadrantic field stimulation in the investigation of homonymous field defects. In: Barber C, ed. Evoked potentials. Lancaster: MTP Press, 1980:279–83.
- 6.Yanashima K . Determination of visual field defects by the visually evoked cortical potentia (VECP) decoded by fast Fourier transform (FFT). Doc Ophthalmol Proc Series 1982;31:427–35. [Google Scholar]
- 7.Weinstein GW, Odom JV, Cavender S. Visually evoked potentials and electroretinography in neurologic evaluation. Review. Neurol Clin 1991;9:225–42. [PubMed] [Google Scholar]
- 8.Regan D . Evoked potentials in psychology, sensory physiology and clinical medicine. London: Chapman and Hall, 1972.
- 9.Gray LG, Galetta SL, Siegal T, et al. The central visual field in homonymous hemianopia. Evidence for unilateral foveal representation. Arch Neurol 1997;54:312–17. [DOI] [PubMed] [Google Scholar]
- 10.Baseler HA, Sutter EE, Klein SA, et al. The topography of visual evoked response properties across the visual field. Electroencephal Clin Neurophysiol 1994;90:65–81. [DOI] [PubMed] [Google Scholar]
- 11.Klistorner AI, Graham SL, Grigg JR, et al. Multifocal topographic visual evoked potential: improving objective detection of local visual field defects. Invest Ophthalmol Vis Sci 1998;39:937–50. [PubMed] [Google Scholar]
- 12.Klistorner A, Graham SL, Objective perimetry in glaucoma. Ophthalmol 2000;107:2283–99. [DOI] [PubMed] [Google Scholar]
- 13.Graham SL, Klistorner A, Grigg JR, et al. Objective VEP perimetry in glaucoma—asymmetry analysis to identify early deficits. J Glaucoma 2000;9:10–19. [DOI] [PubMed] [Google Scholar]
- 14.Hood DC, Greenstein VC. Multifocal VEP and ganglion cell damage: applications and limitations for the study of glaucoma. Prog Ret Eye Res 2001;22:201–51. [DOI] [PubMed] [Google Scholar]
- 15.Hood DC, Odel JG, Zhang X. Tracking the recovery of local optic nerve function after optic neuritis:a multifocal VEP study. Invest Ophthalmol Vis Sci 2000;41:4032–8. [PubMed] [Google Scholar]
- 16.Goldberg I, Graham SL, Klistorner A. Multifocal objective perimetry in the detection of glaucomatous field loss. Am J Ophthalmol 2002;133:29–39. [DOI] [PubMed] [Google Scholar]
- 17.Fortune B, Goh K, Demirel S, et al. Detection of glaucomatous field loss using multifocal VEP. In: Perimetry update 2002/2003. Proc XV Int Perimetric Soc Meeting. The Hague: Kugler Publications, 2004:251–60.
- 18.Miele DL, Odel JG, Behrens MM, et al. Functional bitemporal quadrantopia and the multifocal visual evoked potential. J Neuro-Ophthalmol 2000;20:159–62. [DOI] [PubMed] [Google Scholar]
- 19.Betsuin Y, Mashima Y, Ohde H, et al. Clinical application of the multifocal VEPs. Curr Eye Res 2001;22:54–63. [DOI] [PubMed] [Google Scholar]
- 20.Slotnick SD, Klein SA, Carney T, et al. Using multi-stimulus VEP source localization to obtain a retinotopic map of human primary visual cortex. Clin Neurophysiol 1999;110:1793–800. [DOI] [PubMed] [Google Scholar]
- 21.Fortune B, Hood DC, Conventional pattern-reversal VEPs are not equivalent to summed multifocal VEPs. Invest Ophthalmol Vis Sci 2003;44:1367–75. [DOI] [PubMed] [Google Scholar]
- 22.Zhang X, Hood DC. A principal component analysis of multifocal pattern reversal VEP. J Vision. 2004;4 :32–43. [DOI] [PubMed]
- 23.Wall M, Withrow K, Sleep T. Multifocal VEP in optic neuropathies and homonymous hemianopias. In: Perimetry update 2002/2003, Proc XV Int Perimetric Soc Meeting. The Hague: Kugler Publications, 2004:265–74.
- 24.Van Essen DC, Zeki SM. The topographic organisation of rhesus monkey prestriate cortex. J Physiol 1978;277:193–226. [DOI] [PMC free article] [PubMed] [Google Scholar]
- 25.Gattass R, Gross CG, Sandell JH. Visual topography of V2 in the macaque. J Comp Neurol 1981;201:519–39. [DOI] [PubMed] [Google Scholar]
- 26.Weller RE, Kaas JH. Retinitopic pattern of connections of area 17 with visual areas V-II and MT. J Compar Neurol 1983;220:253–79. [DOI] [PubMed] [Google Scholar]
- 27.Horton JC, Hoyt WF. The representation of the visual field in the human striate cortex. Arch Ophthalmol 1991;109:816–24. [DOI] [PubMed] [Google Scholar]
- 28.Slotnick SD, Moo LR. Retinitopic mapping reveals extrastriate cortical basis of homonymous duadrantanopia. Neuroreport. 2003;14 :1209–13. [DOI] [PubMed]
- 29.Jones MR, Waggoner R, Hoyt WF. Cerebral polyopia with extrastriatic quadrantanopia: report of a case with magnetic resonance documentation of V2/V3 cortical infarction. J Neuroophthal 1999;19:1–6. [PubMed] [Google Scholar]
- 30.Horton JC, Hoyt WF. Quadrantic visual field defect. A hallmark of lesions in extra-striate (V2/V3) cortex. Brain 1991;114:1703–18. [DOI] [PubMed] [Google Scholar]
- 31.Merigan WH, Nealey TA, Maunsell HR. Visual effects of lesions of cortical area V2 in macaques. J Neurocsi 1993;13:3180–91. [DOI] [PMC free article] [PubMed] [Google Scholar]
- 32.Wall M, Neahring RK, Woodward KR. Sensitivity and specificity of frequency doubling perimetry in neuro-ophthalmic disorders: a comparison with conventional automated perimetry. Invest Ophthalmol Vis Sci 2002;43:1277–83. [PubMed] [Google Scholar]


