Abstract
Aims: To compare monoscopic and stereoscopic assessment of the optic disc using novel software for the digital stereoscopic analysis of optic disc stereopairs.
Methods: Software was developed for the stereoscopic display of digital optic disc images using an interlaced display method. Neuroretinal rim width was determined at 10 degree intervals around the optic disc using a custom (stereoscopic) cursor whose depth was adjusted to that of Elschnig’s rim. Measurements were taken, first viewing the disc monoscopically and at a separate sitting, stereoscopically.
Results: Measurements were made in 35 eyes from 35 patients (1260 estimates for each observer) using three observers. The mean cup to disc ratio (CDR) ranged from 0.57 to 0.66 (SD 0.13–0.14) for monoscopic viewing compared with 0.64 to 0.69 (SD 0.12–0.14) for stereoscopic viewing. Stereoscopic assessments gave higher CDRs in temporal, superior, nasal, and inferior aspects of the optic disc (p<0.001, Mann-Whitney U test). Agreement between observers in estimating CDR was high for monoscopic assessment (intraclass correlation coefficient 0.74 (CI 0.72 to 0.76) increasing to 0.80 (0.78 to 0.82) for stereoscopic assessment.
Conclusion: Digital stereoscopic optic disc assessment provides lower estimates of neuroretinal rim width and higher levels of interobserver agreement compared with monoscopic assessments.
Keywords: digital imaging, optic nerve head
Accurate and reproducible assessment of the optic disc has a key role in the management of the glaucoma patient. Since considerable axon loss can precede the development of clinically detectable visual field loss, the early detection of structural retinal damage should facilitate earlier disease diagnosis and improve the clinical prognosis. Similarly, close monitoring of the optic disc can detect progressive glaucomatous damage before changes appearing in the visual field.1
The poor agreement, even among expert observers for subjective assessment of the optic disc,2,3 has driven the development of clinical imaging devices such as scanning laser tomography,4 polarimetry,5 and optic coherence tomography.6 These devices show great promise in the diagnosis of glaucoma and in the detection of progressive disease. For example, scanning laser tomography has been reported to detect early glaucomatous optic nerve damage with a sensitivity and specificity approaching 84% and 96%, respectively,7 and can identify eyes with progressive damage before the onset of visual field loss.1
By contrast, stereoscopic analysis of the optic disc images in glaucoma has not been developed as a routine clinical technique even though it remains the “gold standard” by which newer diagnostic technologies continue to be evaluated8 and has provided valuable insights into the nature of glaucomatous pathophysiology.9 Studies comparing the efficacy of stereoscopic imaging for the diagnosis of early glaucoma have shown that in expert hands, it can detect early glaucomatous damage with a sensitivity and specificity8,10 that compares favourably with that obtained with scanning laser ophthalmoscopic devices.11
Several factors have limited the clinical analysis of stereoscopic images. Firstly, the viewing of stereoscopic images can be impractical in the clinical setting where mirror based stereoscopes are required.12 Secondly, the analysis of the optic discs is usually subjective, and the high diagnostic precision that has been reported with this technique has come from groups with considerable expertise in the clinical assessment of the optic disc8; these results may not be applicable in less specialised units. Finally, there is little evidence to show that stereoscopic imaging per se provides sufficient additional clinical information to justify its use when compared with the monoscopic evaluation of optic nerve head images. This issue was highlighted recently by a study analysing sequential stereoscopic images, which suggests that stereoscopic imaging conveys little additional benefit13 for the assessment of the optic disc.
This study employs software that has been developed for the digital, computer based assessment of stereoscopic optic disc images14,15 to address many of the difficulties that have hindered the clinical analysis of these images.16 We describe the application of this technique, in which we have developed tools for the precise delineation of the pathological features of stereoscopic optic disc images in space. The present study was designed to determine, firstly, whether digital stereoscopic analysis provided different estimate of neuroretinal rim width compared with monoscopic assessment and secondly, whether acceptable levels of interobserver agreement could be obtained for the assessment of neuroretinal rim width. These are important questions that should be addressed before a new imaging modality such as digital stereoscopy is considered for clinical use in the diagnosis of glaucomatous optic neuropathy.
METHODS
The study is based on 35 optic disc images from patients with either glaucomatous or normal discs which were selected from our database of clinical images to provide a range of cup to disc ratios (CDRs). Patients were diagnosed as glaucomatous on the basis of visual field examination (Humphrey 24–2 SITA fast) and the existence of characteristic cupping of the optic disc indicating either diffuse or focal damage to the neuroretinal rim as identified by stereoscopic biomicroscopy and, if required, by stereoscopic examination of the optic nerve head images (colour slides). Ocular hypertensive patients had normal optic nerve and visual field examinations with intraocular pressures (IOPs) that were consistently above 22 mm Hg. Patients were classified as normal if they had IOPs of 21 mm Hg or below with normal visual field and optic disc examination. Stereoscopic images were taken in the course of routine patient care following informed and signed consent in accordance with requirements for the use of images in clinical research at the University Hospital of Wales, Cardiff, UK. The observers, who were clinically trained and experienced in optic disc analysis were masked to the diagnosis of the optic discs, which were examined in random order. Sequential high quality stereofundus images were obtained using a Nikon F505 fundus camera using Kodachrome EPN Ektachrome 35 mm slide film (ISO 100). In every case, the pupil was dilated to more than 5 mm using one drop of tropicamide 1% and phenylephrine hydrochloride 2.5%. Stereoscopic images were taken using established techniques in which the illumination beam of the camera was set at the one part of the corneal limbus before being displaced horizontally to produce a standardised offset.8 All patients had clear media with a visual acuity of 20/40 or better with correction.
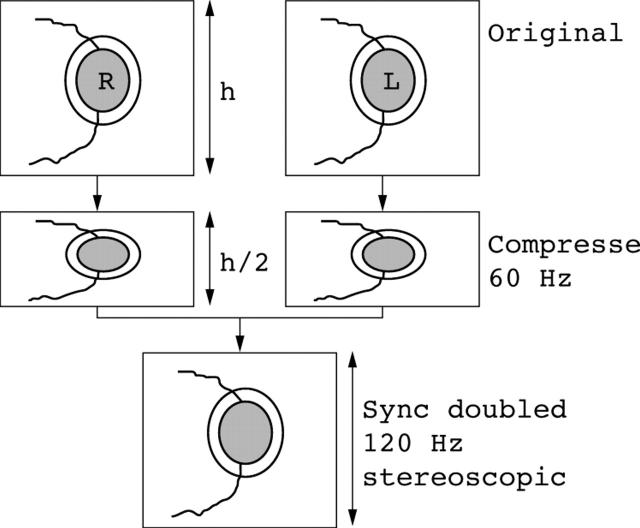
Stereoimages were digitised using a Nikon Coolscan slide scanner to produce 24 bit true colour (1021 × 844 pixel) bit maps. The images were displayed in above and below format on a Sony 400 PS 19 inch monitor with a refresh rate of 75 Hz and were viewed stereoscopically using liquid crystal shutter glasses (Stereographics Corporation, San Rafael, CA, USA). With this display format, the images that comprise the stereopair are compressed to 50% of their original height (fig 1) and arranged so that one image occupies the top half of the display screen (“frame”) and the other image occupies the lower half. At the usual refresh rate of 60 Hz the images would be displayed one above the other in their compressed format. When the synchronous emitter (Stereographics Corp) which is connected to the VGA output of the computer is enabled the monitor refreshes at 120 Hz, showing first the upper field, which is now stretched to occupy the entire screen followed then by the lower field. The fields occupy the same point in space on the screen and are each refreshed, one after the other, at 60 Hz to give a flicker free stereoscopic image. The liquid crystal (LC) shutter glasses are triggered by an infrared emitter so that the LC lenses alternately opacify in synchronicity with the field displayed on the screen so that the correct image is seen by either eye. The images are restored to their original height at this refresh rate, but with 50% of the original vertical resolution. At the start of each session, the operator adjusts the vertical and horizontal offset of the images to ensure the highest quality stereoview. All observers received training in the use of the stereoscopic imaging software before starting the study.
Figure 1.
Diagram showing the image manipulation required to display stereoscopic images in the above and below format using a synchronous doubling emitter. h, image height.
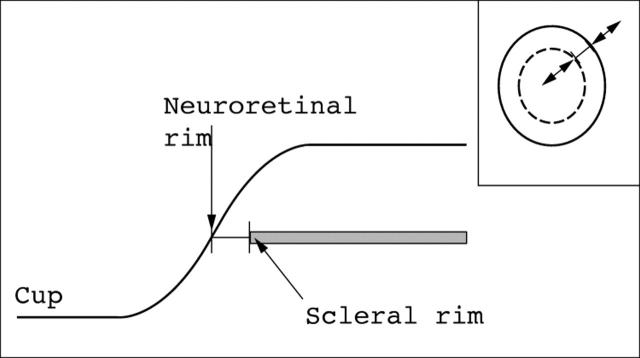
Stereoimages were analysed using a mouse controlled cursor whose depth in stereoscopic viewing space could be adjusted to that of the optic disc margin (inner border of Elschnig’s rim). A second line was then drawn within this boundary to demarcate the inner border of the neuroretinal rim. Both the disc margin and the neuroretinal rim inner boundary were drawn with the cursor set to the depth of the scleral rim (fig 2).
Figure 2.
Schematic diagram showing the criterion used for measurement of neuroretinal rim width. The cursor bar is set to the level of the neuroretinal rim (Elschnig’s rim). The inset diagram of the optic disc shows how the bar can be located to any given sector of the disc and adjusted in length to match the width of the neuroretinal rim.
Once these contour lines were accepted, the program determined the width of the neuroretinal rim at 10 degree intervals around the optic disc. These widths were displayed as a series of lines at the depth of the scleral rim and were seen to lie within the tissue of the neuroretinal rim (fig 2). The length of each line could be adjusted at each 10 degree interval so that the inner and outer ends of the line coincided with the inner and outer margins of the optic disc, respectively. Once the user had completed this adjustment, CDRs were computed automatically and saved for further analysis.
In order to determine whether stereoscopic or monoscopic viewing affected the reproducibility of CDR assessment, the observers first viewed the optic disc monoscopically by viewing the right hand image of the stereoscopic pair. The image was displayed using the same software package and using the stereoscopic viewing glasses (Stereographics) to control for the effects of viewing through LC lenses. Not less than 1 week later, the images were viewed stereoscopically and the CDRs recalculated. Images were analysed in this order so that stereoscopic cues could not influence grading of the monoscopic images.
Comparison between normally distributed variables was by Student’s t test. Non-parametric comparisons were made using the Mann-Whitney test. Differences between CDR estimates were expressed as means and standard deviations. The measure of agreement between the observers was quantified using the intraclass correlation coefficient17 (two way mixed effect model18), which was determined for both monoscopic and stereoscopic images. In each case, statistical analysis was performed using SPSS 10.0.
RESULTS
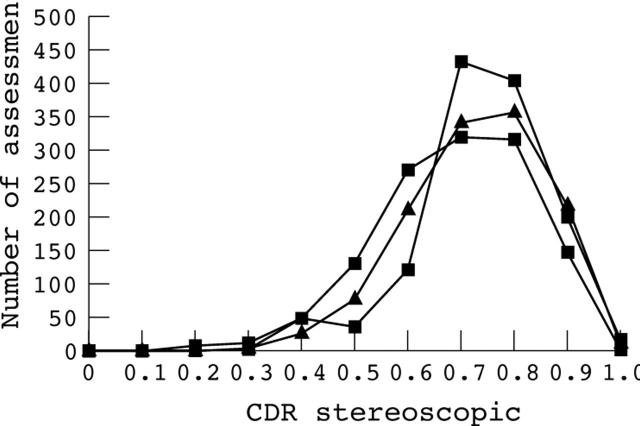
High quality stereopairs were obtained from 35 eyes in 35 patients. Only one image was taken from each individual with 17 images from glaucomatous eyes, three from ocular hypertensive eyes, and 15 from healthy eyes. The mean age of the patients was 64 years (range 44–83 years). Each observer made 36 estimates of CDR in 35 eyes giving a total of 1260 CDR values. The distribution of stereoscopic CDR estimates for the three observers is shown in figure 3.
Figure 3.
Distribution of cup to disc ratios (CDR) for the three observers for stereoscopic assessments. Results from the three observers are represented by different symbols. Each observer made 1260 stereoscopic neuroretinal rim assessments over 35 discs.
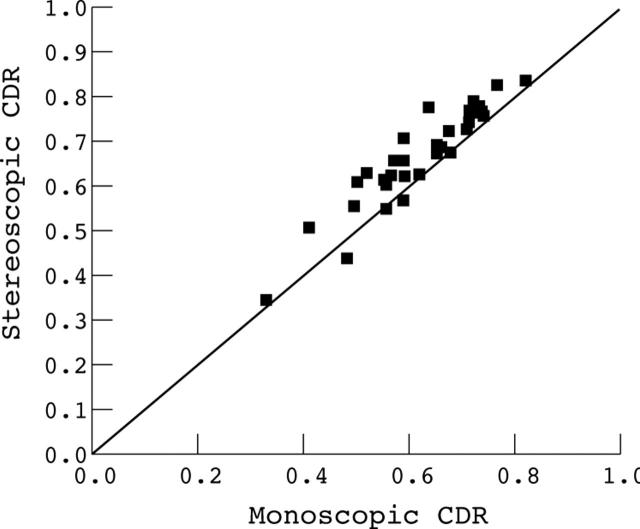
For monoscopic assessments, the mean CDRs for the three observers ranged from 0.57 to 0.66 (SD 0.13–0.14) compared with a 0.64 to 0.69 (SD 0.12–0.14) for the stereoscopic assessments. In figure 4 the mean stereoscopic CDRs (all observers, all locations around the disc, 35 discs) have been plotted against the corresponding monoscopic score showing that in the majority of cases the stereoscopic optic disc assessment provided a greater estimate of the CDR. Comparison within each observer showed this difference to be statistically significant at the 0.001 level (Mann Whitney test).
Figure 4.
Plot of mean stereoscopic neuroretinal rim assessment (as cup to disc ratio, CDR) against the mean monoscopic CDR assessment. Data from 35 eyes averaged for the three observers to give 35 data points.
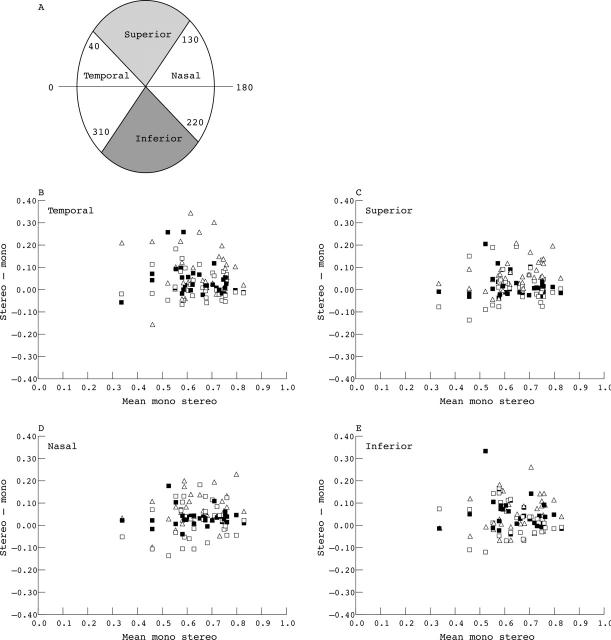
In figure 5 the difference in stereoscopic and monoscopic assessment has been plotted against the mean of the stereoscopic and monoscopic assessment for each sector around the optic disc (Altman and Bland plots,19 temporal, superior, nasal, and inferior). Positive differences in CDR estimate indicate a greater CDR estimate with stereoscopic compared with monoscopic viewing. It can be seen that for most assessments, the CDR estimate was greater when viewed stereoscopically compared with the monoscopic assessment. Although the monoscopic and stereoscopic assessment were statistically different for each segment (p<0.001, Mann Whitney), we did not find a significant difference between segments (ANOVA p = 0.40). Linear regression analysis suggests that the CDR assessment (stereoscopic) had minimal effect on the magnitude of the difference between stereoscopic and monoscopic assessment (r2 = 0.06, p<0.001, standardised coefficient beta = 0.27).
Figure 5.
Plot of the difference between stereoscopic and monoscopic optic disc assessments against the mean of the monoscopic and stereoscopic assessment. Symbols indicate the data from each observer. (A) Diagram showing angular subtense for each sector around the disc. (B) Temporal segment. (C) Superior segment. (D) Nasal segment. (E) Inferior segment.
The levels of intraobserver and interobserver differences and agreement for monoscopic and stereoscopic observations are shown in tables 1 and 2, respectively. For both monoscopic and stereoscopic assessments, intraobserver variation tended to be less than interobserver variation but this was not a marked effect. The intraclass correlation coefficient (ICC) for intraobserver agreements was calculated by comparison of measurements at the first and second examination sessions. The ICCs for interobserver agreements were based on observations made at the second examination session. For both monoscopic and stereoscopic observations the level of intraobserver agreement tended to be higher than interobserver agreement. One notable exception was that observer 3 had a lower level of intraobserver agreement for monoscopic observations compared with interobserver agreement with observer 2 (table 1). The level of interobserver agreement was greater with stereoscopic compared with monoscopic observations. This effect was also seen for the level of agreement between all three observers; for monoscopic assessments the ICC between all three observers was 0.63 (CI 0.35 to 0.77) compared with 0.74 (CI 0.65 to 0.80) for stereoscopic assessments, indicating good agreement with monoscopic assessment and substantial agreement with stereoscopic assessment.20
Table 1.
Monoscopic observations
| Observer 1 | Observer 2 | Observer 3 | ||||
| Observer 1 | ||||||
| Mean diffs* | 0.01 | |||||
| SD diff* | 0.09 | |||||
| Range* | 0.77 | |||||
| ICC* | 0.78 | |||||
| Observer 2 | ||||||
| Mean diffs† | −0.10 | Mean diffs* | 0.04 | |||
| SD diff† | 0.08 | SD diff* | 0.05 | |||
| Range† | 0.62 | Range* | 0.62 | |||
| ICC† | 0.63 | ICC* | 0.85 | |||
| Observer 3 | ||||||
| Mean diffs† | −0.10 | Mean diffs† | 0.00 | Mean diffs* | 0.12 | |
| SD diff† | 0.11 | SD diff† | 0.09 | SD diff* | 0.08 | |
| Range† | 0.73 | Range† | 0.62 | Range* | 0.61 | |
| ICC† | 0.53 | ICC† | 0.77 | ICC* | 0.55 | |
Summary of the difference between the observers for the estimation of CDR by monoscopic viewing. Mean diffs: mean differences are shown for CDR assessments at matched 10 degree intervals. SD diff: standard deviation of the difference between measurements. ICC: intraclass correlation coefficient. *Intraobserver comparison. †Interobserver comparisons.
Table 2.
Stereoscopic observations
| Observer 1 | Observer 2 | Observer 3 | ||||
| Observer 1 | ||||||
| Mean diffs* | 0.05 | |||||
| SD diff* | 0.08 | |||||
| Range* | 0.78 | |||||
| ICC* | 0.88 | |||||
| Observer 2 | ||||||
| Mean diffs† | −0.05 | Mean diffs* | 0.03 | |||
| SD diff† | 0.09 | SD diff* | 0.06 | |||
| Range† | 0.80 | Range* | 0.70 | |||
| ICC† | 0.71 | ICC* | 0.83 | |||
| Observer 3 | ||||||
| Mean diffs† | −0.04 | Mean diffs† | 0.01 | Mean diffs* | 0.06 | |
| SD diff† | 0.09 | SD diff† | 0.07 | SD diff* | 0.07 | |
| Range† | 0.80 | Range† | 0.66 | Range* | 0.66 | |
| ICC† | 0.72 | ICC† | 0.81 | ICC* | 0.74 | |
Summary of the difference between the observers for the estimation of CDR by stereoscopic viewing. Table layout as for table 1.
DISCUSSION
We have described the use of digital stereoscopic optic disc assessment or the estimation of neuroretinal rim width in normal and glaucomatous eyes. The principal findings of the study are, firstly, that we found high levels of interobserver agreement for neuroretinal rim width for both monoscopic and stereoscopic assessments—with agreement being higher for stereoscopic assessment. Secondly, we found that stereoscopic optic disc assessment provided higher estimates of CDR (and therefore a lower estimate of neuroretinal rim width) compared with monoscopic assessment.
The level of agreement for both monoscopic and stereoscopic assessment compares favourably with that obtained by expert observers21,22 and exceeds that previously reported for similar grade staff.3 We found that intraobserver agreement was greater than interobserver agreement and in both cases this improved with stereoscopic observations. Several factors may account for the high level of agreement. The stereoscopic cursor enables the precise delineation of the inner margin of the neuroretinal rim with reference to the plane of Elschnig’s rim. The inner border of the neuroretinal rim has conventionally been defined as the point at which the retina surface steepens or changes slope at the margin of the optic disc22–25 which is highly subjective. To our knowledge, ours is the first study in which software has been developed so that the cursor can be used at the level of interest within a stereoscopic image. As such, our software allowed the observers to minimise parallax errors in the measurement of neuroretinal rim width. Previous reports of digital stereoscopic disc analysis14 did not describe the use of stereoscopic cursors. With the Discam system a single cursor is used, which is projected on one of the stereoscopic images13 and cannot be adjusted to lie within the correct measurement plane. It is possible that the presentation of the cursor to a single eye may introduce effects such as rivalry,26 which could complicate further accurate stereoscopic measurements. These technical differences may account for the findings of Parkin et al,13 who did not report significant difference between monoscopic and stereoscopic assessments of neuroretinal rim width using the Discam stereoscopic disc imaging system but did note a trend for monoscopic rather than stereoscopic measurements to provide a higher estimate of CDR.
Another factor accounting for the high level of agreement between observers is that the observers could adjust their estimate of neuroretinal rim width using cursor bars whose length matched the width of the rim. The CDR value was generated by the computer and was not, therefore, a factor in intraobserver or interobserver variation.
The tendency for stereoscopic optic disc imaging to provide higher estimates of CDR (and therefore lower estimates of neuroretinal rim area) has previously been reported.22 These findings are consistent with the relation between the shape of the optic nerve and the underlying optic nerve head colour. A recent analysis of digital stereoscopic imaging revealed different results with monoscopic estimates for the CDR being greater than stereoscopic estimates13 is not consistent with this view. It is possible that it relates to the use of monochromatic images (Discam uses a 256 grey scale compared with 24 bit colour resolution used in the present study) which may have obscured subtle variations in optic nerve head pallor at the margin of the neuroretinal rim. Although the clinical relevance of the differences between monoscopic and stereoscopic assessment has yet to be established, it is likely that it will influence the sensitivity with which progressive glaucomatous damage can be detected; for eyes with a CDR of 0.7 a 0.1 difference represents 30% of the remaining neuroretinal rim. Our findings suggest that stereoscopic imaging will permit earlier detection of neuroretinal rim changes compared with monoscopic viewing.
Technical improvements in the quality of the stereoscopic display may also improve sensitivity for the detection of progressive damage. As with others14,15 we have employed a synchronised doubled digital stereoscopic system to develop our prototype display because software development is straightforward, does not require specialised graphics cards, and can be implemented on computers and monitors with low specification. Unfortunately, the vertical resolution of the stereoscopic pair images is reduced by 50% and the images are vertically offset by one scan line on the video monitor which results in a subtle degradation of the quality of the stereoscopic image. Higher resolution systems for the analysis of stereoscopic images are now available and are likely to supersede the above and below stereoscopic display format. With a suitable graphics card and a monitor with a refresh rate exceeding 100 Hz, it is possible to display right and left stereoscopic image pairs so that they occupy the same point in visual space on the monitor (so called quad buffered or page flipping technique) without the need for a small vertical offset. Image compression is not required so that images can be displayed at a higher resolution compared with interlaced displays. Another advantage of this technology is that it lends itself to the sequential analysis of aligned stereopairs for the detection progressive damage and will facilitate the clinical application of techniques such as stereochronoscopy.27,28
The final consideration in the assessment of the stereoscopic images is that we used sequential rather than simultaneous stereoscopic images. We selected this option since sequentially acquired views are those that are available in most clinics since they do not require specialised cameras or additional hardware. Our results should, therefore be applicable to routine clinical practice. Since simultaneous stereoscopic images generally provide higher quality stereoviews29 we predict that these would highlight greater differences between monoscopic and stereoscopic analysis. We anticipate that developments in digital stereoscopy could have a valuable role in the refinement of the diagnosis of glaucomatous optic neuropathy and in the detection of the progressive glaucomatous damage. Given the advances that have been made in other digital imaging modalities, it is likely that digital stereoscopy can be used as a useful adjunctive diagnostic tool.
Abbreviations
CDR, cup to disc ratio
ICC, intraclass correlation coefficient
IOP, intraocular pressure
LC, liquid crystal
Support: Welsh Office for Research and Development (WORD, UK).
Presented in part at the Association for Research in Vision and Ophthalmology, Fort Lauderdale, FL, USA, May 2000.
REFERENCES
- 1.Kamal DS, Viswanathan AC, Garway-Heath DF, et al. Detection of optic disc change with the Heidelberg retina tomograph before confirmed visual field change in ocular hypertensives converting to early glaucoma. Br J Ophthalmol 1999;83:290–4. [DOI] [PMC free article] [PubMed] [Google Scholar]
- 2.Lichter PR. Variability of expert observers in evaluating the optic disc. Trans Am Ophthalmol Soc 1976;74:532–72. [PMC free article] [PubMed] [Google Scholar]
- 3.Harper R, Reeves B, Smith G. Observer variability in optic disc assessment: implications for glaucoma shared care. Ophthalmic Physiol Opt 2000;20:265–73. [PubMed] [Google Scholar]
- 4.Weinreb R, Dreher A. Reproducibility and accuracy of topographic measurement of the optic nerve head with the laser tomographic scanner. In: Nasemann H, Burk R, eds. Scanning laser ophthalmoscopy and tomography. Munich: Quintessenz Verlags, 1990:177–82.
- 5.Dreher A, Reiter K. Retinal laser ellipsometry: a new method for measuring the retinal nerve fiber layer thickness distribution. Clin Vis Sci 1992;7:481–8. [Google Scholar]
- 6.Swanson EA, Izatt JA, Hee MR, et al. In vivo retinal imaging by optical coherence tomography. Optics Lett 1993;18:1864–6. [DOI] [PubMed] [Google Scholar]
- 7.Wollstein G, Garway-Heath D, Hitchings R. Identification of early glaucoma cases with the scanning laser ophthalmoscope. Ophthalmology 1998;105:1557–63. [DOI] [PubMed] [Google Scholar]
- 8.Caprioli J. Clinical evaluation of the optic nerve in glaucoma. Trans. Am Ophthalmol Soc 1994;XCII:590–641. [PMC free article] [PubMed] [Google Scholar]
- 9.Jonas JB, Budde WM, Panda-Jonas S. Ophthalmoscopic evaluation of the optic nerve head. Surv Ophthalmol 1999;43:293–320. [DOI] [PubMed] [Google Scholar]
- 10.Caprioli J. Discrimination between normal and glaucomatous eyes. Invest Ophthalmol Vis Sci 1992;33:153–9. [PubMed] [Google Scholar]
- 11.Greaney MJ, Hoffman DC, Garway-Heath DF, et al. Comparison of optic nerve imaging methods to distinguish normal eyes from those with glaucoma. Invest Ophthalmol Vis Sci 2002;43:140–5. [PubMed] [Google Scholar]
- 12.Gloster J, Parry DG. Use of photographs for measuring cupping in the optic disc. Br J Ophthalmol 1974;58:850–62. [DOI] [PMC free article] [PubMed] [Google Scholar]
- 13.Parkin B, Shuttleworth G, Costen M, et al. A comparison of stereoscopic and monoscopic evaluation of optic disc topography using a digital optic disc stereo camera. Br J Ophthalmol 2001;85:1347–51. [DOI] [PMC free article] [PubMed] [Google Scholar]
- 14.Yogesan K, Barry CJ, Jitskaia L, et al. Software for 3-D visualization/analysis of optic-disc images. IEEE Eng Med Biol Mag 1999;18:43–9. [DOI] [PubMed] [Google Scholar]
- 15.Eikelboom RH, Barry CJ, Jitskaia L, et al. Neuroretinal rim measurement error using PC-based stereo software. Clin Experiment Ophthalmol 2000;28:178–80. [DOI] [PubMed] [Google Scholar]
- 16.Shuttleworth GN, Khong CH, Diamond JP. A new digital optic disc stereo camera: intraobserver and interobserver repeatability of optic disc measurements. Br J Ophthalmol 2000;84:403–7. [DOI] [PMC free article] [PubMed] [Google Scholar]
- 17.McGraw K, Wong SP. Forming inferences about some intraclass correlation coefficients. Psychological Methods 1996;1:30–46. [Google Scholar]
- 18.Shrout P, Fleiss J. Intraclass correlations: uses in assessing rater reliability. Psychological Bulletin 1979;86:420–8. [DOI] [PubMed] [Google Scholar]
- 19.Bland M, Altman D. Statistical methods for assessing agreement between two methods of clinical measurement. Lancet 1986;1:307–10. [PubMed] [Google Scholar]
- 20.Landis JR, Koch GG. The measurement of observer agreement for categorical data. Biometrics 1977;33:159–74. [PubMed] [Google Scholar]
- 21.Tielsch JM, Katz J, Quigley HA, et al. Intraobserver and interobserver agreement in measurement of optic disc characteristics. Ophthalmology 1988;95:350–6. [DOI] [PubMed] [Google Scholar]
- 22.Varma R, Steinmann WC, Scott IU. Expert agreement in evaluating the optic disc for glaucoma. Ophthalmology 1992;99:215–21. [DOI] [PubMed] [Google Scholar]
- 23.Britton RJ, Drance SM, Schulzer M, et al. The area of the neuroretinal rim of the optic nerve in normal eyes. Am J Ophthalmol 1987;103:497–504. [DOI] [PubMed] [Google Scholar]
- 24.Garway-Heath D, Ruben S, Viswanathan A, et al. Vertical cup/disc ratio in relation to optic disc size: its value in the assessment of the glaucoma suspect. Br J Ophthalmol 1998;82:1118–24. [DOI] [PMC free article] [PubMed] [Google Scholar]
- 25.Garway-Heath DF, Hitchings RA. Quantitative evaluation of the optic nerve head in early glaucoma. Br J Ophthalmol 1998;82:352–61. [DOI] [PMC free article] [PubMed] [Google Scholar]
- 26.Harrad RA, McKee SP, Blake R, et al. Binocular rivalry disrupts stereopsis. Perception 1994;23:15–28. [DOI] [PubMed] [Google Scholar]
- 27.Heijl A, Bengtsson B. Diagnosis of early glaucoma with flicker comparisons of serial disc photographs. Invest Ophthalmol Vis Sci 1989;30:2376–84. [PubMed] [Google Scholar]
- 28.Berger JW, Patel TR, Shin DS, et al. Computerized stereochronoscopy and alternation flicker to detect optic nerve head contour change. Ophthalmology 2000;107:1316–20. [DOI] [PubMed] [Google Scholar]
- 29.Boes D, Spaeth G, Mills R, et al. Relative optic cup depth assessments using three stereo photograph viewing methods. J Glaucoma 1996;5:9–14. [PubMed] [Google Scholar]


