

Abstract
Aim: To compare the effectiveness of “light” versus “classic” laser photocoagulation in diabetic patients with clinically significant macular oedema (CSMO).
Methods: A prospective randomised pilot clinical trial in which 29 eyes of 24 diabetic patients with mild to moderate non-proliferative diabetic retinopathy (NPDR) and CSMO were randomised to either “classic” or “light” Nd:YAG 532 nm (frequency doubled) green laser. “Light” laser treatment differed from conventional (“classic”) photocoagulation in that the energy employed was the lowest capable to produce barely visible burns at the level of the retinal pigment epithelium. Primary outcome measure was the change in foveal retinal thickness as measured by optical coherence tomography (OCT); secondary outcomes were the reduction/elimination of macular oedema on contact lens biomicroscopy and fluorescein angiography, change in visual acuity, contrast sensitivity, and mean deviation in the central 10° visual field. Examiners were masked to patients’ treatment.
Results: 14 eyes were assigned to “classic” and 15 were assigned to “light” laser treatment. At 12 months, seven (50%) of 14 eyes treated with “classic” and six (43%) of 14 eyes treated with “light” laser had a decrease of foveal retinal thickness on OCT (p = 0.79). A comparison of reduction/elimination of oedema, visual improvement, visual loss, change in contrast sensitivity, and mean deviation in the central 10° showed no statistical difference between the groups at 12 months (p>0.05 for all groups).
Conclusions: This study suggests that “light” photocoagulation for CSMO may be as effective as “classic” laser treatment, thus supporting the rationale for a larger equivalence trial.
Keywords: clinically significant macular oedema, laser treatment
Macular oedema is the most common cause of visual loss in patients with diabetic retinopathy and its prevalence in the diabetic population has increased approximately fivefold over the past 10 years, from 0.4% to 2.1%.1
The Early Treatment Diabetic Retinopathy Study (ETDRS) demonstrated the benefit of a specific strategy of laser treatment on reducing the risk of moderate visual loss in eyes with clinically significant macular oedema (CSMO).2 Treatment with a grid pattern in the parafoveal region up to and including the edge of the foveal avascular zone in case of diffuse thickening has also been advocated in non-randomised series.3,4 However, the beneficial effect of laser photocoagulation is associated with severe destruction of retinal photoreceptors and considerable side effects, such as post-treatment atrophic scarring causing paracentral dense scotomas, generalised loss of the central 10° threshold sensitivity, choroidal neovascularisation, and subfoveal fibrosis.5,6,7,8,9,10,11 Moreover, a significant lateral spread of retinal pigment epithelium (RPE) atrophy may occur over time thus impairing visual function even if visual acuity (VA) is relatively preserved.8,12 These potential complications may also negatively affect the decision to apply additional laser treatments whenever required.
Recently, some authors have shown that barely perceivable very light threshold treatment and non-visible end point subthreshold treatment promoted resolution of CSMO in small uncontrolled series.13–15 This therapeutic effect has been correlated with the selective treatment of the RPE and subsequent restoration of its barrier function and production of growth factors.16–20 Among these, the pigment epithelium derived factor (PEDF) has been shown to have a strong antiangiogenic activity and to be upregulated after photocoagulation.21,22 Based on these data, conventional ETDRS-like laser burns may not be necessary in the treatment of CSMO.
When treating or re-treating eyes with CSMO and leaking abnormalities close to the foveal centre or diffuse macular thickening, very light laser burns may have the theoretic advantage of producing less invalidating paracentral scotomata or significant reduction in the central sensitivity. We present here results of a prospective, randomised pilot trial comparing the effectiveness of barely visible or “light” laser treatment versus conventional or “classic” laser photocoagulation in CSMO.
METHODS
Patients were enrolled from 1 September 2001 to 30 November 2002. Eligibility criteria included a diagnosis of either type 1 or type 2 diabetes mellitus and non-proliferative diabetic retinopathy with CSMO documented by slit lamp contact lens biomicroscopy, as defined by the ETDRS,3 and confirmed by optical coherence tomography (OCT). Increased macular thickness was established if the foveal thickness (FTH), defined as the mean thickness of the central 1 mm diameter disc of the retinal map, exceeded two SD the mean normal value (that is, >210 μm).23,24 Other inclusion criteria were haemoglobin A1c equal or less than 10%, diastolic blood pressure less than 90 mm Hg, and visual acuity of at least 20/200 on the ETDRS chart. Patients with previous laser treatment, proliferative diabetic retinopathy, history of retinal detachment, glaucoma or any other clinically relevant ocular disease, cataract extraction or lens implantation within the past 12 months, or significant media opacities were excluded. The study was conducted according to the tenets of the Declaration of Helsinki and all subjects gave informed consent after the intent of the study had been explained.
At the baseline examination, an independent examiner refracted both eyes, measured distance visual acuity and contrast threshold using ETDRS visual acuity chart at 4 metres and Pelli-Robson charts at 1 metre, respectively. Best corrected visual acuity was scored based on the total number of correct letters identified at 4 metres plus 30.25 The first examination also included automated static threshold perimetry, stereo fundus photography, fluorescein angiography (FA), and OCT. If FA disclosed a macular area of non-perfusion at least twice as large as the foveal avascular zone, patients were excluded from the study. Automated static threshold perimetry was performed using the Humphrey field analyser (Humphrey-Allergan Medical Instruments, Irvine, CA, USA) 10-2 program. The mean deviation (MD) over the central 10° was recorded. OCT scans were obtained using the OCT 2000 scanner (Zeiss Humphrey Instruments, Dublin, CA, USA) with the A5 version software. OCT scanning was performed by selecting the “radial lines” scan pattern, which acquires six linear scans 6 mm long centred on the fovea at equally spaced angular orientation. Acceptable scans were automatically analysed by the OCT computer software and retinal thickness maps were generated. Images were judged to be “acceptable” on the basis of the following acceptance criteria: good demarcation of the vitreoretinal and chorioretinal interface allowing for a correct identification of the two interfaces by the software and absence of artefacts caused by eye motion or unstable fixation. The FTH was recorded for analysis from the retinal thickness maps.
Patients who were believed to satisfy all eligibility criteria were assigned randomly at enrolment to receive “classic” or “light” laser treatment. If a patient had both eyes simultaneously eligible for the study, the right eye was assigned randomly to “classic” or “light” laser treatment and the left eye received the opposite assignment. All the visits and tests were performed by the same masked examiners (AP, MDB).
Photocoagulation was performed by the same surgeon (FB) using a Nd:YAG 532 nm (frequency doubled) green laser. “Light” laser treatment differed from “classic” in that the energy employed was the lowest capable to produce barely visible burns at the level of the retinal pigment epithelium. For primary treatment with “classic” photocoagulation, 47 (SD 26) spots were applied with power ranging between 100 mW and 250 mW (median 140 mW), and for primary treatment with “light” photocoagulation, 92 (SD 36) spots were applied with power ranging between 50 mW and 100 mW (median 50 mW). Follow up visits were performed every 3 months after treatment and included a protocol refraction, best corrected visual acuity and contrast threshold measurement, fundus biomicroscopy, FA, and OCT. Automatic static threshold perimetry of the central 10° was performed at the 3 month and 12 month follow up visit. Supplemental treatment with the same protocol of the primary treatment was considered at each visit in those eyes with treatable lesions on FA and either increased foveal thickening on fundus examination or persistent foveal thickening and decreased vision. For supplemental treatment, 45 (SD 10) spots were applied in “classic” group, and 106 (SD 44) spots were applied in the “light” group. The study included all patients who completed the 12 month follow up examination.
The primary efficacy outcome was the proportion of patients with significant decrease in FTH on OCT retina thickness maps. A significant change in FTH was defined as a change greater than 10%, which is slightly higher than the reproducibility of the instrument (that is, reproducibility of plus or minus 6%)26 in an attempt to exclude changes caused by spontaneous inter-visit variability. Secondary efficacy outcomes included the proportion of patients with reduction elimination of CSMO on biomicroscopy and fluorescein leakage on FA compared with baseline examination at 3, 6, and 12 months after study entry, the proportion of eyes that experienced a visual gain or loss of five or more letters (approximately one line) on the ETDRS chart, mean changes in visual acuity, contrast threshold, MD of the central 10° sensitivity, and number of local losses greater than 5 dB at each test point of the central 10°, suggestive of post-treatment scotomata.
Comparison between groups for categorical variables was performed with χ2 test; when assumptions for χ2 test were not verified, Fisher’s exact test was used. The normality of continuous variables distributions was checked by the Shapiro-Wilk test. Comparisons between groups for continuous variables were performed with t test or the Mann-Whitney U test depending on Shapiro-Wilk test results. Comparisons within groups for continuous variables on differences from baseline were performed with paired t test or Wilcoxon test also depending on Shapiro-Wilk test results. All analyses were performed using the statistical software SPSS version 11.1.
RESULTS
A total of 29 eyes of 24 patients were assigned randomly to “classic” or “light” laser photocoagulation; 14 eyes were assigned to “classic” and 15 to “light” laser treatment. Five patients were treated bilaterally and 19 patients were treated unilaterally. OCT data were not available for one eye in the “light” group; therefore it was excluded from OCT data analysis. Baseline variables for each group are given in table 1. Systemic, functional, and morphological characteristics were similar and not statistically different between the two groups. Table 2 summarises the results at 12 months for individual patients. Table 3 compares the outcome measurements at 3, 6, and 12 months between the two study groups. No statistically significant differences could be found for any of the outcome measurements except for the proportions of eyes that experienced a visual gain of five or more letters at 6 months, which was larger in the “light” group. The average FTH in both groups did not change significantly from baseline at any follow up visit. The initial median visual acuity of 20/32 in both groups remained unchanged at 12 months. At the 3, 6, and 12 month follow up, five (36%), seven (50%), and seven (50%) of 14 eyes treated with “classic” and four (29%), six (43%), and six (43%) of 14 eyes treated with “light” laser had a decrease of FTH on OCT (p = 1, 0.50 and 0.79, respectively, Fisher’s exact test). At 12 month follow up, five (36%) of 14 eyes treated with “classic” and five (33%) of 15 eyes treated with “light” laser showed one line or more improvement in the visual acuity and two (14%) in the “classic” group and two (13%) eyes in the “light” group showed one line or more decrease in the visual acuity (p = 1, Fisher’s exact test). The average MD decrease over the central 10° at 12 months after “classic” and “light” laser treatment was 0.04 (SD 1.39) dB and 0.03 (SD 1.84) dB, respectively (p = 0.99, independent samples test). The number of local losses greater than 5 dB at each test point of the central 10°, suggestive of post-treatment paracentral scotomata, was 5.00 and 4.78 in the “classic” and “light” laser treatment group, respectively, at 12 months (p = 0.40, Mann-Whitney U test). One and three eyes were retreated at 3 months and four and three eyes at 6 months in the “classic” and “light” treatment group, respectively (p = 0.60 and 0.68, respectively, Fisher’s exact test).
Table 1.
Baseline characteristics*
| Characteristics | “Classic” treatment (n = 14) | “Light” treatment (n = 15) | p Value |
| Age (mean (SD)) | 63.71 (6.53) | 63.40 (7.26) | 0.90 |
| Sex | |||
| Female (%) | 5 (36) | 5 (33) | 1 |
| Male (%) | 9 (64) | 10 (67) | |
| Visual acuity | |||
| Mean No (SD) of letters read (approximate Snellen equivalent) | 74.64 (9.79) (20/32) | 76.73 (5.80) (20/32) | 0.81 |
| >20/32 | 7 (50) | 6 (40) | 0.31 |
| 20/32-20/40 | 4 (29) | 8 (53) | |
| <20/40 | 3 (21) | 1 (7) | |
| History of hypertension | |||
| Present | 8 (57) | 9 (60) | 0.88 |
| Not present | 6 (43) | 6 (40) | |
| Systemic vascular disease | |||
| Present | 1 (7) | 1 (7) | 1 |
| Not present | 13 (93) | 14 (93) | |
| Type of diabetes | |||
| 1 | 0 (0) | 0 (0) | |
| 2 | 14 (100) | 15 (100) | |
| Duration of diabetes (SD) (years) | 9.36 (5.86) | 10.00 (5.79) | 0.77 |
| Insulin treatment | 5 | 4 | 0.60 |
| HbA1c (SD) (%) | 7.5 (1.4) | 7.7 (2.1) | 0.79 |
| Mean deviation of central 10-2 test (SD) (dB) | −3.23 (2.96) | −3.51 (1.83) | 0.76 |
| Foveal thickness on OCT (SD) (μm) | 360.36 (115) | 322.93 (96) | 0.54 |
| Mean contrast sensitivity, No (SD) of letters | 31.71 (3.97) | 33.36 (2.24) | 0.98 |
*Data are given as number (%) of patients
Table 2.
Details of the patients who underwent “classic” and “light” treatment
| Patient | Age | Sex | Initial visual acuity | No of letters gained/lost | Initial foveal thickness | Final foveal thickness | Change in foveal thickness on OCT | Reduction/resolution of CSMO on slit lamp | Reduction/resolution of leakage on FA | Re-treatment |
| (A) “Classic” treatment group | ||||||||||
| 1 | 61 | M | 20/100 | 15 | 510 | 367 | Decreased | Yes | Yes | |
| 2 | 75 | F | 20/32 | −1 | 400 | 433 | No | No | No | Yes (1 year) |
| 3 | 54 | M | 20/25 | 1 | 236 | 290 | Increased | No | Yes | |
| 4 | 68 | F | 20/62.5 | 14 | 384 | 298 | Decreased | Yes | Yes | |
| 5 | 60 | M | 20/32 | 9 | 275 | 237 | Decreased | Yes | Yes | |
| 6 | 66 | F | 20/25 | −8 | 324 | 306 | No | Yes | Yes | |
| 7 | 68 | F | 20/25 | −2 | 216 | 340 | Increased | No | Yes | Yes (1 year) |
| 8 | 55 | M | 20/50 | −9 | 555 | 306 | Decreased | Yes | Yes | Yes (6 months) |
| 9 | 61 | M | 20/20 | 0 | 292 | 284 | No | Yes | Yes | |
| 10 | 64 | M | 20/25 | 2 | 241 | 240 | No | Yes | Yes | |
| 11 | 76 | M | 20/25 | 2 | 322 | 406 | Increased | No | No | Yes (1 year) |
| 12 | 58 | M | 20/40 | 10 | 291 | 237 | Decreased | Yes | Yes | |
| 13 | 62 | M | 20/40 | 0 | 500 | 218 | Decreased | Yes | No | |
| 14 | 64 | F | 20/25 | 0 | 499 | 412 | Decreased | Yes | No | Yes (1 year) |
| (B) “Light” treatment group | ||||||||||
| 1 | 61 | M | 20/32 | −4 | 449 | 550 | Increased | No | Yes | Yes (6 months) |
| 2 | 59 | M | 20/20 | −1 | 266 | 400 | Increased | No | No | Yes (1 year) |
| 3 | 56 | F | 20/40 | 2 | 278 | 253 | No | No | Yes | |
| 4 | 60 | M | 20/25 | 5 | 356 | 278 | Decreased | No | Yes | |
| 5 | 60 | M | 20/32 | 6 | 306 | 240 | Decreased | Yes | No | |
| 6 | 63 | M | 20/20 | 0 | NA | NA | NA | No | No | |
| 7 | 56 | M | 20/20 | 1 | 237 | 234 | No | Yes | Yes | |
| 8 | 68 | F | 20/25 | −8 | 345 | 428 | Increased | No | No | Yes (6 months) |
| 9 | 63 | F | 20/32 | 10 | 258 | 173 | Decreased | Yes | Yes | |
| 10 | 55 | M | 20/62.5 | 6 | 588 | 268 | Decreased | Yes | Yes | Yes (6 months) |
| 11 | 74 | F | 20/40 | 1 | 305 | 501 | Increased | No | No | Yes (1 year) |
| 12 | 76 | M | 20/32 | −15 | 371 | 579 | Increased | No | No | Yes (1 year) |
| 13 | 77 | M | 20/32 | −1 | 301 | 271 | Decreased | No | Yes | |
| 14 | 58 | F | 20/40 | 11 | 211 | 183 | Decreased | Yes | Yes | |
| 15 | 65 | M | 20/25 | −1 | 320 | 322 | No | No | Yes | |
CSMO, clinically significant macular oedema ; FA, fluorescein angiography.
Table 3.
Outcome measurements by time and treatment group*
| Characteristics | 3 months | 6 months | 12 months | |||
| “Classic” (n = 14) | “Light” (n = 15) | “Classic” (n = 14) | “Light” (n = 15) | “Classic” (n = 14) | “Light” (n = 15) | |
| Change in FTH on OCT | Light (n = 14) | Light (n = 14) | Light (n = 14) | |||
| Decreased | 5 (36) | 4 (29) | 7 (50) | 6 (43) | 7 (50) | 6 (43) |
| Unchanged | 7 (50) | 8 (57) | 5 (43) | 3 (21) | 4 (29) | 3 (21) |
| Increased | 2 (14) | 2 (14) | 2 (14) | 5 (36) | 3 (21) | 5 (36) |
| p Value† | 1 | 0.50 | 0.79 | |||
| Mean (SD) change in FTH(μm) (post-treatment value minus pretreatment value) | −48.21 (88) | −15.86 (46) | −63.78 (105) | −14.86 (85) | −47.86 (121) | 6.36 (135) |
| p Value‡ | 0.232 | 0.189 | 0.274 | |||
| Change in CSMO on biomicroscopy | ||||||
| Reduced/eliminated | 8 (57) | 4 (26) | 7 (50) | 5 (33) | 10 (71) | 5 (33) |
| Increased | 0 (0) | 1 (7) | 0 (0) | 2 (13) | 2 (14) | 2 (13) |
| p Value† | 0.19 | 0.54 | 0.09 | |||
| Reduction/resolution of leakage on FA | 8 (57) | 9 (56) | 11 (79) | 10 (63) | 10 (71) | 9 (56) |
| p Value† | 0.96# | 0.68 | 0.70 | |||
| Change in visual acuity | ||||||
| ⩾5 letters increase | 4 (29) | 3 (20) | 2 (14) | 7 (47) | 5 (36) | 5 (33) |
| No change | 8 (57) | 12 (80) | 12 (86) | 6 (40) | 7 (50) | 8 (53) |
| ⩾5 letters decrease | 2 (14) | 0 (0) | 0 (0) | 2 (12) | 2 (14) | 2 (13) |
| p Value† | 0.29 | 0.03 | 1 | |||
| Mean (SD) change in No of letters (post-treatment value minus pre-treatment value) | 2.00 (5.22) | 0.80 (3.36) | 1.93 (4.56) | 2.27 (5.75) | 3.07 (6.50) | 0.80 (6.82) |
| p Value‡ | 0.46 | 0.86 | 0.37 | |||
| Mean (SD) change in mean deviation of central 10° sensitivity (post-treatment value minus pretreatment value) | −0.81 (1.61) | −0.66 (1.39) | −0.04 (1.39) | −0.03 (1.84) | ||
| p Value‡ | 0.82 | 0.99 | ||||
| Mean No (SD) of scotomata | 7.92 (6.76) | 7.28 (6.63) | 5.00 (4.96) | 4.78 (5.87) | ||
| p Value§ | 0.63 | 0.40 | ||||
| Change (SD) in contrast sensitivity (No of letters) | −0.36 (2.50) | −0.07 (1.62) | −0.71 (2.84) | −0.40 (2.67) | −1.21 (3.51) | −0.27 (2.76) |
| p Value§ | 0.75 | 0.85 | 0.56 | |||
| No of eyes retreated | 0 | 0 | 1 (7) | 3 (20) | 4 (29) | 3 (20) |
| p Value† | 0.60 | 0.68 | ||||
*Data are given as number (%) of patients except where noted.
†Calculated with the Fisher’s exact test.
‡Calculated with the t test.
§Calculated with the U-Mann Whitney test.
CASE REPORT
A 55 year old man presented with a 8 year history of type 2 diabetes mellitus and non-proliferative diabetic retinopathy in both eyes. On examination, his visual acuity was 20/50 in the right eye and 20/64 in the left eye. Fundus biomicroscopy revealed diffuse retinal thickening in both eyes (figs 1A, 2A). FA showed extensive perifoveal leaking microaneurysms bilaterally (figs 1B, 2B). OCT retina thickness maps were similar in both eyes and displayed severe diffuse macular thickening (figs 1C, 2C). Two sessions of “classic” and “light” laser treatment were applied to the right and left eye, respectively, at study entry and after 6 months. The degree and extent of retinal and RPE whitening produced by laser burns, which were greater in the right eye, were documented immediately after the first laser session by red-free photographs (figs 1D, 2D). One year later his visual acuity had decreased to 20/80 in the right eye and improved to 20/50 in the left eye. The fundus examination disclosed marked decrease in foveal thickness in both eyes and multiple laser scars, which where more prominent and partly hyperpigmented in the right eye (fig 1E). FA disclosed a significant reduction of late leakage in both eyes (figs 1F, 2F). The OCT retinal thickness map documented a marked decrease of foveal thickening bilaterally (figs 1G, 2G). The central 10° MD decreased from −5.4 dB to −3.45 dB in the right eye and from −5.9 dB to −3.60 dB in the left eye (figs 1H, 2H). The number of paracentral scotomata was six and two in the right and left eye, respectively.
Figure 1.
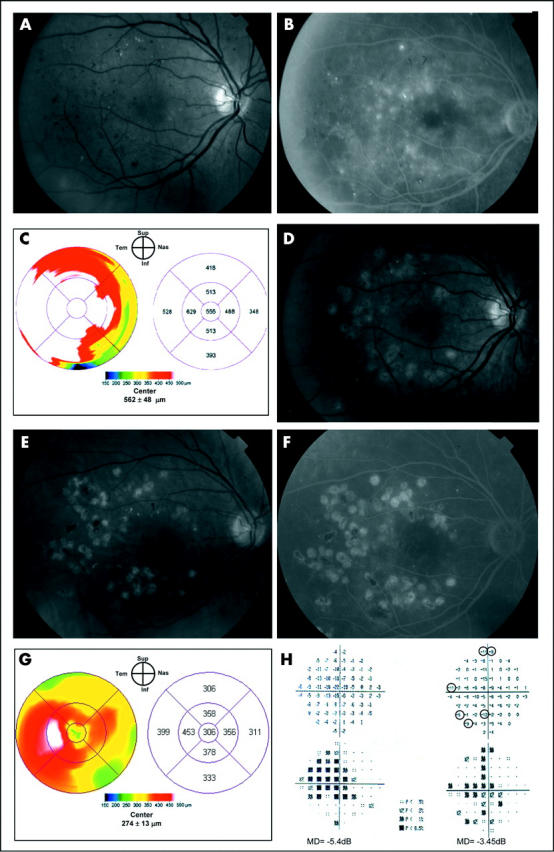
Case report, right eye. Clinically significant macular oedema before and after “classic” laser treatment. (A) Fundus photograph. (B) Fluorescein angiography shows late leakage surrounding the fovea. (C) OCT retina thickness map shows severe diffuse macular thickening. (D) Red-free photograph immediately after “classic” laser treatment demonstrates multiple, ETDRS level grey-white burns applied to the areas of fluorescein leakage. (E) Fundus photograph 1 year after treatment shows multiple laser scars associated with several areas of hyperpigmentation. (F) Late phase fluorescein angiogram obtained 1 year after treatment demonstrates only minimal residual leakage temporal to the fovea. (G) OCT retina thickness map at 1 year shows a significant decrease in foveal thickening with minimal residual thickening temporal to the fovea. (H) “Total deviation” display of the central 10° visual field before (left) and 1 year after laser treatment (right). A mean deviation (MD) decrease from −5.4 dB to −3.45 dB and six scotomata (focal losses greater than 5 dB, indicated by circles) mostly located on the nasal hemifield can be observed at 1 year.
Figure 2.
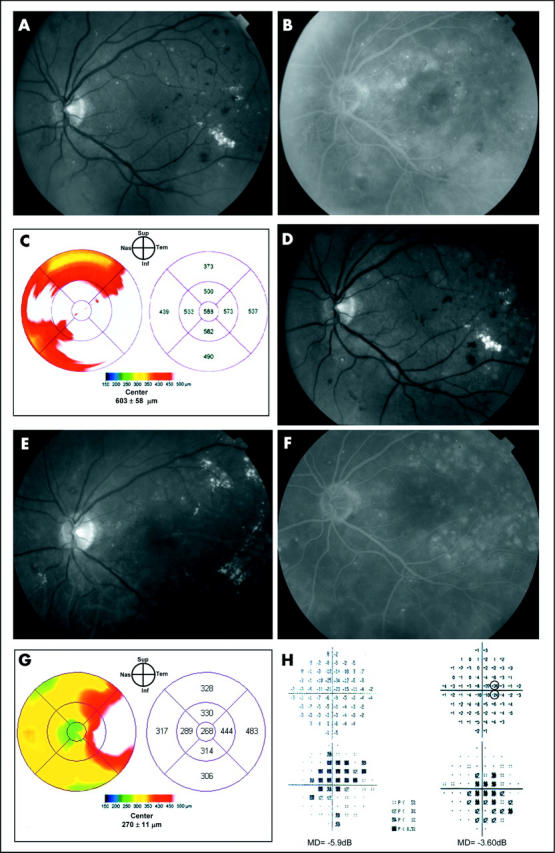
Case report, left eye. Clinically significant macular oedema before and after “light” laser treatment. (A) Fundus photograph. (B) Fluorescein angiography reveals areas of focal and diffuse leakage. (C) OCT retina map demonstrates severe diffuse macular thickening. The topographic pattern of retinal thickening was very similar to the other eye. (D) Immediate post-“light” laser treatment photograph demonstrates barely visible laser lesions. (E) and (F) Fundus photograph and late phase fluorescein angiogram obtained 1 year after treatment show very faint laser scar and significant reduction in fluorescein leakage. (G) 1 year after “light” laser treatment the oedema is almost completely resolved in the central fovea and residual thickening temporal to the fovea is present. (H) “Total deviation” display of the central 10° visual field before (left) and 1 year after laser treatment (right). A mean deviation (MD) decrease from −5.9 dB to −3.6 dB and two scotomata (focal losses greater than 5 dB, indicated by circles) both located on the nasal hemifield can be seen at 1 year.
DISCUSSION
Recent reports have suggested that the energy employed by the ETDRS in patients with CSMO may not be necessary to obtain a therapeutic effect and that these patients may be overtreated.13–15 We designed this prospective, randomised pilot trial specifically to determine whether a significant difference existed between “classic” and “light” laser photocoagulation for CSMO and to assess the feasibility of a definite trial. Since visual acuity remains stable for a rather long time in the majority of patients with CSMO, regardless of treatment, the detection of small differences in the proportions of eyes losing vision requires large sample sizes and a long follow up time. Therefore, we used as our primary outcome a morphological parameter, which has been shown by the ETDRS to be useful in demonstrating a beneficial treatment effect. Biomicroscopic/photographic evaluation of macular oedema is semi-quantitative at best, while OCT retinal thickness measurements are objective, quantitative, and reproducible.26–29 In our study, OCT examinations were performed at every visit by an experienced independent examiner who accepted only scans fulfilling well defined acceptance criteria. Since it has been shown that in eyes undergoing grid laser photocoagulation the average threshold sensitivity across the central 10° significantly decreases,5 we also measured the perimetric central sensitivity in order to identify theoretical differences of the effect of the two treatments on the central visual field.
The results of this randomised trial suggest that there is no significant difference between eyes with CSMO treated with either “classic” or “light” laser treatment within the first year. However, it is possible that significant differences might have been identified if a larger sample was used or follow up was continued beyond 1 year. In particular, the greater gain in mean number of letters, larger decrease in mean FTH, and greater proportion of eyes with reduction in CSMO on biomicroscopy in the “classic” group at 1 year, though not reaching statistical significance, may suggest a trend towards a larger beneficial effect from “classic” treatment. On the other hand, a significantly larger number of patients experiencing a visual gain in the “light” group at 6 months may suggest an earlier benefit from this treatment, which might decrease after 6 months. Also, the failure to detect a significant difference in change in MD from baseline and in number of scotomata between the two treatment groups at 1 year could depend upon the fact that the central 10° sensitivity showed no significant decrease following “both” laser treatments, in contrast with the findings reported by Striph et al.5 This may be because of the application of “lighter” intensity and fewer burns even in the “classic” group either because of a different technique or because fewer eyes with diffuse CSMO requiring extensive treatment were included in our study. Moreover, a more sensitive test, such as the microperimetry, might have been better in identifying differences between treatments in terms of focal losses on the visual field, since the point density of the central 10-2 test may not be sufficient to detect all the localised defects.
We also found a discrepancy between the number of eyes with reduction of CSMO based on biomicroscopic examination and OCT in the “classic” group. This finding was the result of the resolution of paracentral oedema and persistence of central foveal thickening in three patients (patients 6, 9, 10, in table 2), as confirmed by reviewing their retinal thickness maps, which revealed a marked decrease in the paracentral areas of the map but not in the central region.
In conclusion, this study, although underpowered and unlikely to yield definite conclusions as most pilot trials, seems to rule out large differences between the two treatments. Given the potential complications from the “classic” ETDRS level treatment, in particular the relatively high risk of invalidating paracentral scotomata, lighter intensity laser modalities should be investigated. Our preliminary data, suggesting a similar therapeutic effect between “classic” and “light” laser treatment, supports the further investigation of “light” laser photocoagulation with a larger equivalence trial.
Abbreviations
CSMO, clinically significant macular oedema
ETDRS, Early Treatment Diabetic Retinopathy Study
FA, fluorescein angiography
FTH, foveal thickness
MD, mean deviation
NPDR, non-proliferative diabetic retinopathy
OCT, optical coherence tomography
PEDF, pigment epithelium derived factor
RPE, retinal pigment epithelium
VA, visual acuity
REFERENCES
- 1.Lee PP, Feldman ZW, Ostermann J, et al. Longitudinal prevalence of major eye diseases. Arch Ophthalmol 2003;121:1303–10. [DOI] [PubMed] [Google Scholar]
- 2.Early Treatment Diabetic Retinopathy Study Research Group. Photocoagulation for diabetic macular edema. Early Treatment Diabetic Retinopathy Study report number 1. Arch Ophthalmol 1985;103:1796–806. [PubMed] [Google Scholar]
- 3.Lee CM, Olk RJ. Modified grid laser photocoagulation for diffuse diabetic macular edema. Long-term visual results. Ophthalmology 1991;98:1594–602. [DOI] [PubMed] [Google Scholar]
- 4.Akduman L, Olk RJ. Diode laser (810 nm) versus argon green (514 nm) modified grid photocoagulation for diffuse diabetic macular edema. Ophthalmology 1997;104:1433–41. [DOI] [PubMed] [Google Scholar]
- 5.Striph GG, Hart WM Jr, Olk RJ. Modified grid laser photocoagulation for diabetic macular edema. The effect on the central visual field. Ophthalmology 1988;95:1673–9. [DOI] [PubMed] [Google Scholar]
- 6.Sinclair SH, Alaniz R, Presti P. Laser treatment of diabetic macular edema: comparison of ETDRS-level treatment with threshold-level treatment by using high-contrast discriminant central visual field testing. Sem Ophthalmol 1999;4:214–22. [DOI] [PubMed] [Google Scholar]
- 7.Hudson C, Flanagan JG, Turner GS, et al. Influence of laser photocoagulation for clinically significant diabetic macular edema (DMO) on short-wavelenght and conventional automated perimetry. Diabetologia 1998;41:1283–92. [DOI] [PubMed] [Google Scholar]
- 8.Schatz H, Madeira D, McDonald HR, et al. Progressive enlargement of laser scars following grid laser photocoagulation for diffuse diabetic macular edema. Arch Ophthalmol 1991;109:1549–51. [DOI] [PubMed] [Google Scholar]
- 9.Lewis H, Schachat AP, Haimann MH, et al. Choroidal neovascularization after laser photocoagulation for diabetic macular edema. Ophthalmology 1990;97:503–10. [DOI] [PubMed] [Google Scholar]
- 10.Guyer DR, D’Amico DJ, Smith CW. Subretinal fibrosis after laser photocoagulation for diabetic macular edema. Am J Ophthalmol 1992;113:652–6. [DOI] [PubMed] [Google Scholar]
- 11.Han DP, Mieler WF, Burton TC. Submacular fibrosis after photocoagulation for diabetic macular edema. Am J Ophthalmol 1992;113:513–21. [DOI] [PubMed] [Google Scholar]
- 12.Mainster MA, White TJ, Tips JH, et al. Retinal-temperature increases produced by intense light sources. J Opt Soc Am 1970;60:264–70. [DOI] [PubMed] [Google Scholar]
- 13.Friberg TR, Karatza EC. The treatment of macular disease using a micropulsed and continuous wave 810-nm diode laser. Ophthalmology 1997;104:20–308. [DOI] [PubMed] [Google Scholar]
- 14.Roider J, Brinkmann R, Wirbelauer C, et al. Subthreshold (retinal pigment epithelium) photocoagulation in macular diseases: a pilot study. Br J Ophthalmol 2000;84:40–7. [DOI] [PMC free article] [PubMed] [Google Scholar]
- 15.Moorman CM, Hamilton AM. Clinical applications of the MicroPulse diode laser. Eye 1999;13:145–150. [DOI] [PubMed] [Google Scholar]
- 16.Bresnick GH. Diabetic maculopathy. A critical review highlighting diffuse macular edema. Ophthalmology 1983;90:1301–17. [DOI] [PubMed] [Google Scholar]
- 17.Wallow IH, Bindley CD. Focal photocoagulation of diabetic macular edema. A clinicopathologic case report. Retina 1988;8:261–9. [DOI] [PubMed] [Google Scholar]
- 18.Del Priore LV, Glaser BM, Quigley HA, et al. Response of retinal pigment epithelium to laser photocoagulation in organ culture. Arch Ophthalmol 1989;107:119–22. [DOI] [PubMed] [Google Scholar]
- 19.Marshall J, Clover G, Rothtery S. Some new findings of retinal irradiation by krypton and argon lasers. In: Birngruber R, Gabel V-P, eds. Laser treatment and photocoagulation of the eye. Doc Ophthalmol Proc Series 36. The Hague: Junk, 1984:21–37.
- 20.Roider J, Michaud N, Flotte T, et al. Response of the RPE to selective photocoagulation of the RPE by repetitive short laser pulses. Arch Ophthalmol 1992;110:1786–92. [DOI] [PubMed] [Google Scholar]
- 21.Dowson DW, Volpert OV, Gillis P, et al. Pigment epithelium-derived factor: a potent inhibitor of angiogenesis. Science 1999;285:245–8. [DOI] [PubMed] [Google Scholar]
- 22.Ogata N, Tombran-Tink J, Jo N, et al. Upregulation of pigment epithelium-derived factor after laser photocoagulation. [DOI] [PubMed]
- 23.Hee MR, Puliafito C, Duker JS, et al. Topography of diabetic macular edema with optical coherence tomography. Ophthalmology 1998;105:360–70. [DOI] [PMC free article] [PubMed] [Google Scholar]
- 24.Massin P, Erginay A, Haouchine B, et al. Retinal thickness in healthy and diabetic subjects measured using optical coherence tomogroaphy mapping software. Eur J Ophthalmol 2002;12:102–8. [DOI] [PubMed] [Google Scholar]
- 25.Ferris FL 3rd, Kassoff A, Bresnick GH, et al. New visual acuity charts for clinical research. Am J Ophthalmol 1982;94:91–6. [PubMed] [Google Scholar]
- 26.Massin P, Vicaut E, Haouchine B, et al. Reproducibility of retinal mapping using optical coherence tomography. Arch Ophthalmol 2001;119:1135–42. [DOI] [PubMed] [Google Scholar]
- 27.Chauhan DS, Marshall J. The interpretation of optical coherence tomography images of the retina. Invest Ophthalmol Vis Sci 1999;40:2332–42. [PubMed] [Google Scholar]
- 28.Polito A, Shah SM, Haller JA, et al. Comparison between retinal thickness analyzer and optical coherence tomography for assessment of foveal thickness in eyes with macular disease. Am J Ophthalmol 2002;134:240–51. [DOI] [PubMed] [Google Scholar]
- 29.Browning DJ, McOwen MD, Bowen R, et al. Comparison of the clinical diagnosis of diabetic macular edema with diagnosis by optical coherence tomography. Ophthalmology 2004;111:712–15. [DOI] [PubMed] [Google Scholar]