Abstract
Background: The diagnosis of idiopathic central serous retinopathy (CSR) is usually based on biomicroscopy and fluorescein angiography (FA). The optical coherence tomography (OCT) ophthalmoscope produces en face OCT scans (OCT C-scans) and provides additional information not readily available by conventional imaging techniques. The authors describe the characteristic features observed in patients with a clinical diagnosis of CSR using the OCT ophthalmoscope.
Methods: 38 eyes with a clinical diagnosis of CSR, seen at the Academic Medical Centre (Amsterdam, Netherlands) and the New York Eye and Ear Infirmary (New York, USA) between August 2002 and March 2004, were evaluated with standard digital FA and scanned with the OCT ophthalmoscope.
Results: Nine of 38 eyes had no serous neurosensory detachment (inactive CSR) when scanned with the OCT ophthalmoscope. Characteristics for active CSR (n = 29) were large neurosensory detachment (23/29), subretinal hyper-reflective deposits (20/29), and pigment epithelial detachment (15/29). One third of the patients, either active or inactive, had multiple small pigment epithelial detachments located both within and outside the neurosensory detachment.
Conclusion: The OCT ophthalmoscope provides complementary morphological information on patients with CSR. The presence of more diffuse retinal pigment epithelium (RPE) changes lends further support to the concept that CSR is a diffuse rather than localised RPE anomaly.
Keywords: central serous retinopathy, optical coherence tomography, pigment epithelial detachment
Idiopathic central serous (chorio)retinopathy (CSR) is a common clinical diagnosis, especially in young to middle aged adults. CSR is characterised by an idiopathic detachment of the neurosensory retina in the macular area, secondary to one or more retinal pigment epithelium (RPE) leakage points observed on fluorescein angiography (FA). Usually, the neurosensory detachment resolves spontaneously within a few months.1 When required, focal leak points in the RPE can be treated by photocoagulation2 or by photodynamic therapy.3–5
A diagnosis of CSR is usually established by biomicroscopy and confirmed by FA. However, optical coherence tomography (OCT) can serve as a complementary diagnostic tool for FA while providing additional information on the presence of subretinal fluid, retinal thickening, and pigment epithelial detachments (PED).6–9 It can also be useful in monitoring patients with CSR without the use of invasive FA.
The en face OCT ophthalmoscope, combining OCT and confocal ophthalmoscopy, provides information not readily available in conventional longitudinal OCT scans. It produces so called OCT C-scans, that give an instant overview of pathological changes present in the central macula as a two dimensional transversal slice at any given depth through the retina.10–12 The confocal image which has pixel to pixel correspondence with the OCT image allows for an accurate comparison between different types of examinations. In this article, we evaluate patients with a clinical diagnosis of CSR using en face OCT, describe the characteristic OCT features observed in CSR in both longitudinal and transversal OCT scan mode, and determine their prevalence.
PATIENTS AND METHODS
Patients diagnosed with CSR were examined with a prototype OCT ophthalmoscope (Ophthalmic Technologies Inc, Toronto, Canada) between August 2002 and March 2004 at the Academic Medical Centre, University Hospital, Amsterdam (Netherlands) and the New York Eye and Ear Infirmary, New York (USA). Ethics committee approval was obtained. CSR was defined as an idiopathic serous detachment of the neurosensory retina in the macular area as seen by slit lamp examination, accompanied by pigment epithelial changes, and/or focal or diffuse leakage through the RPE as seen in FA.1 FA was obtained in all patients, except in two pregnant women, using Imagenet (Topcon TRC 501X Retinal Camera, USA). Major demographics (age, sex, best corrected visual acuity (BCVA)) were also recorded.
All patients underwent at least one examination with the OCT ophthalmoscope. The prototype OCT ophthalmoscope system has been described in detail in previous reports.10,11,13 In short, the system uses a super luminescent diode emitting at a central wavelength of 820 nm (20 nm band width). The light beam is split, directing one part to the patient’s eye (sample arm) and the other part to the reference arm (mirror). The returning light beams from both the patient’s eye and the reference arm are collected through an interferometer to produce the OCT signal.12 A fraction of the light returning from the patient’s eye is also directed towards another detector to produce a confocal signal.12 The OCT ophthalmoscope produces a transversal OCT scan, currently at two frames/second, in the X-Y plane at a fixed Z-coordinate.14 By changing the Z-coordinate, OCT C-scans are taken at different depths in the retina, and a stack of 30–60 OCT C-scans is compiled over a depth range of 1.5 mm. The OCT ophthalmoscope is also able to produce a longitudinal B-scan by making en face A-scans along a fixed line in the X-Y plane and continuously moving the Z-coordinate. The images are visualised on a personal computer as grey scale. Depth and transversal resolution of the images is 10–15 µm.13
The following features could be documented with the OCT C-scan images: size and location of serous detachment, presence of hyper-reflective deposits, presence of thickened fibrinous fluid; presence, size, location, and number of PED. In patients who were scanned more than once, the OCT C-scan images from consecutive visits were analysed and compared.
Anatomical changes identified on the OCT C-scans were correlated with sites of fluorescein angiographic leakage using a software assisted overlay technique.14a Briefly, a characteristic mid-phase fluorescein image was selected, spatially transformed to the confocal image using the vascular arcades as reference, duplicated, and combined in an RGB image. Through pixel to pixel correspondence of the confocal image with the OCT image (magenta in RGB image) leakage points seen on the FA (green in RGB image) could be correlated with the anatomical changes noted on the OCT.
RESULTS
In total, 32 patients (38 eyes) with CSR were seen at the Academic Medical Centre and the New York Eye and Ear Infirmary. Male to female ratio was 3.6:1. The mean age (SD) was 44.3 (7.4) years and comparable between both sexes. Twenty six patients had unilateral disease, six patients had bilateral CSR. The median BCVA at onset was 20/30 (range 20/125–20/16). Seven patients were seen more than once. Seven patients (nine eyes) were seen with inactive CSR, defined as the absence of angiographic leakage and no visible neurosensory detachment. Of the active patients, 13 (15 eyes) had a first episode of CSR; nine (11 eyes) had a recurrence, and three were known to have chronic CSR (three eyes).
In eyes with active CSR (n = 29), the OCT ophthalmoscope allowed several distinct features to be identified. The most common feature was a large serous neurosensory detachment (23/29). When scanning the patient anteroposteriorly, the dome of the neurosensory detachment became visible first, as shown in figure 1B. When entering the deeper slices, the serous effusion appeared as a central dark area (fig 1C). The border of this detachment consisted of a single fuzzy broad band, encircled by anteriorly located retinal layers. More posterior scans revealed a highly reflective layer, corresponding to the RPE (fig 1D). The confocal image (fig 1A) shows the area involved in the detachment as a circular area, which gradually darkens centrally, as the surface reflectivity changes. Most neurosensory detachments were seen in the central macular area (23/29), but in six eyes the neurosensory detachment was located along the vascular arcade or adjacent to the optic nerve head. In some eyes (4/29; see also fig 5, case B) the inner border of the serous detachment was thickened, presumably from thickened fibrinous fluid, which was best seen in B-scan mode. On funduscopy in these eyes, a hazy yellow discoloration within the CSR lesion could be observed.
Figure 1.
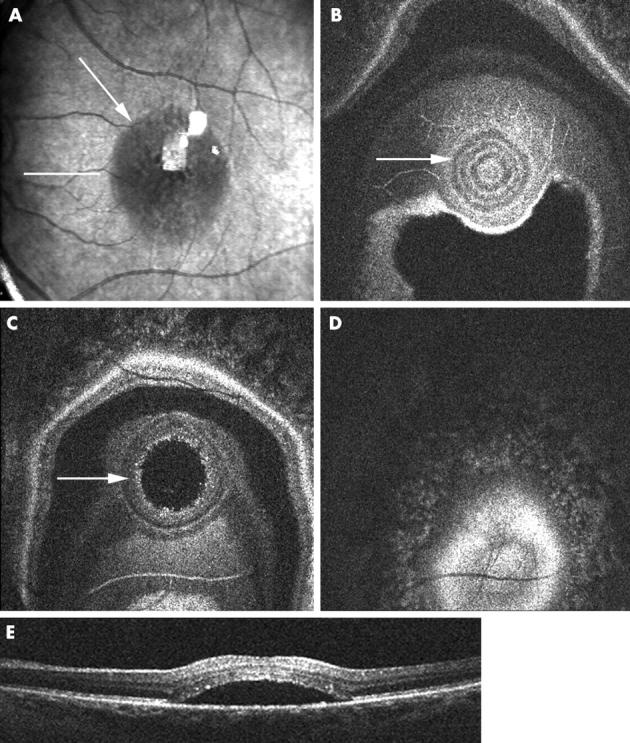
Serous neurosensory detachment as seen on OCT C-scan. (A) Confocal C-scan image showing a zone of darker reflectivity corresponding to the area of detachment (arrow). (B–D) Consecutive OCT C-scans showing the area of neurosensory detachment (arrows), the involved inner retinal layers (B, C), and intact retinal pigment epithelium (D). (E) En face OCT B-scan taken over the centre of the neurosensory detachment (indicated at level of straight line in A).
Figure 5.
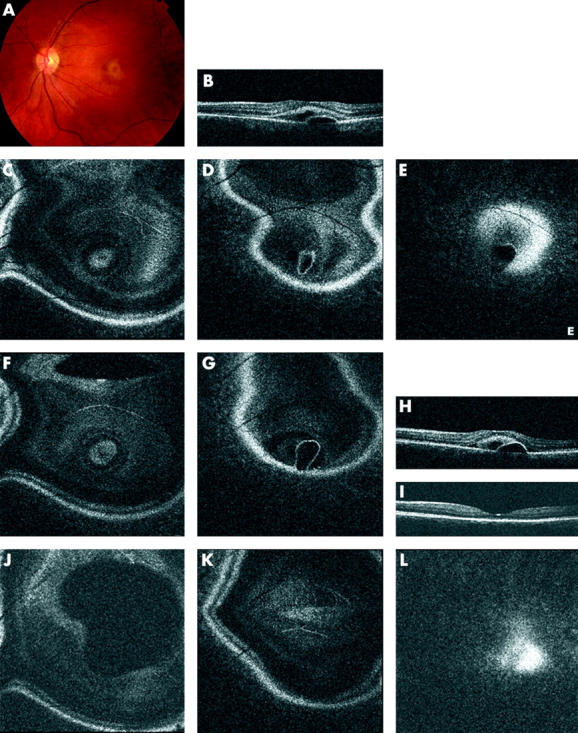
Case B, 31 year old pregnant woman. First visit at 27 weeks gestation. (A) Colour fundus photograph showing central yellow discoloration. (B) En face OCT B-scan showing a neurosensory and epithelial detachment. (C–E) Consecutive OCT C-scans showing the extent of the neurosensory detachment accompanied by an RPE detachment. Second visit at 31 weeks gestation. (F-H) OCT C-scans showing little change in the neurosensory detachment, but increase of the RPE detachment, confirmed by the OCT B-scan. Third visit in the eighth month of her pregnancy. (I) OCT B-scan shows restoration of the foveal contour. (J–L) OCT C-scans showing complete resolution of the neurosensory and RPE detachment.
Table 1 summarises the CSR characteristics seen in en face OCT scanning. In almost 70% of the eyes, hyper-reflective deposits were observed in the OCT C-scan, attached to the posterior layer of the neurosensory retina and overlying the serous detachment (fig 2). These precipitates could be seen on red-free photographs in only 50% of these eyes.
Table 1.
Characteristics in inactive and active central serous retinopathy (CSR) eyes (divided by first time, recurrent, or chronic episode) as observed by en face OCT
| Characteristic on OCT | Active CSR (first episode) | Active CSR (recurrent) | Active CSR (chronic) | Active CSR (total) | Inactive CSR | |
| n = 15 | n = 11 | n = 3 | n = 29 | n = 9 | ||
| Hyper-reflective deposits | 8 | 10 | 2 | 20 | NA‡ | |
| PED | 9 | 4 | 2 | 15 | 9 | |
| Small PED (<1/5 DD) | 7 | 4 | 2 | 13 | 5 | |
| Large PED (>½ DD) | 2 | None | None | 2 | 4 | |
| Within serous detachment | 4 | 2 | 1 | 7 | NA | |
| Outside serous detachment | 5 | 2 | 1 | 8 | NA | |
| Multiple small PEDs | 2 | 2 | 1 | 5 | 6 |
PED, pigment epithelial detachment; DD, disc diameter; NA, not applicable.
Figure 2.
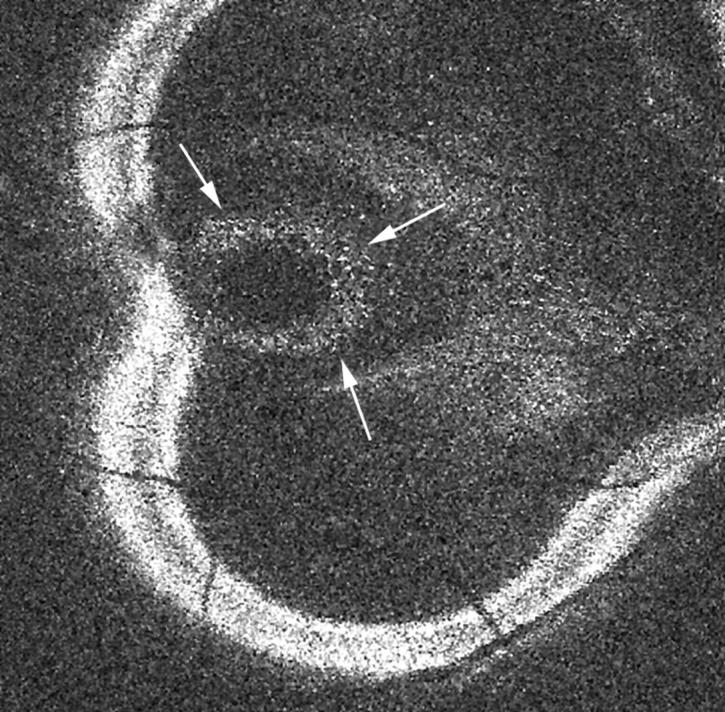
OCT C-scan showing hyper-reflective deposits aligning the outer layer of the detached neurosensory retina (little white spots indicated by small arrows). These deposits are also visible in figure 1C.
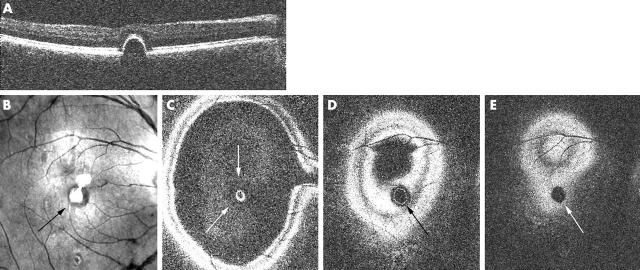
In both active and inactive CSR patients (15/29 and 9/9 eyes, respectively), PEDs were observed (table 1). PEDs were identified in the OCT C-scans as follows: the confocal image showed a circular dark, well defined area, caused by a change in surface reflectivity. Compared to a serous retinal detachment the dark zone is more homogeneous and its border is better defined (fig 3B). The border of the PED was seen as a very distinct, sharply reflective circular line, corresponding to the RPE (fig 3C, D). The en face OCT B-scan (fig 3A) shows the cross sectional image of the PED. In more than half of the eyes with active CSR, a PED was demonstrated and over 50% of these were located away from the serous detachment.
Figure 3.
Retinal pigment epithelium (RPE) detachment (observed in an inactive CSR patient) as seen on OCT C-scan. (A) En face OCT B-scan showing the RPE detachment. (B) Confocal C-scan image showing a change in the reflectivity of the retina in the area corresponding to the RPE detachment (arrow; central bright white spots are artefacts from the focusing lenses within the imaging device system). (C–E) Consecutive OCT C-scans showing the circular area of the PED, with outer retinal elevation (white arrows in C), the inner circle (black arrow in D) corresponding to the RPE detachment, and the dark circular area (white arrow in E) corresponding to the area underneath the PED, caused by its shadowing effect.
Eleven eyes had multiple small PEDs (size <1/5 disc diameter), and some of these were not associated with a neurosensory detachment. In eight eyes, the OCT C-scan was further analysed by creating an overlay with a representative frame taken from an FA. In three eyes an overlay could not be produced because of suboptimal OCT C-scans in two (extensive tilt in the OCT in one, poor confocal image quality in another) and unavailable FA in the third. On the overlays, the small PEDs seen on OCT correlated with small areas of hyperfluorescence on FA. Case A (fig 4) is a typical example of a patient with active CSR accompanied by small PEDs.
Figure 4.
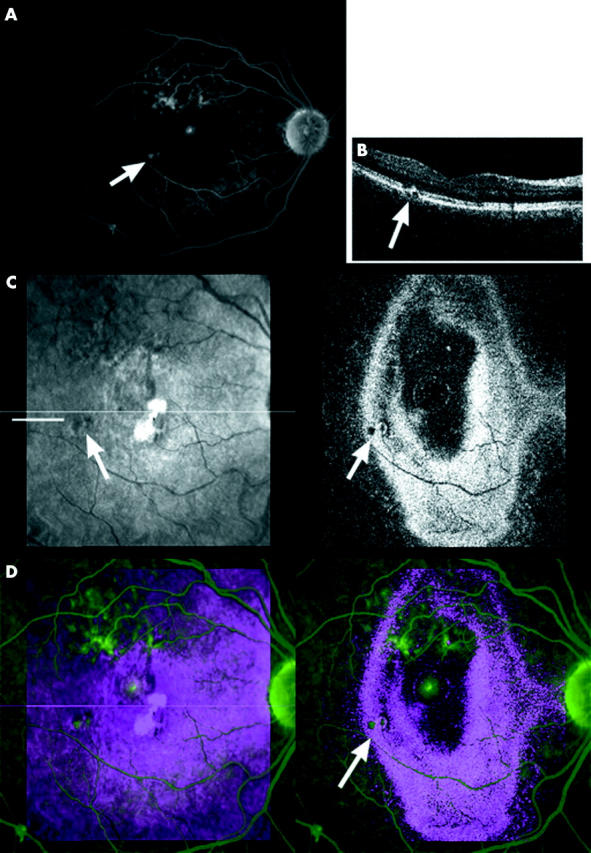
Case A, 41 year old woman, with a recurrent episode of CSR characterised by multiple small epithelial detachments (PED) and a small, central neurosensory detachment. (A) Small areas of leakage on a mid-phase FA (arrow). (B) En face OCT B-scan taken at site of indicated leakage on FA (indicated on C at level straight line) showing small PED. (C) OCT C-scan image, arrows indicate small PED (left: confocal, right: OCT image). (D) Overlay image C-scan (red/blue) and FA (green) confirming correspondence between PEDs on OCT and leakage on FA (arrow).
Seven eyes were followed over time. Six eyes had active disease. Final visual acuity in all eyes was 20/30 or better. Median follow up time was 6.5 months (range 3–12 months). Three had received focal laser treatment, the others resolved spontaneously. The foveal contour was restored in all eyes. In one eye, irregularities in an otherwise homogeneous, straight RPE layer remained present. Case B (fig 5), a typical example of CSR during pregnancy, illustrates more explicitly the use of the OCT ophthalmoscope in patient follow up.
DISCUSSION
Traditionally, CSR patients were followed biomicroscopically and by repeated FA. The introduction of the OCT gave one the ability to non-invasively diagnose, document, and follow patients over time. In this paper, our aim has been to document the OCT findings using en face OCT observed in patients with CSR, to determine their prevalence in this group, to follow changes over time, and to determine if scanning in a transversal direction, parallel to the retinal surface, provides additional information not available in the longitudinal mode alone.
Summarised in this paper are a number of OCT observations on CSR: presence of a large neurosensory detachment in 80% of the eyes, hyper-reflective deposits in 69%, PEDs in both active (52%) and inactive (100%) patients. These PEDs were often present outside areas of serous detachment and not all serous detachments had underlying PEDs. We observed the presence of multiple small PEDs in the macular area and along the vascular arcades in almost one third of the eyes (case A, fig 4). These small epithelial detachments were observed in eyes with active disease as well as in eyes in which the serous retinal component was no longer present. They were observed in patients who had CSR for the first time as well as in patients with recurrent or chronic disease.
The concept of such a diffuse RPE involvement is supported by a number of sources. Two recently published cases confirm the observation of multiple PEDs on OCT in patients with chronic CSR.7,15 FA has also demonstrated zones of diffuse epitheliopathy in patients with chronic CSR.4,16 In addition, “multiple presumed occult” PEDs were observed on indocyanine green (ICG) angiography in both acute and chronic stages.17 The current study indeed confirms, morphologically, the existence of multiple epithelial detachments in both acute and chronic CSR, and shows that this is a frequent finding (in almost 30% of patients). We were also able to show that FA and OCT findings coincide as demonstrated in the overlay images (fig 4).
Recent studies using ICG angiography suggest that CSR is a choroidal disease characterised by choroidal vascular hyperpermeability.4,5,17,18 Microrips occur at the junction of attached and detached RPE or along decompensated RPE cells that cause fluid to leak into the subretinal space, thus creating a neurosensory detachment.4,17 Perkins et al19 postulated that PEDs in CSR are a sign that larger areas of compromised RPE are involved. Focal leaks or defects in the RPE with normal surrounding epithelial cells do not give rise to subretinal fluid leakage.20 In the presence of dysfunctional RPE, there is reduced active transport of fluid from the retina towards the choroid, allowing accumulation of subretinal fluid; another argument for a more widespread dysfunction of RPE.
In our series, we also observed hyper-reflective spots located deep to the detached retina, that were only seen on half of all red-free photographs in these cases. These have not been previously described on conventional OCT scans or on ultrahigh resolution OCT. They were observed on red-free photographs as long ago as 1967.1,19 On both OCT B-scans and C-scans these bright spots are located on the posterior surface of the detached neurosensory retina. These precipitates might represent lumping of proteins as their concentration increases in the resolving fluid.1 Another explanation might be that these are cellular elements, but the highly reflective nature of these spots on the OCT scans makes this less likely. Perkins et al19 found a strong association between final recovery and the presence of subretinal precipitates on clinical examination. In our series, precipitates were observed in patients at all stages of CSR, whether acute, recurrent, or chronic. The OCT, being a more sensitive detection instrument, may enhance the ease with which these precipitates are recognised. A larger prospective series would be required to determine if these precipitates still have any prognostic significance.
The OCT ophthalmoscope is able, just as the conventional OCT, to objectively confirm the presence of serous neurosensory detachments and PEDs in CSR patients,6,8,9 and can be employed during follow up, especially when the use of contrast enhanced imaging techniques is contraindicated, like in pregnancy.21 In contrast with conventional longitudinal OCT scans, the OCT ophthalmoscope enabled us to visualise the extent of the disease more accurately by providing transversal OCT scans that give an instant overview of the central macular area at all levels within the retina and the RPE. It provided us with information regarding the full extent of the epitheliopathy, and not just the more obvious manifestations of the disease. Small PEDs can be directly recognised on the OCT C-scan, and for further confirmation a longitudinal OCT scan can be optimally positioned. We demonstrated a good correlation between the OCT findings and other imaging techniques using the software assisted overlay. Although FA still remains essential when treatment is considered, repeated use of contrast imaging may be avoided with the use of en face OCT as it provides comparable information regarding location and extent of involvement.
In summary, OCT provides non-invasive confirmation of a CSR. It shows that it is often diffuse in nature in both the acute and chronic stages. The OCT ophthalmoscope provides additional information on the extent of the area involved, and is comparable to the information provided by FA. In our view, the OCT is a good alternative in the diagnosis and follow up of patients with CSR, and obviates the need for contrast enhanced imaging.
Acknowledgments
This study was partly supported by Stichting OOG (The Hague, Netherlands) at the Academic Medical Centre.
Abbreviations
BCVA, best corrected visual acuity
CSR, central serous retinopathy
FA, fluorescein angiography
ICG, indocyanine green
OCT, optical coherence tomography
PED, pigment epithelial detachments
RPE, retinal pigment epithelium
Competing interests: none declared
REFERENCES
- 1.Gass JDM. Pathogenesis of disciform detachment of the neuroepithelium, II: Idiopathic central serous choroidopathy. Am J Ophthalmol 1967;63:587–615. [PubMed] [Google Scholar]
- 2.Otsuka S, Ohba N, Nakao K. A long-term follow-up study of severe variant of central serous chorioretinopathy. Retina 2002;22:25–32. [DOI] [PubMed] [Google Scholar]
- 3.Costa RA, Scapucin L, Moraes NS, et al. Indocyanine green-mediated photothrombosis as a new technique of treatment for persistent central serous chorioretinopathy. Curr Eye Res 2002;25:287–97. [DOI] [PubMed] [Google Scholar]
- 4.Yannuzzi LA, Slakter JS, Gross NE, et al. Indocyanine green angiography-guided photodymanic therapy for treatment of chronic central serous chorioretinopathy: a pilot study. Retina 2003;23:288–98. [DOI] [PubMed] [Google Scholar]
- 5.Chan WM, Lam DSC, Lai TYY, et al. Choroidal vascular remodelling in central serous chorioretinopathy after indocyanine green guided photodynamic therapy with verteporfin: a novel treatment at the primary disease level. Br J Ophthalmol 2003;87:1453–8. [DOI] [PMC free article] [PubMed] [Google Scholar]
- 6.Hee MR, Puliafito CA, Wong C, et al. Optical coherence tomography of central serous chorioretinopathy. Am J Ophthalmol 1995;120:65–74. [DOI] [PubMed] [Google Scholar]
- 7.Drexler W, Sattmann H, Hermann B, et al. Enhanced visualization of macular pathology with the use of ultrahigh-resolution optical coherence tomography. Arch Ophthalmol 2003;121:695–706. [DOI] [PubMed] [Google Scholar]
- 8.Iida T, Hagimura N, Sato T, et al. Evaluation of central serous chorioretinopathy with optical coherence tomography. Am J Ophthalmol 2000;129:16–20. [DOI] [PubMed] [Google Scholar]
- 9.Wang M, Sander B, Lund-Andersen H, et al. Detection of shallow detachments in central serous chorioretinopathy. Acta Ophthalmol Scand 1999;77:402–5. [DOI] [PubMed] [Google Scholar]
- 10.Podoleanu AG, Dobre GM, Cucu RC, et al. Combined multiplanar optical coherence tomography and confocal scanning ophthalmoscopy. J Biomed Opt 2004;9:86–93. [DOI] [PubMed] [Google Scholar]
- 11.Podoleanu AG, Seeger M, Dobre GM, et al. Transversal and longitudinal images from the retina of the living eye using low coherence reflectometry. J Biomed Opt 1998;3:12–20. [DOI] [PubMed] [Google Scholar]
- 12.Podoleanu AG, Jackson DA. Combined optical coherence tomography and scanning laser ophthalmoscopy. Electronics Letters 2002;34:1088–90. [Google Scholar]
- 13.Rogers JA, Podoleanu AG, Dobre GM, et al. Topography and volume measurements of the optic nerve using en-face optical coherence tomography. Optics Express 2001;9:533–45. [DOI] [PubMed] [Google Scholar]
- 14.Podoleanu AG, Rogers JA, Jackson DA. 3D OCT images from retina and skin. Optics Express 2000;7:292–8. [DOI] [PubMed] [Google Scholar]
- 14a.Van Velthoven ME, de Vos K, Verbraak FD, et al. Overlay of conventional angiographic and en-face OCT images enhances their interpretation. BMC Ophthalmol 2005;5:12. [DOI] [PMC free article] [PubMed] [Google Scholar]
- 15.Sawa M, Gomi F, Harino S, et al. Three-dimensional optical coherence tomographic findings of idiopathic multiple serous retinal pigment epithelial detachment. Arch Ophthalmol 2005;123:122–3. [DOI] [PubMed] [Google Scholar]
- 16.Bouzas EA, Karadimas P, Pournaras CJ. Central serous chorioretinopathy and glucocorticoids. Surv Ophthalmol 2002;47:431–48. [DOI] [PubMed] [Google Scholar]
- 17.Guyer DR, Yannuzzi LA, Slakter JS, et al. Digital Indocyanine green videoangiography of central serous chorioretinopathy. Arch Ophthalmol 1994;112:1057–62. [DOI] [PubMed] [Google Scholar]
- 18.Prunte C, Flammer J. Choroidal capillary and venous congestion in central serous retinopathy. Am J Ophthalmol 1996;121:26–34. [DOI] [PubMed] [Google Scholar]
- 19.Perkins SL, Kim JE, Pollack JS, et al. Clinical characteristics of central serous chorioretinopathy in women. Ophthalmology 2002;109:262–6. [DOI] [PubMed] [Google Scholar]
- 20.Marmor MF. New hypothesis on the pathogenesis and treatment of serous retinal detachment. Graefes Arch Clin Exp Ophthalmol 1988;226:548–52. [DOI] [PubMed] [Google Scholar]
- 21.Reinthal EK, Volker M, Freudenthaler N, et al. [Optical coherence tomography in the diagnosis and follow-up of patients with uveitic macular edema]. Ophthalmologe 2004;101:1181–8. [DOI] [PubMed] [Google Scholar]


